Finding the best CANSLIM stocks requires a stock screener that has exactly the right selectable criteria and a large historical financial database so you can backtest the results.
The best CANSLIM stock screeners for accurately finding growth stocks are Stock Rover for US investors and TradingView for international traders. Stock Rover has three pre-built CANSLIM screeners, one of which is free.
CANSLIM is touted as a highly profitable stock market strategy. We will discuss what CANSLIM is, how it works, and how to implement it in a stock screener that might beat the market. I will also share the CANSLIM stocks selected by our strategy.
Plus, I introduce an additional strategy that helps you select the best CANSLIM stocks for your portfolio using Buffett’s Margin of Safety.

We start by covering the CANSLIM methodology, but you can jump directly to the 5-step implementation guide.
The CANSLIM Strategy
CANSLIM is a stock investing growth strategy designed by William J. O’Neil to produce market-beating profit performance. The strategy involves investing in companies with high earnings growth, new products, and good institutional sponsorship and buying only in bull markets.
Vital criteria are Current Earnings, Annual Earnings, New Products, Supply, Leaders, Institutional Sponsorship, and Market Direction.
CAN SLIM has the following stock selection criteria:
- C – Current Earnings
- A – Annual Earnings
- N – New Products or Management
- S – Supply and Demand
- L – Leaders
- I – Institutional Ownership
- M – Market Direction
Pioneered by William J. O’Neil, the CANSLIM method is the basis for his classic investing book, “How to Make Money in Stocks.”
Many believe the CANSLIM methodology is a Value Investing strategy, but this is incorrect. The system criteria do not target finding undervalued stocks but instead, find companies with fast-growing earnings in growing markets with a competitive advantage. So, CANSLIM is more like a stock market growth strategy.
Find out more about the CANSLIM strategy’s past performance with our article: What is CANSLIM? Does CAN SLIM Outperform the Market?
The CANSLIM Method of Investing
C – Current Earnings
Has the company made a strong recent earnings announcement, which is considerably more than the earnings one year previously?
From his research, O’Neill discovered that most companies that experienced strong stock price growth had quarterly earnings growth above 70% before the price growth started.
However, that might be true for a small handful of hugely successful companies. Still, to build a portfolio of stocks, or at least have a choice of more companies, he recommends a most recent quarterly (MRQ) earnings per share (EPS) increase of at least 18-20%. He also suggests an accompanying sales growth of at least 25%.
The sales growth check is important because, without consistent sales growth, it is impossible to maintain earnings growth.
Has the company made a strong recent earnings announcement, considerably more than the earnings one year previously?
A – Annual Earnings.
Has the company shown good earnings growth in previous years? O’Neill suggests an annual earnings growth rate of at least 25%. He also suggests checking for a return on equity (ROE) of over 17%, as it implies the company is investing its capital efficiently.
Most stock screeners allow you to filter on 1-, 3-, and 5-year annual earnings growth rates. Select a 5-year annual earnings growth rate. This will help you filter out companies experiencing short-term growth or manipulate accounts to show higher earnings for a particular quarter. You can play with the timescale you use, but this seems like a reasonable criterion.
N – New Products, Management, or Price Highs.
Has the company innovated its product base or injected new management to seek higher performance? Here, we essentially move to a business question.
If a company has a history of innovation or developing products superior to the competition in price, quality, or both, this is an excellent signal for future stock price growth.
According to O’Neill, management or board changes were also a positive indicator. Injecting new blood into an organization’s leadership structure drives growth; New People = New Ideas.
I tend to disagree here; continually injecting or hiring externally to find that magic growth formula rarely works out positively.
Look at the history of Hewlett Packard (Ticker: HPQ); since the founders left, the company has constantly been injecting new management, merging, and spinning off, to the dismay of its shareholders and employees.
Finally, the suggestion is that new stock price highs might encourage further demand for the stock and push prices even higher.
S – Supply and Demand.
Does the stock have an increasing demand in the marketplace? Is trading volume increasing with the price?
Here, we get to a core principle: it is the only reason stock prices go up or down. Stock prices decrease if the sellers (supply) outnumber the buyers (demand). If demand outstrips supply, prices go up.
A stock price may go up or down daily, which is largely irrelevant. However, if you see volume growth and stock prices rise over weeks and months, you know demand is higher than supply.
O’Neill recommends that the daily trading volume be higher than the average volume for the stock in the previous three months.
L – Leaders
Is the company a leader in its marketplace? This is another key business question about competitive advantage.
A company that is a leader in its industry must have some key competitive advantages, either in the product, service quality, or pricing. However, finding these companies by sifting through every firm’s product listing and doing a competitive market analysis is difficult. So, O’Neill kindly suggests looking for companies with stock price strength higher than their competitors, even above 80% of the stock market.
Essentially, any company near, at, or breaking through its stock price 52-week high is a candidate. Add to this any company outperforming the major market indices regarding price growth. So, to beat the market, you need to select companies that are already beating the market. Does that seem reasonable?
I – Institutional Ownership.
Does the stock have a solid level of institutional ownership? More than 70% of all stocks are owned by institutions, mostly on behalf of their investors. If you have a pension or own ETFs, you will not own the stocks; you own part of the company that holds those stocks for you.
The point here is that you would want to see at least 30% institutional ownership to know that the company is at least on the radar of institutional buyers.
As investment companies have the most buying power, they can make the biggest impact on stock prices; if the company is not interesting to the investment firms, the chances of the stock price moving significantly higher or negligible.
Finally, if institutional ownership is over 90%, how much room is there for the stock price to increase? Not much.
M – Market Direction.
Understanding the overall market direction is important to time your stock purchase effectively.
The market moves in three directions: uptrend, downtrend, or consolidation (sideways). If you buy stocks during a multi-year bear market, then the chances of you making any money are small. During periods of market fear, most company stock prices drop.
According to O’Neill, 3 out of 4 stocks move in the same direction as the market.
The reality is that it takes 3 out of 4 stocks to move upwards to move the market upwards, as the market only reflects all the stock prices. The key takeaway here is that if you buy stocks in a Bull market, you have a much greater chance of making a profit, and that is a fact.
Stock Rover 4.7/5⭐ : My Top Pick for Smart Investors
Investing In Stocks Can Be Complicated. Stock Rover Makes It Easy.
★
Growth Investing - with industry-leading
Research Reports ★
★ Value Investing - using Warren Buffett's Fair Value and Margin-of-Safety ★
★ Income Investing - rank by yield, growth, quality, and safety using 650 metrics ★

"I have been researching and investing in stocks for 20 years! I now manage all my long-term investments using Stock Rover." — Barry D. Moore, Founder: LiberatedStockTrader.com
CANSLIM Strategy Explained
The CANSLIM strategy is a flexible investing style that relies on the positive stock price momentum generated by fast-growing, profitable companies with solid quarterly and annual earnings growth. The companies must also have innovative leading products and services in a growing bull market.
Now, let’s step back to understand the overall CANSLIM strategy.
Flexibility: With CANSLIM, a stock has no defined holding period. You may hold the stock for two days or two years. It could be seen as a swing trading strategy or a medium-term buy-and-hold strategy. One thing it is not is a value investing strategy.
The entry point into stock is suggested when the stock price breaks into a new 52-week high. The strategy also suggests cutting your losses and selling if the stock falls 7 to 8. For any given stock, this could happen within a week or over years; therefore, a flexible timeframe.
Momentum: CANSLIM is a momentum strategy. The rules are to buy when the stock is at a new 52-week high, experiencing increased trading volume, and when the overall market is in an uptrend. This is the definition of momentum trading and market timing.
Profitable Growth: The CANSLIM strategy also requires a company to grow earnings strongly. Current quarterly and annual earnings must increase aggressively, along with sales. So, you are looking for profitable, fast-growing companies.
Great Products: Of course, the L in CANSLIM refers to companies leading their industry in product and services, innovation, or stock price growth. This makes sense. Would you want to buy shares in a company falling behind its competitors?
Growing Markets: Finally, the M in CANSLIM refers to growing markets. The market that the company operates in needs to be growing, for example:
- The widespread rapid adoption of the internet fueled Google’s explosive growth.
- Over the last eight years, Nvidia’s growth has partly been fueled by the Cryptocurrency craze; their graphics card chips are used in Crypto mining operations.
The CANSLIM strategy is to:
Buy stocks in profitable companies, with great products, in growing markets at the right time.
Invest in yourself! Get all our courses & strategies for 50% off

★ Liberated Stock Trader Pro Stock Investing & Trading Course ★
★ M.O.S.E.S. Market Outperforming ETF Strategy ★
★ LST Beat the Market Stock Picking Strategy ★
★ Exclusive Bonus Course – The Stock Market Crash Detector Strategy ★
★ Fully Guided Videos, eBooks & Lifetime Email Support ★
★ 108 Videos + 3 Full eBooks + 5 Scripts for TradingView & Stock Rover ★
CANSLIM Stock Screener
A CAN SLIM stock screener must scan for Current and Annual Earnings with a 5-year history. Next, the screener must filter on 52-week stock price highs, the Number of Shares Available, and the share price Relative Strength vs. Competitors. The Institutional Ownership criteria are also critical.
To implement a CANSLIM strategy, you must use a stock screener to automatically scan the entire stock market to find stocks that meet the right criteria.
The Best CANSLIM Stock Screener
The best CANSLIM stock screener on the market today is Stock Rover for USA and Canada exchanges and TradingView for international exchanges. If you intend to implement this system on US and Canadian stocks, we strongly recommend Stock Rover; it won our Top 10 Best Stock Screener Review and is also great value for money.
This article will show you how to implement CANSLIM using Stock Rover.
The CANSLIM Screener Results
The CANSLIM strategy results using the Stock Rover screener are impressive, beating the S&P 500 on all timescales from 5 days to 10 years; look at the screenshot below.
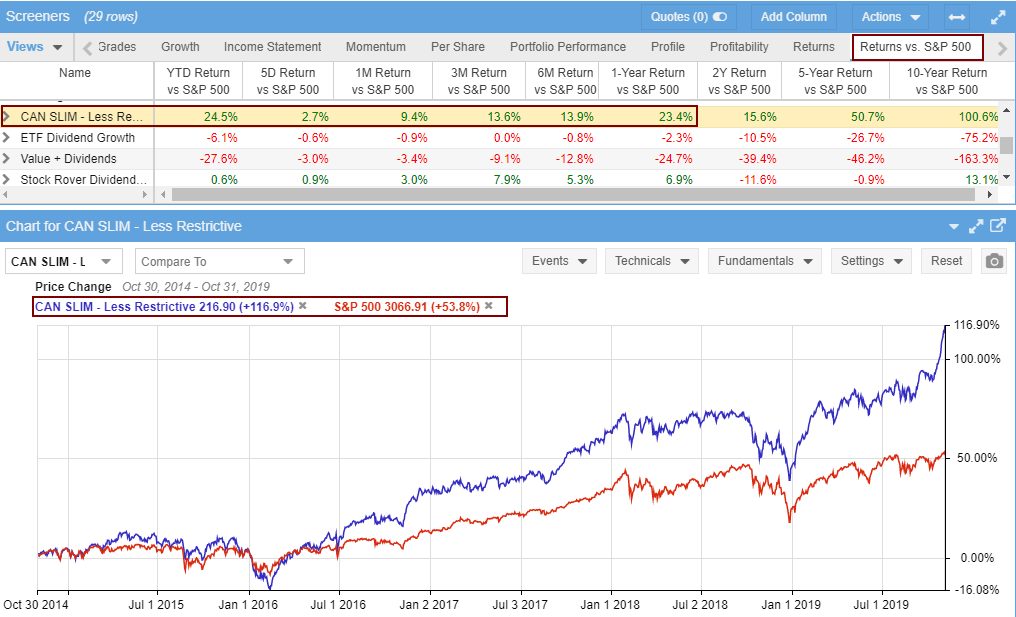
Get the CANSLIM Method Screener on Stock Rover
You can see that the CANSLIM scan in Stock Rover has beaten the S&P 500 solidly over the past years.
| CANSLIM vs. S&P 500 | Stock Rover CANSLIM | S&P 500 |
| 1-Year | +48.1% | +10.5% |
| 5-Year | +176% | +68.3% |
5-Step Guide to Screening for CANSLIM Growth Stocks
Here are the 5 Steps to implement the Stock Rover CANSLIM stock screening strategy.
1. Get The Best CANSLIM Stock Screener
You will need a Stock Rover Premium Plus Membership, which gives you access to all the criteria and the database with a unique 10-year history. It will also allow you to implement all our Warren Buffett screeners, our full list of stock screening strategies, and our Dividend growth and dividend yield strategies.
Stock Rover 4.7/5⭐ : My Top Pick for Smart Investors
Investing In Stocks Can Be Complicated. Stock Rover Makes It Easy.
★
Growth Investing - with industry-leading
Research Reports ★
★ Value Investing - using Warren Buffett's Fair Value and Margin-of-Safety ★
★ Income Investing - rank by yield, growth, quality, and safety using 650 metrics ★
"I have been researching and investing in stocks for 20 years! I now manage all my long-term investments using Stock Rover." — Barry D. Moore, Founder: LiberatedStockTrader.com
2. Browse Screener Library
Launch Stock Rover and select:
- Screeners (Down Arrow)
- Browse Screener Library
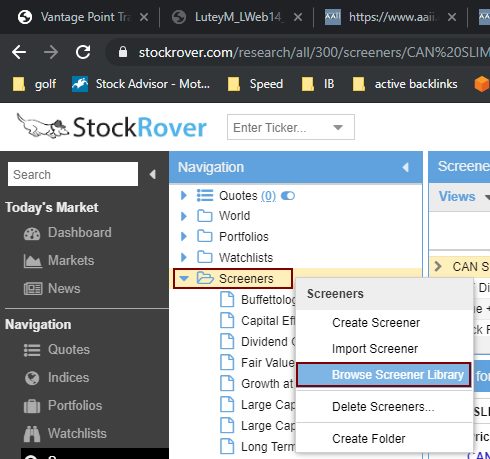
This takes you to the following screen.
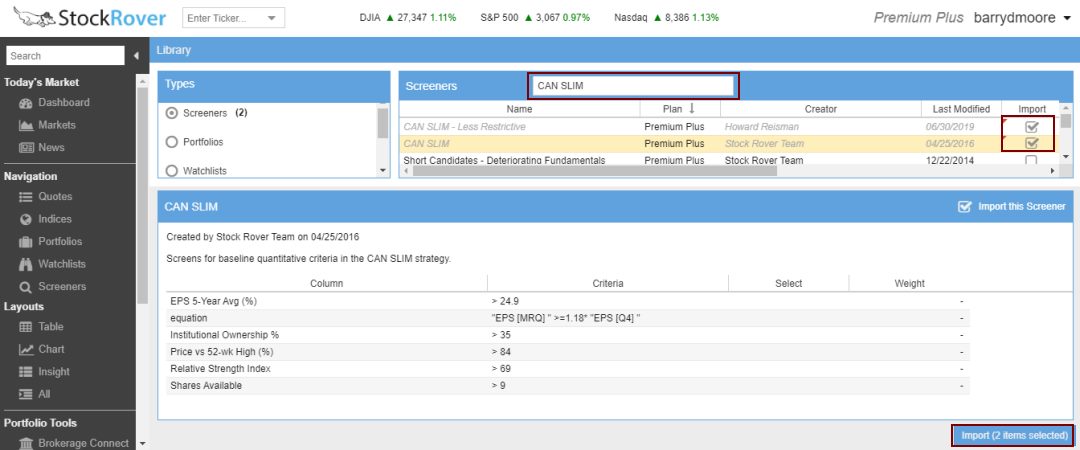
3. Import the CANSLIM Screener
Stock Rover has a built-in screen for CANSLIM called “CAN SLIM – Less Restrictive,” it has an outstanding performance record.
This is the screener we will be using.
- In the Screeners search box, type “CAN SLIM.”
- Select the two CAN SLIM Screeners
- Click Button – Import (2 Items Selected)
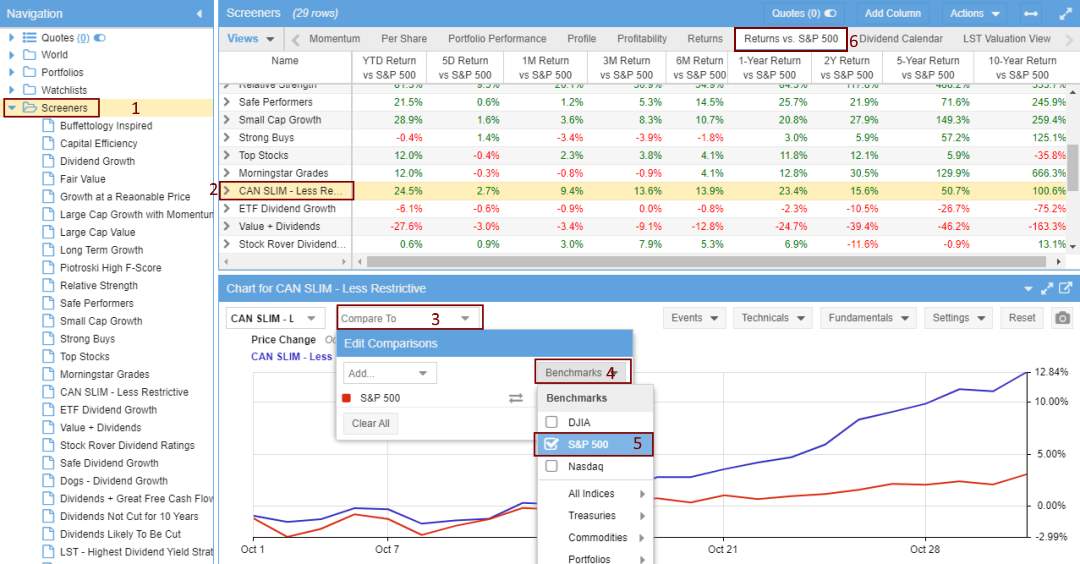
4. View the Portfolio Performance
Now that you have imported the screener, here is how to set up the excellent comparison view vs. the S&P 500
- Select Screeners
- Select the CAN SLIM – Less Restrictive Screener
- In the Chart Below, Select “Compare To.”
- Select Benchmarks
- Select S&P 500 or NASDAQ
- Select Return vs. S&P 500 Column Views
5. Select Your CANSLIM Stocks
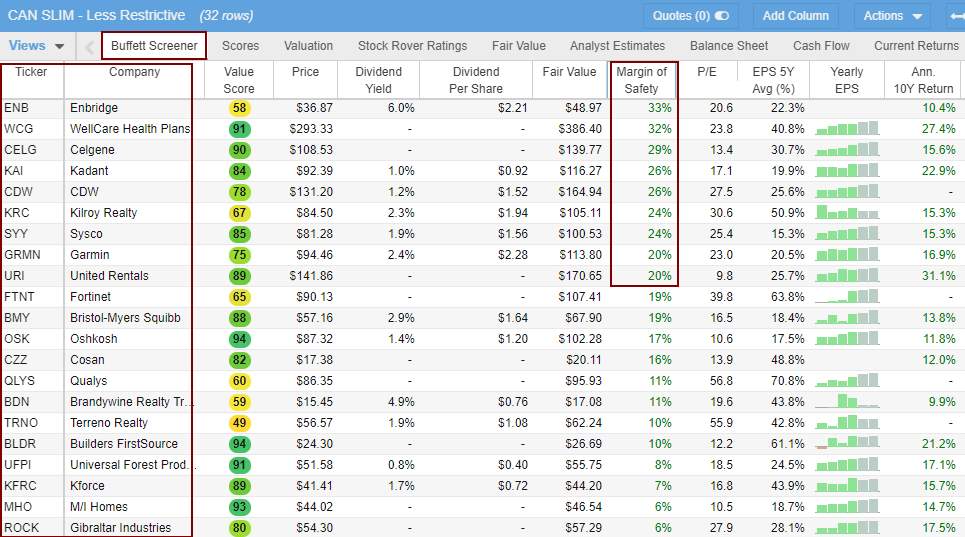
The scan produces a list of 32 stocks from the entire stock exchange listing of over 12,000 companies. Even though this list is small, 32 may still be too many to hold at any one time. So, you must carefully select the right companies to invest in.
I suggest you combine the CANSLIM strategy with Warren Buffett’s margin of safety concept in value investing. The margin of safety measures how undervalued a stock is compared to its intrinsic value. The more undervalued a stock is, the safer the investment.
So, you could narrow down your stock selection using, for example, the top 10 stocks with the highest margin of safety. See the image below.
CANSLIM Stock Screener Criteria
The CANSLIM screener criteria we are using are as follows:
- Current Earnings – EPS (MRQ) >= 1.18* EPS [Q4]
- Annual Earning – EPS 5-Year Average (%) > 24.9
- New Price High – Price vs. 52-week high (%) >84
- Supply – Shares Available (Millions) > 9
- Leader – Relative Strength Index > 69
- Institutional Ownership % > 35
- Market Direction – Is the Market Trend Up?
As you can see, all the factors in CANSLIM are covered, except for the overall market direction; you can decide for yourself by looking at a stock chart of the S&P500. Read this article for further information on stock market direction.
Stock Rover 4.7/5⭐ : My Top Pick for Smart Investors
Investing In Stocks Can Be Complicated. Stock Rover Makes It Easy.
★
Growth Investing - with industry-leading
Research Reports ★
★ Value Investing - using Warren Buffett's Fair Value and Margin-of-Safety ★
★ Income Investing - rank by yield, growth, quality, and safety using 650 metrics ★
"I have been researching and investing in stocks for 20 years! I now manage all my long-term investments using Stock Rover." — Barry D. Moore, Founder: LiberatedStockTrader.com
CANSLIM Stock Trading System
The CANSLIM stock trading strategy entails deciding how often you will rebalance and rotate the stocks within your CANSLIM portfolio and how much cash you will allocate to each stock.
CANSLIM Portfolio Rebalancing
One example of how you could do it comes from the backtested CANSLIM results in the previously mentioned OPBMII paper. This paper suggests rebalancing the portfolio weekly:
Rebalancing – It should be noted that the system rebalances (re-runs the screen and possibly select new holdings) every week.
Of course, a weekly portfolio rebalance may be time-consuming, so you might want to lengthen it to bi-monthly or monthly. However, the rebalance does not need to be expensive, as now there are brokerage accounts like our partner Firstrade that offer $0 commissions. This means a regular rebalance will not cost you anything.
CANSLIM Portfolio Cash Allocation
The CANSLIM backtesting research paper used cash allocation, holding a maximum of 10 stocks, each worth 10% of the invested portfolio capital.
Weighting Ideally, the system will select 10% weighting to each position with a maximum of 10 positions.
This sounds reasonable to me if you are investing at least $10,000, which would be $1,000 per stock.
Exiting & Selling the Stocks
Academic research suggests buying stocks when they meet the CANSLIM criteria and selling stocks if they lose 7%.
Exits/Closing Positions if a stock drops 7% after purchase, it will be removed but considered at the rebalance the next week (if it still passes criteria).
The Best CANSLIM Stocks List
Here is a list of the 42 best stocks the Stock Rover CANSLIM Screener selected.
| Ticker | Company | Industry | EPS 1-Year Chg (%) | 1Y Return vs. S&P 500 |
| RCMT | RCM Technologies | Engineering & Construction | – | 287% |
| AAV.TO | Advantage Energy | Oil & Gas E&P | – | 234% |
| AAVVF | Advantage Energy | Oil & Gas E&P | – | 222% |
| TOU.TO | Tourmaline Oil | Oil & Gas E&P | 98% | 164% |
| AMPH | Amphastar Pharmaceuticals | Drug Manufacturers – Specialty & Generic | 2400% | 121% |
| RNMBF | Rheinmetall | Industrial Distribution | 4007% | 119% |
| IZQVF | Indivior | Drug Manufacturers – Specialty & Generic | 108% | 115% |
| ANDE | Andersons | Food Distribution | 61% | 99% |
| MN | Manning & Napier | Asset Management | 120% | 93% |
| BLMIF | Bank Leumi Le-Israel | Banks – Regional | 65% | 73% |
| IPXHF | Inpex | Oil & Gas E&P | – | 68% |
| CLPXF | China Longyuan Power Gr | Utilities – Renewable | 17% | 65% |
| CNR | Cornerstone Building | Building Products & Equipment | 1053% | 57% |
| MUSA | Murphy USA | Specialty Retail | 23% | 48% |
| ADVOF | ADVA Optical Networking | Communication Equipment | 51% | 30% |
| HAIPF | Infinya | Paper & Paper Products | 555% | 29% |
| KKOYF | Kesko | Grocery Stores | 20% | 29% |
| OGE | OGE Energy | Utilities – Regulated Electric | 99% | 26% |
| VRTX | Vertex Pharmaceuticals | Biotechnology | -14% | 23% |
| EZPW | EZCORP | Credit Services | – | 22% |
| Y | Alleghany | Insurance – Property & Casualty | 53% | 19% |
| WCN.TO | Waste Connections | Waste Management | 178% | 17% |
| WCN | Waste Connections | Waste Management | 178% | 17% |
| DCNSF | Dai-ichi Life Holdings | Insurance – Life | 38% | 16% |
| AHODF | Koninklijke Ahold Delhaiz | Grocery Stores | 75% | 16% |
| ACHC | Acadia Healthcare Co | Medical Care Facilities | 38% | 15% |
| YMTKF | Yamato Kogyo | Steel | 473% | 14% |
| JFEEF | JFE Holdings | Steel | – | 14% |
| FELTF | Fuji Electric Co | Electrical Equipment & Parts | 70% | 13% |
| MRK | Merck & Co | Drug Manufacturers – General | 76% | 13% |
| DWMNF | DOWA Holdings | Other Industrial Metals & Mining | 163% | 10% |
| AEGOF | Aegon | Insurance – Diversified | – | 9% |
| K | Kellogg | Packaged Foods | 17% | 3% |
| PSPSF | PSP Swiss Prop | Real Estate – Diversified | 78% | 1% |
| CWQXF | Castellum | Real Estate – Development | 28% | 0% |
| NLTBF | Nolato | Conglomerates | 15% | -4% |
| KMRCF | Komori | Specialty Industrial Machinery | – | -5% |
| KACPF | Koa | Electronic Components | 143% | -6% |
| FMMFF | Fuji | Specialty Industrial Machinery | 20% | -6% |
| HURN | Huron Consulting Group | Consulting Services | 163% | -12% |
| REGI | Renewable Energy Gr | Oil & Gas Refining & Marketing | 125% | -14% |
| RSTRF | Restaurant Brands Intl | Restaurants | 57% | -21% |
Get the CANSLIM Stocks List with Stock Rover
CANSLIM Investing Strategy Summary
I hope you found this guide useful for learning about CANSLIM, practically understanding the strategy, and implementing it into a cohesive methodology using a stock screener. We explored the system’s historical performance and found it has merit and could be a solid solution to stock selection and portfolio management.
TradingView 4.8/5⭐ : The Best Trading Platform I’ve Tested in 20+ Years
With lightning-fast charts, powerful pattern recognition, smart screening, backtesting, and a global community of 20+ million traders — it’s a powerful edge in today’s markets.

If you want one platform that gives you an edge, this is it.
Hi Bipin, stock rover is only for the USA. TradingView would be your best option for the India markets.
Barry
Sir, I am from India. Can stockrover screener be used to search Indian stock market stocks?
Hi Dave, I checked in the book and you are indeed correct. Thanks for letting me know, I have now corrected the text.
Much appreciated. Barry
Thank you for the helpful article.
Regarding the note under Exiting & Selling the Stocks “The tests also sold stocks if they lost 7%, O’Neill suggested 20%, but I find 20% too much to risk on any one trade.”
O’Neill’s does not suggest waiting until you lose 20% to sell. His rule matches the test which is to sell if you lose 7% to 8%. This may be a mix-up with his suggestion to sell once you have gained 20% unless you gain 20% quickly which may signal more gains to come.
Hi Bini, thanks for the message. I am glad you like the LSTB method, which for those who do not know is the Liberated Stock Trader beat the Market Strategy. https://www.liberatedstocktrader.com/lst-beat-the-market-screener/
Yes I have 25% of my portfolio in it.
Thanks for letting me know.
Barry
Great analysis and explanation. I tried LSTB method starting last October and I am happy with it. I am going to try this strategy with 10% of my account with all of it divided equally among 10 stocks.
Yes, you can adjust it to 70% for accuracy. But the strategy is to buy stocks that are strong therefor the Relative strength needs to be high not low.
Doesn’t the CANSLIM strategy utilize a relative strength rank (vs competitors)? It appears that the screener shown is using the Relative strength index > 69 (oversold vs overbought). Wouldn’t a RSI >70 indicate the stock is being overbought and due for a declining adjustment?
Hi William, thank you so much for your positive feedback.
Barry
Thank you for a wonderful analysis