Becoming a skilled investor requires proficiency in analyzing a balance sheet.
This vital financial document offers valuable insights into a company’s overall financial well-being, providing a comprehensive summary of its assets and liabilities.
The balance sheet in finance can be one of the most challenging yet important concepts to understand. Businesses, investors, and financial professionals must have a firm grasp of how to interpret the information generated by a company’s balance sheet.
What is a Balance Sheet?
The balance sheet is a key financial statement that summarizes an organization’s assets, liabilities, and equity at a point in time. It provides detailed figures about what the company owns and owes to other parties, such as creditors and investors. The balance sheet also provides insight into the organization’s financial position and the ability to pay its obligations.
How to Read a Balance Sheet
To read a balance sheet effectively, focus on three main sections: assets, liabilities, and equity. Assets represent what the company owns, liabilities show what it owes, and equity reflects its net worth.
Analyze how these components interact to assess the company’s financial health and stability. Look for trends over time to understand changes in the organization’s financial position.
The “Balance” in Balance Sheets
Per standard accounting procedures, all public companies must provide a balance sheet. This crucial financial document enables stakeholders to assess the company’s monetary inflow (liabilities), outflow (assets), and overall accumulated value (equity). By deducting liabilities from assets, the balance sheet presents the organization’s net worth. Not only does it provide a comprehensive snapshot of the company’s financial health, but it also facilitates easy comparison and analysis.
The balance sheet should always be in balance.
Assets = Liabilities + Shareholder Equity
Stock Rover 4.7/5⭐ : My Top Pick for Smart Investors
Investing In Stocks Can Be Complicated. Stock Rover Makes It Easy.
★
Growth Investing - with industry-leading
Research Reports ★
★ Value Investing - using Warren Buffett's Fair Value and Margin-of-Safety ★
★ Income Investing - rank by yield, growth, quality, and safety using 650 metrics ★

"I have been researching and investing in stocks for 20 years! I now manage all my long-term investments using Stock Rover." — Barry D. Moore, Founder: LiberatedStockTrader.com
Components of a Balance Sheet
Reading a balance sheet involves understanding its components and how they interact with one another. The essential components are assets, liabilities, and equity.
Assets
Assets refer to anything that has value and can be converted into cash. They include tangible items, such as property, equipment, or inventory, and intangible items, such as goodwill, copyrights, or trademarks.
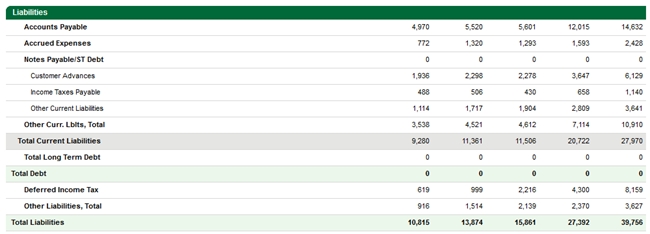
Liabilities
Liabilities are obligations to another party that must be paid off over time. They include long-term debt, short-term debt, accounts payable, and any other debts the company may owe.

Equity
Equity is the amount of ownership held by shareholders. It is calculated by subtracting liabilities from assets and reflects the residual value of a company’s assets after all debts have been paid off.
The Importance of Balance Sheets to Investors
Balance sheets are important for stakeholders when evaluating a company’s financial health and performance.
By understanding how assets, liabilities, and equity interact within a balance sheet, investors can assess a company’s current state and predict its future financial standing.
Additionally, familiarizing oneself with financial ratios derived from balance sheets provides further insight into a company’s efficiency and profitability. These elements can give stakeholders an accurate picture of the company’s financial position and help them make informed investment decisions.
Balance Sheets and Financial Decisions
Balance sheets are also useful for management teams to plan for the future. By understanding their current financial standing and trends in their balance sheet components, management can identify areas of weakness that need to be addressed and track their progress as they work to improve the company’s financial health. This planning process can help management teams stay ahead of the competition and make financial and business decisions that benefit the company’s bottom line.
Understanding a Balance Sheet
Interpreting a balance sheet involves understanding the relationships between assets, liabilities, and equity. The total of all assets should equal the sum of liabilities and equity, known as the “balance” in a balance sheet.
Understanding how each component affects the company’s financial position is also important. For example, if a company’s assets increase, its liabilities and equity will also increase. On the other hand, if a company’s liabilities increase, then its assets and equity will decrease.
Finally, it is important to understand the liquidity of a company’s assets. Liquidity refers to how quickly an asset can be converted into cash and indicates how quickly the company can pay its bills. It is important to look at the current assets (those that can be easily converted into cash) and the non-current assets (assets that take longer than one year to convert into cash).
A Practical Balance Sheet Example
To illustrate the relationship between assets, liabilities, and equity, let’s consider a hypothetical company, XYZ Corp. Here is a simplified version of its balance sheet:
| XYZ Corp. Balance Sheet | USD |
| Assets | $2,000,000 |
| Liabilities | $800,000 |
| Equity | $1,200,000 |
This balance sheet shows that ABC Corp. has total assets worth $2,000,000. Its total liabilities, or what it owes to others, amount to $800,000. The remainder, $1,200,000, represents equity, which is the value of assets after all liabilities have been accounted for.
The relationship between these elements can be seen in the fundamental accounting equation: Assets = Liabilities + equity. In our example, the $2,000,000 of assets equals the $800,000 of liabilities plus the $1,200,000 of equity.
If XYZ Corp. were to acquire new assets through a loan (increasing liabilities), both assets and liabilities would increase, keeping the equation balanced.
Conversely, if XYZ Corp. were to pay off a chunk of its debts (decreasing liabilities), it would decrease its assets (cash used to pay the debt), but equity would remain the same, maintaining a balanced equation. These operations illustrate the fluid, interrelated nature of the balance sheet components.
How to Simplify Financial Analysis
Stock Rover makes investing research a breeze; it is not just an excellent platform for financial analysis; it’s a game-changer that takes investors’ decision-making process to the next level.
Stock Rover 4.7/5⭐ : My Top Pick for Smart Investors
Investing In Stocks Can Be Complicated. Stock Rover Makes It Easy.
★
Growth Investing - with industry-leading
Research Reports ★
★ Value Investing - using Warren Buffett's Fair Value and Margin-of-Safety ★
★ Income Investing - rank by yield, growth, quality, and safety using 650 metrics ★
"I have been researching and investing in stocks for 20 years! I now manage all my long-term investments using Stock Rover." — Barry D. Moore, Founder: LiberatedStockTrader.com
Stock Rover provides a comprehensive suite of financial data, including everything from balance sheet components to critical financial ratios such as ROA and ROE. This ability to consolidate and visualize key financials enables users to assess a company’s performance quickly, compare it with industry norms, and identify trends over time.
One of Stock Rover’s standout features is its alert system, which automatically flags any potential red flags in a company’s accounts. Whether there’s a sharp increase in debt, a sudden drop in equity, or any other significant financial change, Stock Rover promptly notifies the user. This allows for timely and informed decision-making, significantly reducing the risk of financial oversight.
In conclusion, Stock Rover is an invaluable tool for investors. It offers comprehensive financial analysis and automatic alerts to potential issues, thereby aiding in the efficient and effective evaluation of potential investment opportunities.
Related Articles: Finding Great Stocks With Stock Rover
- 12 Legendary Strategies to Beat the Market That [Really] Work
- Our Beat the Market Screener [Actually] Beats the Market
- All Value Investing Strategies & Articles
- Use a CANSLIM Stock Screener Strategy To Beat the Market
Interpreting Financial Ratios in the Balance Sheet
In addition to understanding the components of a balance sheet, it is also important to interpret financial ratios related to the balance sheet. Financial ratios help us measure the performance and health of a company in comparison to industry standards or other companies. Some common financial ratios include the current ratio, quick ratio, debt-to-equity ratio, and return on equity.
Current ratio
For example, the current ratio is calculated by dividing total current assets by total current liabilities. It indicates how efficiently a company can pay its short-term obligations. A higher number indicates that more liquid assets are available to cover short-term debt, while a lower number suggests the opposite.
Debt-to-assets ratio
The debt-to-assets ratio is another important financial ratio that provides insight into the company’s financial health. It is calculated by dividing total liabilities by total assets and measures how much of a company’s assets are funded through debt. A higher number indicates a greater reliance on debt to fund operations, while a lower number indicates less dependence on debt.
Return on Assets (ROA)
The return on assets (ROA) ratio is calculated by dividing net income by total assets and measuring how much a company’s assets contribute to its profits. A higher number indicates that more of the company’s resources generate income, while a lower number suggests underutilized assets.
Return on equity (ROE)
The return on equity measures how efficiently management uses shareholders’ funds to generate a profit. ROE is calculated by dividing net income by shareholders’ equity and expresses the rate of return that shareholders receive for their investments. A higher number indicates better management performance, while a lower number suggests the opposite.
By understanding these financial ratios and how they are calculated from the components of a balance sheet, investors can better assess a company’s financial health and performance. Moreover, understanding these ratios gives insight into how future operations may affect a company’s financial standing.
Using Balance Sheets for Investment Decisions
Investors can use balance sheets to help make informed investment decisions. By comparing the components of a balance sheet with those of similar companies in the same industry, investors can gauge a company’s health and determine whether it has good potential for growth.
For example, if a company’s total assets are significantly larger than those of its competitors, this could indicate that the company has a greater ability to expand its operations and increase profits. Similarly, if a company’s debt-to-assets ratio is lower than the industry average, it could signify that it is better able to meet or pay off its short-term obligations. Understanding how companies compare to their peers in terms of balance sheet components can be valuable information when making investment decisions.
Understanding Balance Sheets and Company Health
The balance sheet is important for understanding a company’s financial health at a fundamental level. By comparing its components to industry averages and other companies in the same sector, investors gain insight into a company’s strengths and weaknesses.
Moreover, by understanding how changes may impact each component on the balance sheet, they can better understand how the company may fare in the future—ultimately, understanding how a balance sheet works can be invaluable for investors and business owners.
10 Tips for Interpreting a Balance Sheet
- Review Historical Trends: Look at multiple years of balance sheets to identify asset, liability, and equity trends. This can give insight into a company’s financial trajectory.
- Analyze the Current Ratio: The current ratio indicates a company’s ability to pay short-term obligations or those due within one year. A higher ratio is preferable.
- Evaluate Debt-to-Assets Ratio: This ratio indicates how much of the company’s assets are financed by debt. A lower ratio suggests the company is less reliant on borrowed money.
- Understand Return on Assets (ROA): ROA indicates how well a company uses its assets to generate profit. A higher ROA can suggest better financial performance.
- Scrutinize Return on Equity (ROE): ROE measures the financial return that business owners receive on their share of investment. A higher ROE is generally better.
- Compare with Industry Norms: Compare the company’s financial ratios with industry averages to understand its standing relative to other firms in the same sector.
- Identify Red Flags: Look out for sudden changes, such as a sharp increase in debt or a drop in equity. These could signal potential financial problems.
- Assess Liquidity: Review the company’s current and quick ratios to assess its ability to cover its short-term liabilities with its short-term assets.
- Examine Asset Turnover: This ratio shows how efficiently a management team uses its assets to generate sales. Higher turnover is generally better.
- Consider Intangible Assets: These can include things like trademarks and patents. While they may not have a physical presence, they can significantly affect a company’s market value.
FAQ
What is a balance sheet?
A balance sheet summarizes a company's financial position, showing assets, liabilities, and shareholder equity at a specific time. Assets include cash, investments, and property, while liabilities represent debts. Shareholder equity is the remaining funds after settling all debts.
Why are balance sheets important?
Balance sheets are important because they provide investors insight into a company's performance and risk level. Investors can identify potential opportunities and risks by analyzing current assets versus liabilities and comparing them to industry averages and other companies in the same sector.
What is included on a balance sheet?
Balance sheets typically include cash, investments, property, liabilities (or what is owed to creditors), and shareholder equity (the amount remaining if all debts were paid off). They may also include intangible assets such as trademarks or patents.
How are balance sheets used?
Investors can utilize balance sheets to evaluate the financial condition of companies and make informed investment choices. For businesses, balance sheets can serve as a means to monitor their progress over time or compare their performance with competitors.
What is the format of a balance sheet?
Most balance sheets comprise two sides: assets and liabilities, along with shareholder equity. The sum of total liabilities and equity always balances the total assets. Common formats include horizontal analysis (shows changes over time), vertical analysis (displays percentages of each item compared to total assets or liabilities & equity), and comparative analysis (compares multiple companies).
What is meant by liquid assets on a balance sheet?
Liquid assets can be readily converted into cash without substantial loss in value. Examples of such assets include cash and marketable securities like stocks or bonds held for investment purposes.
What does current ratio mean on a balance sheet?
The current ratio measures a company's ability to pay short-term debts with liquid assets. Divide current assets by current liabilities to calculate. A ratio over 1 means they have enough liquidity, while lower ratios show a lack of liquidity.
How does depreciation impact a balance sheet?
Depreciation is when an asset loses value over time due to wear and tear or obsolescence. This should be reflected on the company's income statement as an expense, which will reduce the shareholders' equity on the balance sheet.
Are there any limitations associated with balance sheets?
Yes, Traditional accounting methods often overlook non-financial factors, such as customer satisfaction and employee morale, that can impact success. Measuring intangible assets, like goodwill, can also be difficult.
What is the difference between a balance sheet and a P&L statement?
A balance sheet outlines a company's assets, liabilities, and shareholders' equity. In contrast, a profit and loss (P&L) statement, or an income statement, summarizes the revenue and expenses for a given period.
How do I find a company's balance sheet?
The balance sheet can be found in annual reports, on the company's website, or in a public filing with the SEC. Additionally, investors can find consolidated balance sheets from stock market data providers such as Stock Rover.
How do you quickly analyze a balance sheet?
To analyze a balance sheet, you should understand a company's liquidity position, which is done by looking at current assets and liabilities. Additionally, analyze the debt-to-equity ratio, which will help them gauge how much leverage a company has. Finally, analyzing trends in revenue and expenses over time can provide insight into a company's financial health.
How do you know if a balance sheet is strong?
A strong company balance sheet has minimal liabilities, a favorable current ratio, and low debt-to-equity ratio. It generates sufficient cash flow, has high margins, and can reinvest in growth or distribute profits to shareholders.
What is the most important thing on a balance sheet?
The most important thing on a balance sheet is the company's ability to meet its short-term obligations, which is determined by its liquidity position. Liquidity refers to how much money a company has in cash or assets that can be quickly converted into cash.
What makes a bad or weak balance sheet?
A weak balance sheet has a high ratio of liabilities to assets, high debt-to-equity ratios, and low liquidity. It may also have negative equity on the balance sheet or an inability to generate sufficient cash flow to meet its obligations. A company with a bad balance sheet may be unable to pay its debts or other obligations as they come due.
What is a healthy asset ratio?
A healthy asset ratio is generally a higher asset ratio. This indicates better financial health because the company has more assets than liabilities to cover its obligations. A good asset ratio should be one or higher.
How do you measure equity on a balance sheet?
Equity on a balance sheet is measured by subtracting total liabilities from total assets. This will give you the company's net worth, also called shareholders' equity. A positive number indicates that the company has more assets than liabilities, while a negative number indicates that the company has more liabilities than assets.
What is liquidity?
Liquidity measures how quickly and easily an asset can be converted into cash. For example, stocks are highly liquid because they can be sold anytime. On the other hand, real estate is considered less liquid since it involves more time and effort to sell.
What does a healthy balance sheet look like?
A healthy balance sheet typically has a favorable asset-to-liability ratio, low debt-to-equity ratios, and sufficient liquidity to meet its obligations. Equity on the balance sheet should be positive, with cash flow generating enough profits to cover liabilities and expenses.
What is the best software for analyzing balance sheets?
The best software for analyzing company financials, including balance sheets, is Stock Rover. It provides comprehensive, real-time research reports that analyze balance sheets, income statements, and cash flow. It also offers portfolio tracking, watchlists, and automated alerts.
Final Thoughts
Balance sheets are a valuable tool for evaluating the financial health of companies and making informed investment decisions. They provide investors insight into a company’s short-term and long-term obligations, assets, equity, and other key components.
By understanding how these components relate, investors can understand the company’s overall performance. Moreover, investors can identify potential opportunities and risks by comparing these components to industry averages and other companies in the same sector.
Video Explainer: Financial Analysis
You want to be a successful stock investor but don't know where to start.
Learning stock market investing on your own can be overwhelming. There's so much information out there, and it's hard to know what's true and what's not.

Liberated Stock Trader Pro Investing Course
Our pro investing classes are the perfect way to learn stock investing. You will learn everything you need to know about financial analysis, charts, stock screening, and portfolio building so you can start building wealth today.
★ 16 Hours of Video Lessons + eBook ★
★ Complete Financial Analysis Lessons ★
★ 6 Proven Investing Strategies ★
★ Professional Grade Stock Chart Analysis Classes ★