My detailed research shows that Heikin-Ashi charts are better than candlesticks for maximizing returns in trading strategies.
I backtested 360 years of data on the 30 most important US stocks, and our findings prove that Heikin-Ashi chart strategies outperform 66% of equities vs. a buy-and-hold strategy.
This article highlights Heikin-Ashi candles, their formula, and trading strategies. Find out how they are improving trading outcomes.
Key Learnings
- Heikin-Ashi candles filter out much of the volatility seen with traditional Japanese Candlesticks.
- They are highly reliable for trading.
- Heikin-Ashi candles outperformed Japanese Candlesticks in our in-depth strategy testing.
- Breakout patterns can be easily identified using this chart type.
- Candlestick pattern trading, or traditional chart patterns, cannot be used with Heikin-Ashi.
What is a Heikin-Ashi Chart?
Heikin-Ashi combines candlestick charting and price averaging to create a better visual representation of trends. Heikin-Ashi smoothes out daily volatility to reveal actionable price trends and is a superior chart for trading strategy development.
Heikin-Ashi Candles are a relatively new way of trading stocks and other financial assets. Although they have existed since the 1600s, they only recently gained popularity due to their ability to provide traders with more accurate data.
Heikin-Ashi charts can identify support and resistance levels, identify trading signals, and determine potential entry and exit points. Heikin-Ashi candles can also measure momentum, volatility, and volume, providing a comprehensive picture of the market’s behavior.
What Does Heikin-Ashi Mean?
Heikin-Ashi, or Heiken Ashi, means ‘average bar’ in Japanese. It is a form of candlestick charting that is extremely helpful for identifying trends. Unlike traditional candlesticks, Heikin-Ashi charting creates each candle by averaging the open, close, high, and low prices. This helps eliminate false signals by smoothing out price noise, extreme highs and lows, and making it easier to spot trends.
The Benefits
Heikin-Ashi is an incredibly effective tool for spotting trends, reducing noise, and providing traders with a clear market view. Using an average of the open, close, high, and low prices to create each candle, the chart eliminates the short-term randomness of traditional candlesticks. It provides a more accurate representation of market sentiment. This can help traders improve when to enter and exit positions based on the underlying market trend.
What are Heikin-Ashi Candles?
Heikin-Ashi candles are a visual representation of price movement. Unlike traditional candlestick charts, these candles are designed to filter out the noise and highlight important trends. The size and color of Heikin-Ashi candles can give traders important information about momentum, trend direction, and potential reversals.
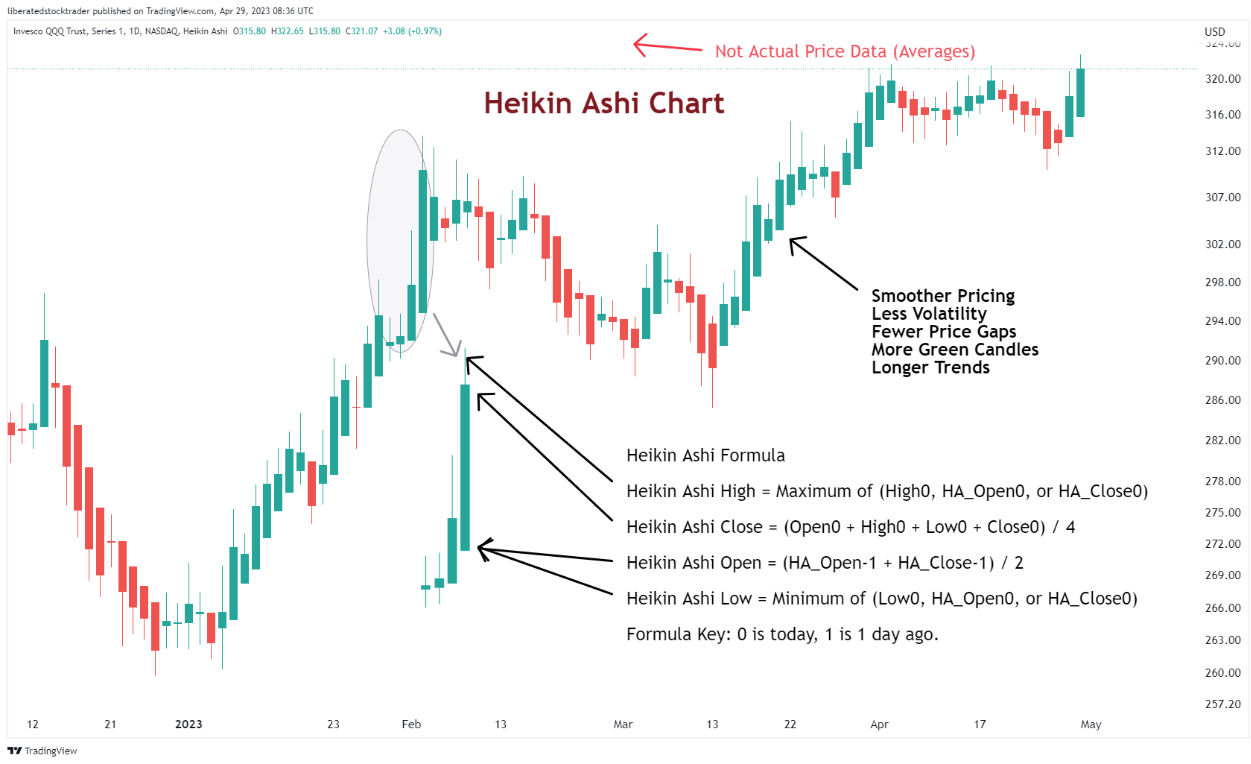
Example: Understanding Heikin-Ashi Charts
Heikin-Ashi charts are radically different from Japanese Candlestick charts because, on a daily chart, the opening, high, low, and close prices are averages of today and yesterday. It might not seem special, but my testing reveals it is revolutionary.
The image below shows the Heikin-Ashi formula and how it manifests on a chart.
Get Free Heikin-Ashi Charts on TradingView
How to Read Heikin-Ashi Candles
Heikin-Ashi candles have four components: close, open, high, and low. The open price is the most recent opening price of the period, the close is the most recent closing price of the period, and the high and low refer to the maximum and minimum prices reached during that period.
Depending on whether or not the closing price was higher than the opening price, Heikin-Ashi candles will appear either green or red. A green candle means prices rose from open to close, while a red candle indicates that prices fell from open to close.
Due to their smoothing effect, traders can quickly identify trends in both directions using Heikin-Ashi candles. While traditional candlestick charts show sudden sharp movements due to volatility, Heikin-Ashi charts filter out much of this choppiness and instead focus on identifying true market trends. This allows traders to spot potential trading opportunities more easily and make decisions based on solid data.
Heikin-Ashi candles provide traders with valuable insights into the market’s behavior, allowing them to make informed trade decisions. They can identify support and resistance levels, measure momentum, recognize volatility, and detect potential reversals.
TrendSpider 4.8/5⭐: My Pick for AI-Power & Auto-Trading
I’ve used TrendSpider for 7 years for my research and testing. It auto-detects trendlines, patterns, and candlesticks, backtests ideas, and lets you use AI to create unique strategies and launch trading bots—with no code.

Save 38% to 45% on TrendSpider
Our Top Rated 4.72 ⭐ Trading Tool
✅ Leader in AI Trading & Chart Pattern Recognition
✅ Scanning & Auto-Trading
Deal Ends In:
What is the formula for Heikin-Ashi?
The formula used to construct a Heikin-Ashi candle is as follows:
Heikin-Ashi Close = (Open0 + High0 + Low0 + Close0) / 4
Heikin-Ashi Open = (HA_Open-1 + HA_Close-1) / 2
Heikin-Ashi High = Maximum of (High0, HA_Open0, or HA_Close0)
Heikin-Ashi Low = Minimum of (Low0, HA_Open0, or HA_Close0)
Formula Key: 0 is today, 1 is 1 day ago.
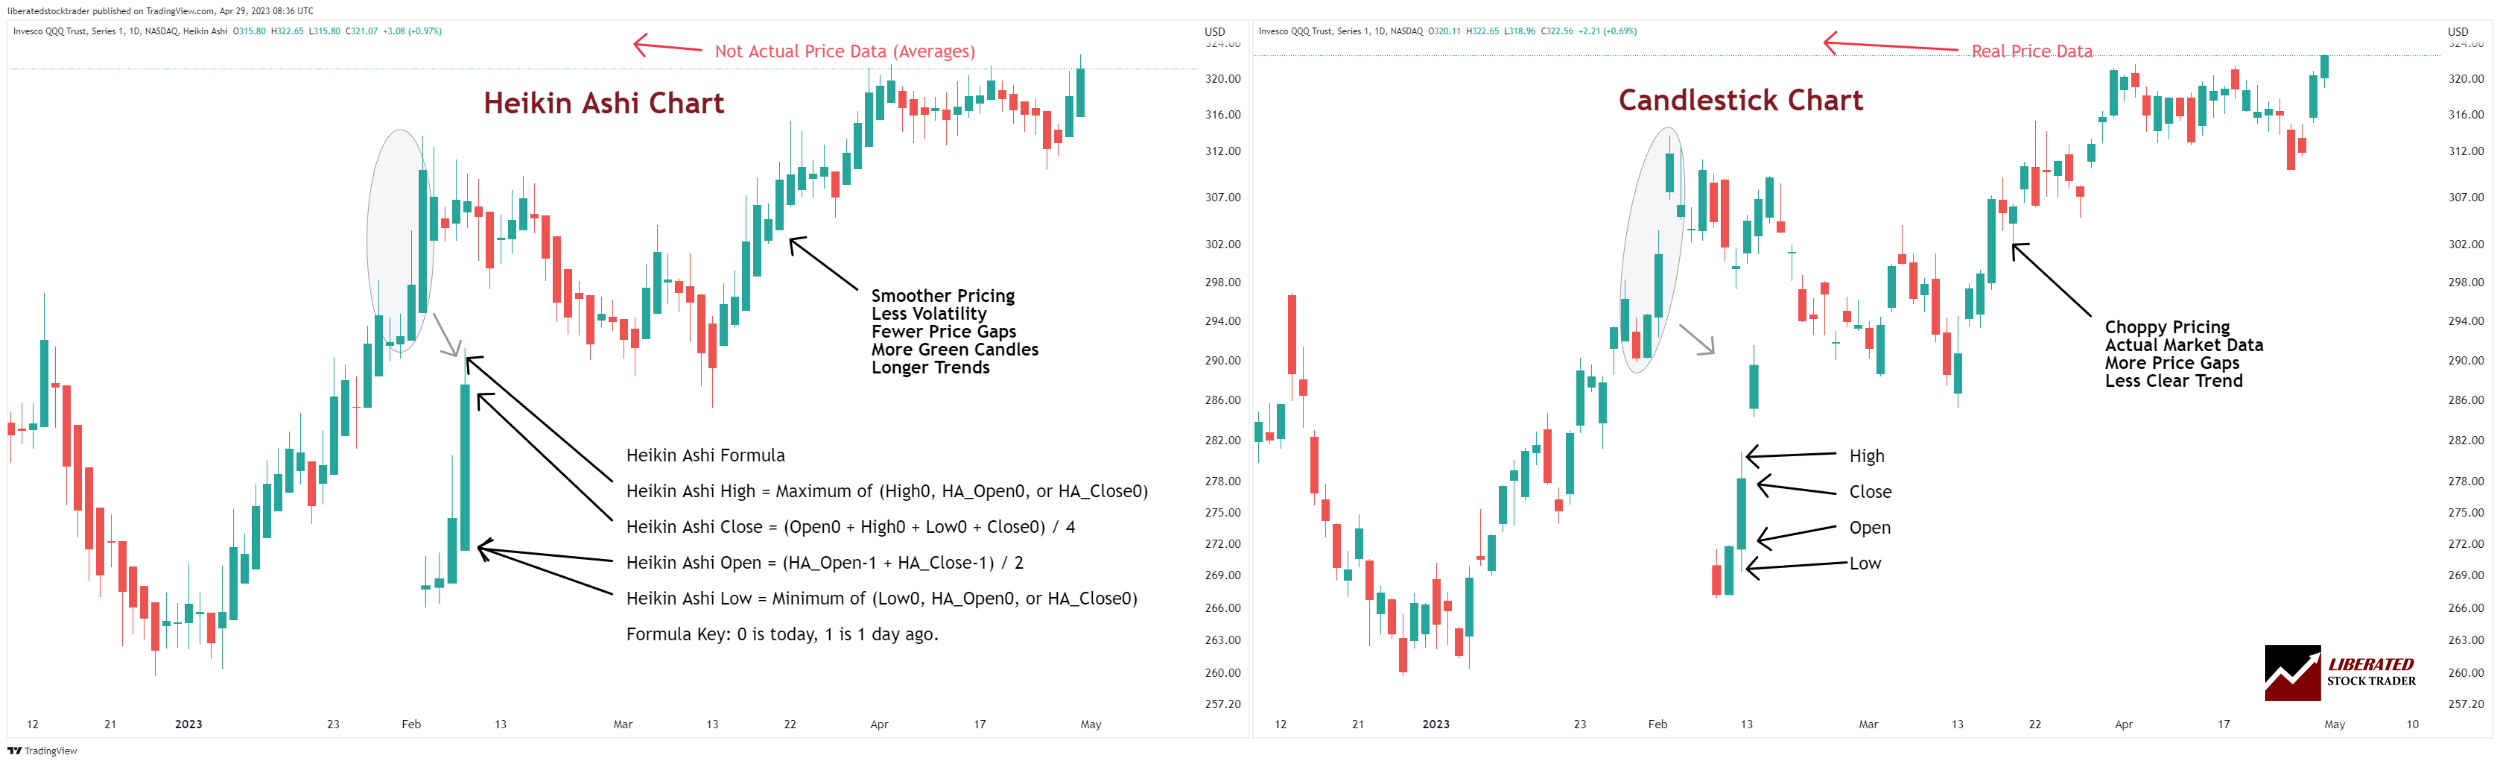
Heikin-Ashi Candles vs. Candlestick Charts.
The key difference between Heikin-Ashi and candlestick charts is that Heikin-Ashi performs 50% better in backtesting and trading strategies. This is down to the smoothing effect of the two days of price averaging. The evidence shows that 20 years of backtesting on the 30 Dow Jones Industrial Average stocks, using a Heikin-Ashi chart, improved performance significantly.
Comparison Charts: Heikin-Ashi vs. Candlesticks
Heikin-Ashi Charts on TradingView
How Heikin-Ashi Differs from Candlesticks
Heikin-Ashi candles are different from Japanese candlesticks because they use a formula to smooth out the price data, making it easier to identify trends. Japanese candlesticks show sudden sharp movements due to volatility, while Heikin-Ashi charts filter out much of this choppiness and instead focus on finding true trends in the market.
| Heikin-Ashi Candles | Japanese Candlesticks |
| Smoother Average Price Bars | Actual Price Bars |
| Less Volatility | Actual Volatility |
| Fewer Price Gaps | Actual Price Gaps (Good for Gap Trading) |
| Clearly Defined Trends | Unclear Trends |
| Better for Strategy Development | Provides Many False Trading Signals |
Japanese candlestick charts are the traditional form of charting used to identify trends in the market. These candles are constructed using open, high, low, and close prices for a given period. The size and color of these candles can provide traders with valuable information about the direction of an underlying trend. Heikin-Ashi charts are an updated form of Japanese candlesticks that smooth out noise and highlight important trends in the market. The size and color of Heikin-Ashi candles can inform traders about momentum, trend direction, and potential reversals.
How Heikin-Ashi Charts Change the Wicks on Candles
The Keikin Ashi chart changes the wicks on candles in two ways. First, it reduces the noise by eliminating some wicks that show up on traditional Japanese candlesticks. This makes it easier to spot trends and reversals without being distracted by minor price fluctuations. Second, it also makes identifying support and resistance levels easier, as the wicks will be more consistent. This allows traders to identify key points of entry or exit more easily.
Is Heikin-Ashi Better Than Candlesticks?
Yes, our rigorous testing shows that Heikin-Ashi has higher success rates than candlesticks, providing fewer false signals, lower volatility, and more profitable reward-to-risk ratios.
In the next section, I will show you how to set up a Heikin-Ashi backtest so you can compare the results against traditional candles or line charts for yourself.
Backtesting Heikin-Ashi vs. Candlesticks
Using our award-winning TrendSpider software, we can easily test any indicator, chart pattern, or chart performance on any US stock. Trendspider offers the most powerful trading strategy development and testing service.
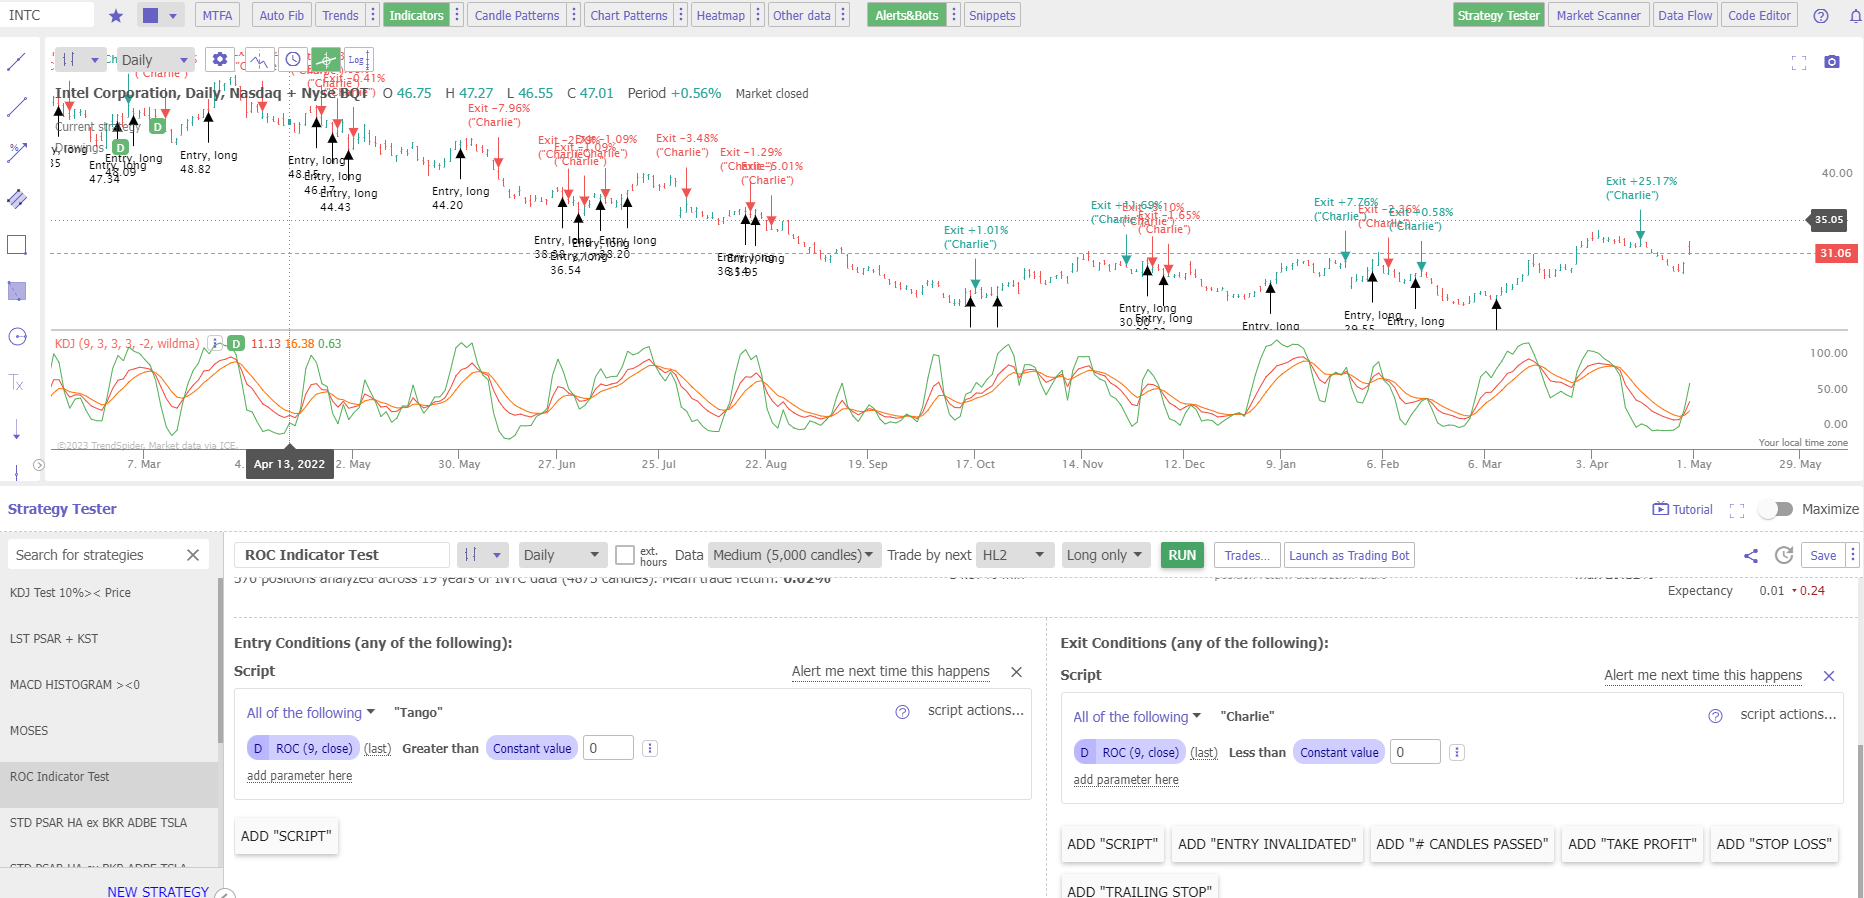
7 Steps to Set Up a Backtesting Strategy in TrendSpider:
- Visit TrendSpider and sign up for a free trial.
- Select a Ticker – e.g., INTC Intel.
- Click Strategy Tester.
- Click Add Parameter Here > Condition > Indicator > Rate of Change > Greater Than > 0.
- In the Right Hand Box, Select Add Script > Add Parameter Here > Condition > Indicator > Rate of Change > Less Than > 0.
- Select Heikin-Ashi Chart and Data = 3000 Candles.
- Select RUN to launch the backtest.
A 19-Year Candlestick Chart Rate of Change Strategy
Our testing of Intel Corp (INTC) over 19 years shows a standard rate of change strategy returned a loss of -28% versus the buy-and-hold return of 5.35%. The results are typical of testing across the DJ-30 index.
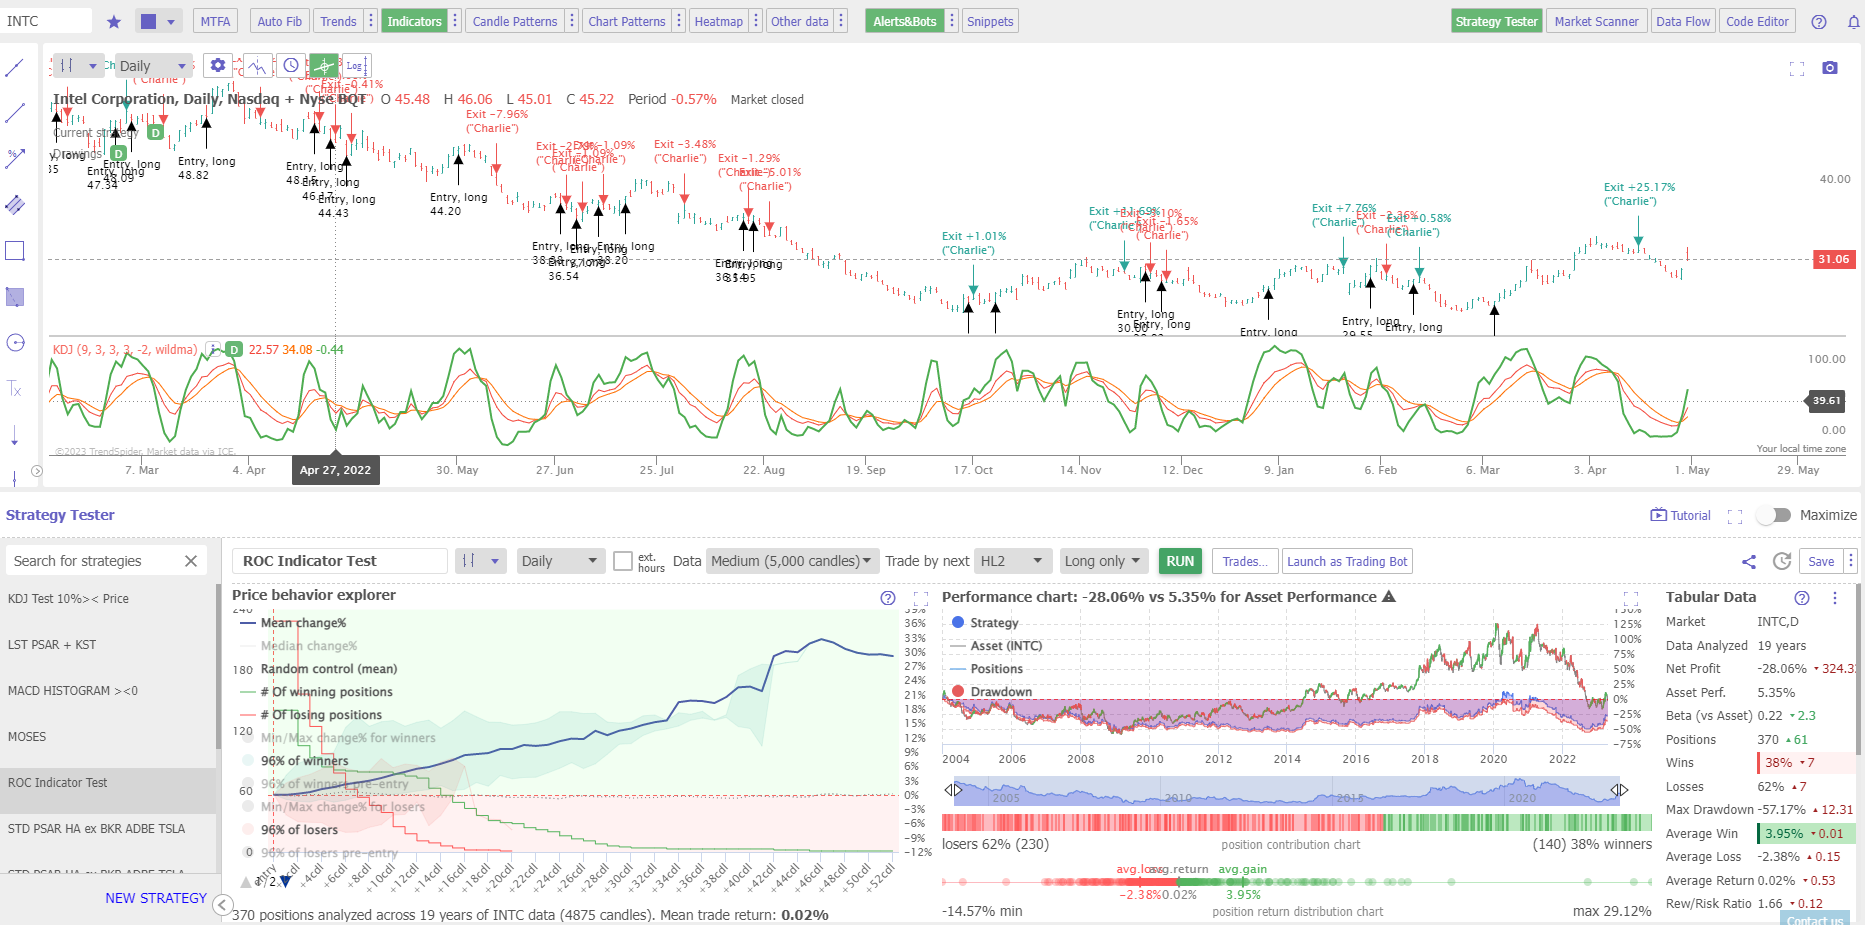
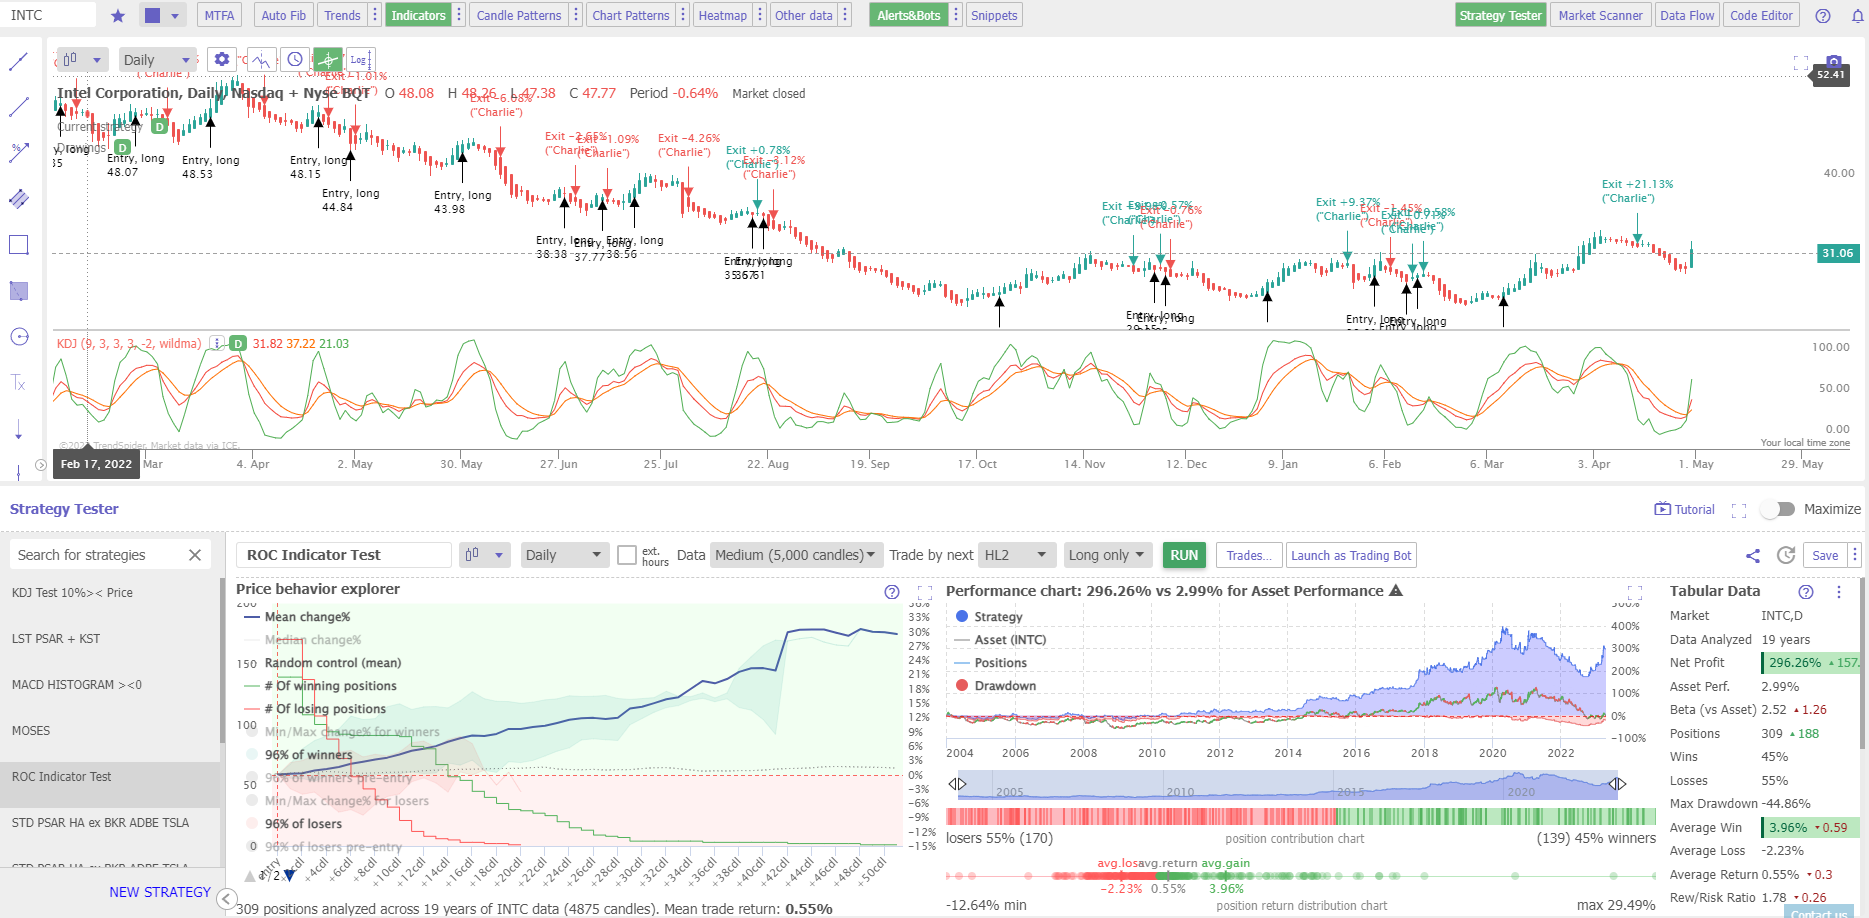
A 19-Year Heikin-Ashi Chart Rate of Change Strategy
Our testing of Intel Corp (INTC) over 19 years shows a standard rate of change strategy returned a profit of +296% versus the buy and hold return of 2.99%. This is a vastly superior return versus the market, and this difference is down to the smoothing effect of Hekin Ashi Candles.
Backtest Powerful Strategies on TrendSpider Now
Heikin-Ashi Testing Results
Using the standard Rate of Change indicator for trading signals, our testing shows that Heikin Ash Candles beat buy-and-hold strategies with a 66% success rate versus 10% for standard OHLC bars and candlesticks.
| 12 Year Backtest Results | Heikin-Ashi | OHLC Bars |
| Stocks Tested | 30 | 30 |
| Duration (Years) | 12 | 12 |
| # Stocks Beating Buy & Hold | 20 | 3 |
| % Stocks Beating Buy & Hold | 66% | 10% |
This table compares the results of trades in IBM stock. With Heikin-Ashi, we got a profit of 77% over 12 years, compared to the buy-and-hold result of a -22% loss. Using the same ROC strategy on IBM, we see a 14% loss. So, in this case, Heikin-Ashi produced an incredible +91% difference in trading strategy performance.
| 12 Year Backtest Results | Heikin-Ashi | OHLC |
| Ticker: | IBM | IBM |
| Reward/Risk Ratio: | 2.29 | 1.32 |
| Buy & Hold Performance: | -22% | -22% |
| Heikin-Ashi ROC Performance: | +77% | -14% |
| # Trades: | 181 | 223 |
| Average Win: | 3.08% | 2.27% |
| Average Loss: | -1.34% | 1.72% |
Best Heikin-Ashi Indicators
Our testing has shown the best indicators to use with Heikin-Ashi candles are Rate of Change (ROC), Parabolic SAR, and Moving Average Convergence/Divergence (MACD). We will continue to test more chart indicators in the future, but these are the results so far.
Moving averages and Bollinger Bands can also be used with Heikin-Ashi charts to identify underlying trends. By combining Heikin-Ashi candles with these additional indicators, traders can reduce risk and make more informed decisions.
Heikin-Ashi vs. Candlesticks Video
Get Free Heikin-Ashi Charts on TradingView
How To Trade a Heikin-Ashi Strategy
When trading a Heikin-Ashi strategy, traders should look for green candles that have been preceded by red candles and vice versa. Green Heikin Ashi candles indicate an uptrend, while red ones signal a downtrend. The longer the candle, the more powerful the trend. Make sure to backtest the strategy to ensure it has worked robustly in the past before risking any capital.
Another unique and innovative chart type to consider is Raindrop charts by TrendSpider.
FAQ
What is the best charting software for Heikin Ashi?
The best charting software for trading, backtesting, and researching Heikin-Ashi is TrendSpider because they offer a fully integrated strategy tester. For free-to-use Heikin-Ashi charts, TradingView is the best platform.
Is Heikin-Ashi reliable?
Yes, Heikin-Ashi is a reliable charting technique that can help traders easily identify potential entry and exit points. We have proven Heikin Ashi strategies often produce fewer false signals, resulting in improved reward-to-risk ratios.
Is Heikin-Ashi good for day trading?
Yes, Heikin-Ashi is good for day trading. Our 3-year hourly chart test of IBM shows a Heikin Ashi Rate of Change strategy produced a profit of 372% versus a buy-and-hold profit of 17.33%. On a 5-minute chart, the result was 33.52% versus a buy-and-hold return of -2.58%.
Is Heikin-Ashi better than Candlesticks?
Yes, our testing shows Heikin-Ashi is better than candlesticks when used with chart indicators for trading strategies. However, candlesticks are better than Heikin-Ashi for gap trading or candlestick pattern trading techniques.
Do professional traders use Heikin-Ashi?
More and more professional traders are adopting Heikin-Ashi because it produces more reliable trends for investing strategies. Major stock software developers like TrendSpider and TradingView have now incorporated Heikin-Ashi into their products.
Why not to use Heikin-Ashi?
Heikin-Ashi is not recommended for sub-5-minute charts for day traders. It smooths out the sharp price movements, and this makes it difficult to detect short-term trends. We recommend limiting Heikin Ashi to longer time frames, such as hourly, daily, and weekly charts so you can get a better idea of the overall market direction.
What is the best Heiken-Ashi strategy?
Our testing shows that a Rate of Change strategy with Hekin-Ashi candles is a good candidate for the best Heikin Ashi trading strategy, producing vastly superior returns versus traditional OHLC bars or Japanese candlesticks.
How profitable is Heiken-Ashi?
According to our testing, the profitability of Heikin-Ashi is typically a 2:1 up to 3:1 reward-to-risk ratio. However, profitability also depends on the asset traded and the overall market direction and volatility.
What is the disadvantage of Heikin-Ashi candles?
The main disadvantage of Heikin-Ashi candles is they cannot be used for identifying proven chart patterns like head and shoulders or triangles. Additionally, you cannot trade gaps in price patterns or Japanese Candlesticks with Heikin-Ashi.
What is the best software for backtesting Heikin-Ashi candles?
Our detailed testing of Heikin-Ashi candles has been performed with TrendSpider, which I believe is the best trading software for backtesting and trading strategy development.
What is the best timeframe for Heiken-Ashi?
Our testing shows best timeframes for Heikin-Ashi are daily, as the reward-to-risk ratios per trade are typically higher. Trading Apple Inc on a daily chart yields a 3.23 ratio versus a 1-hour risk-reward ratio of 2.63.
Is Heikin-Ashi good for swing trading?
Yes, Heikin-Ashi is good for swing trading on hourly chart timeframes, according to our data. However, it would be best to use a standard candlestick chart for timing exact exit trades because the price information is more accurate.
Is Heikin-Ashi leading or lagging?
Heikin-Ashi is a lagging indicator because it averages the candle prices from the most recent bar and the previous bar. As a result, it's better used to identify trends and patterns than as a timing indicator. That said, you can use Heikin-Ashi with other indicators, such as MACD or RSI, to get more precise entries and exits.
Do candlestick patterns work on Heikin-Ashi?
No, candlestick patterns do not work on Heikin-Ashi; this is the major disadvantage of this chart type. If you want to trade candlestick patterns, use a Japanese Candlestick chart instead.
Is Renko better than Heikin-Ashi?
I have seen no evidence that Renko charts are better than Heikin Ashi. However, our backtesting research shows Heikin Ashi produces better results than candlesticks and OHLC bars.
Nice observation Michael, thanks
Heiken Ashi (HA) candles are great for trend-following strategies as they reduce the gyrations of volatile moves of individual regular candlesticks. They will usually get the meat on the bone of a swing trade but typically will be late by 1-2 regular candlesticks on both entries and exits. So I use regular candlesticks for swing trade entries and often switch to HA candlesticks to follow the trend until exiting after seeing an exit signal with regular candlesticks. Combining a moving average (e.g., 20SMA) and MACD also assist in confirming trend and oversold/overbought, respectively.