The five popular moving averages for traders are the simple moving average (SMA), the exponential moving average (EMA), the weighted moving average (WMA), the exponential weighted moving average (EWMA), and the Hull moving average (HMA).
I tested 43,770 trades to determine which ones are the best performers. The best moving average settings are SMA or EMA 20 on a daily chart, which achieves a 23% win rate. At settings 50, 100, and 200, it is better to use the Hull moving average, which has win rates of 27%, 10%, and 17%, respectively.
Interpreting moving averages is a crucial skill for any trader seeking to enhance their performance. Read on to learn how to calculate and trade each moving average with practical examples and their pros and cons. You can jump directly to the test results if you already understand moving averages.
What is a Moving Average?
A moving average is a technical analysis chart indicator that shows the average value of a security over a set period. It is plotted as a trendline indicator that smooths prices by averaging them. Moving averages often help identify support and resistance levels and potential entry and exit points.
What Does a Moving Average Indicate?
Moving averages are useful technical indicators for traders to identify potential buy or sell opportunities. They can confirm trends, identify crossovers, and measure volatility. By understanding how moving averages work and the different types available, traders can more effectively use this indicator in their trading strategies.
Looking beyond individual stocks, traders may also use moving averages to identify the direction of an index or entire market. By recognizing when the markets are trending, traders can adjust their trading strategies more accurately to reflect current conditions.
Chart: 5 Moving Averages Compared
In this chart, we compare the five important moving averages: simple (SMA), exponential (EMA), weighted (WMA), exponential weighted (EWMA), and Hull (HMA). Notice how responsive the Hull moving average is.
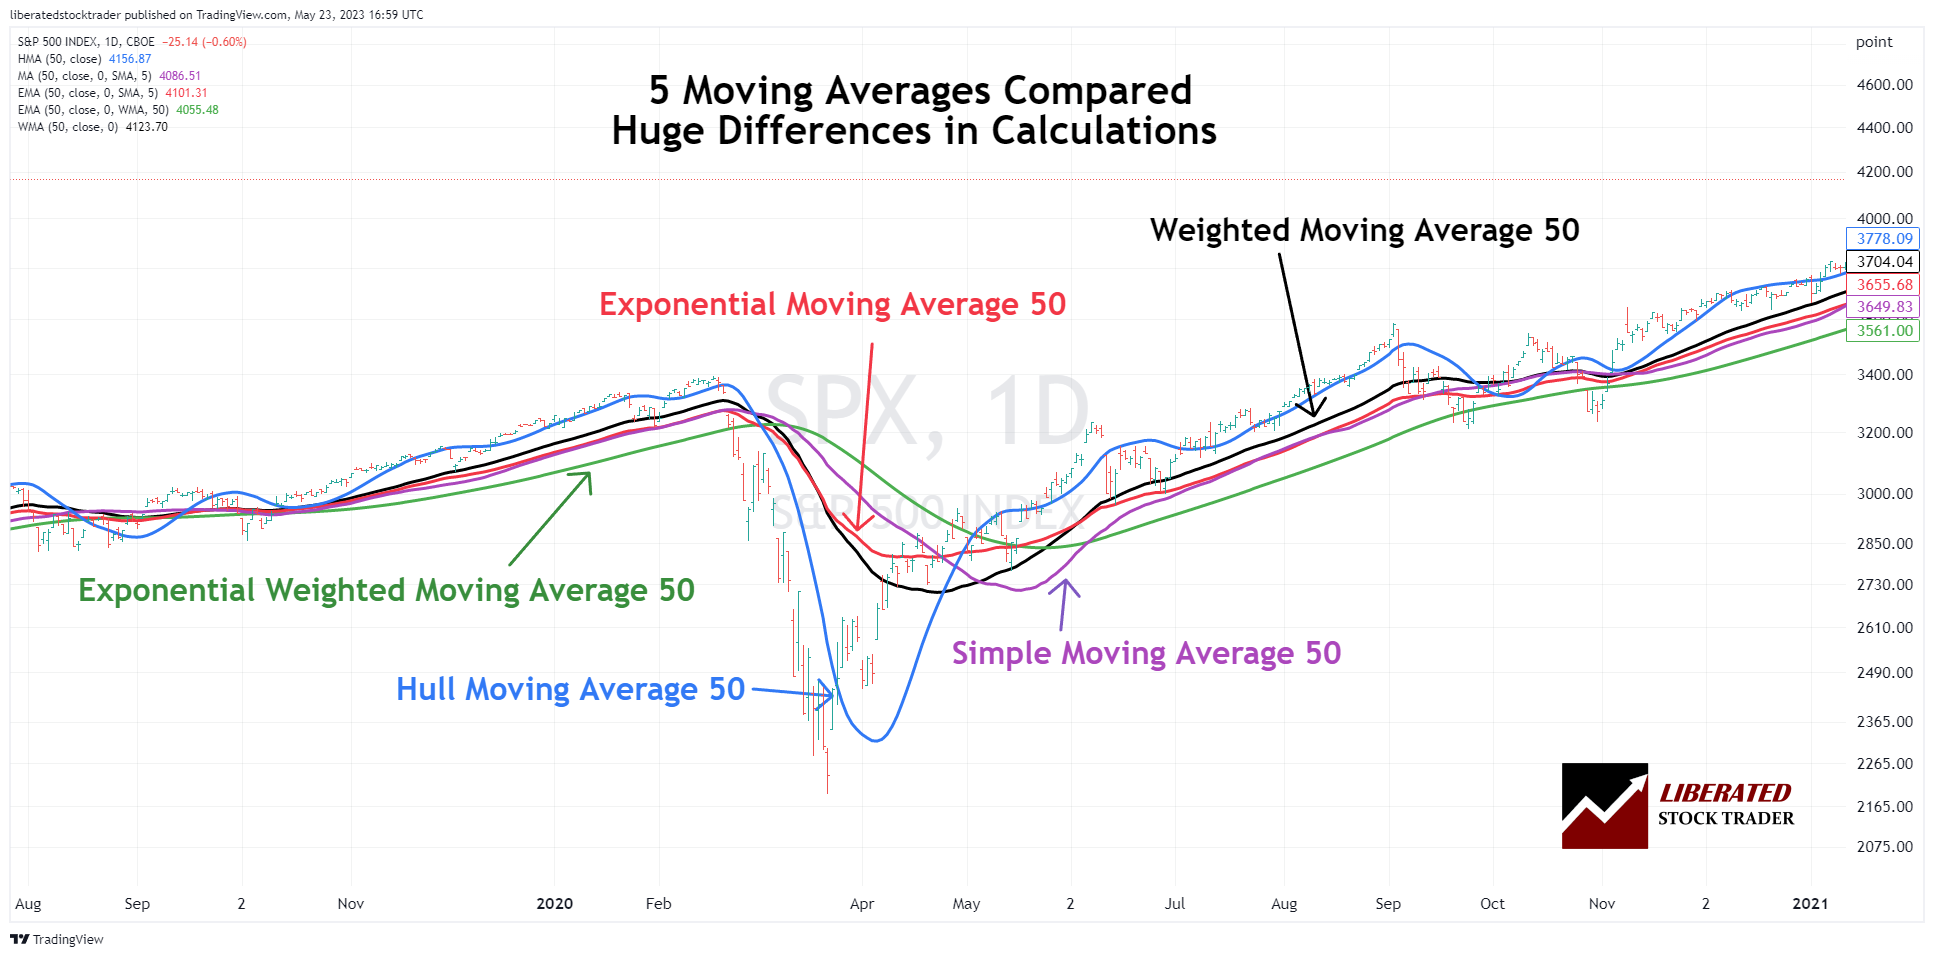
Chart by TradingView: Try it Free
Examples of Moving Averages
The three most popular moving averages are the simple moving average (SMA), exponential moving average (EMA), and weighted moving average (WMA).
• Simple Moving Average (SMA) – A simple moving average uses the closing price of a security over a specific period. For example, a 20-day SMA would show the average closing price of the past 20 days.
• Exponential Moving Average (EMA) – An exponential moving average multiplies the weight of more recent price data, allowing for a smoother average than the SMA.
• Weighted Moving Average (WMA) – A weighted moving average assigns different weights to each closing price to give more importance to recent prices.
Moving averages can provide traders with support, resistance levels, and entry and exit points for trades. Traders should use the crossover technique to identify trends – when a shorter-term moving average crosses above/below a longer-term moving average, it can signal an up/down trend in price. Additionally, traders should monitor the divergence between the underlying security and the moving averages, which could indicate a trend reversal.
Moving average analysis can give traders valuable insights into price and volume dynamics for their chosen securities when used correctly.
Pros
Moving averages are one of the most commonly used technical indicators for traders. They are easy to interpret and provide a simple graphical representation of price direction over time that can be used with other strategies. By understanding how moving averages work, traders can improve their trading performance and increase their profits.
Cons
Although moving averages can be useful tools for traders, some drawbacks exist. For instance, they may lag behind the price action as they are always based on past prices. This means that traders may miss potential opportunities or enter and exit trades at the wrong times. Additionally, false signals may occur when the security is in a range-bound market, and the moving average lines are flat. In these cases, traders may get whipsawed and incur significant losses. Lastly, traders should know that they often must sacrifice accuracy for speed when trading with moving averages. Using other indicators and strategies in conjunction with moving averages is important to make more informed decisions.
TrendSpider 4.8/5⭐: My Pick for AI-Power & Auto-Trading
I’ve used TrendSpider for 7 years for my research and testing. It auto-detects trendlines, patterns, and candlesticks, backtests ideas, and lets you use AI to create unique strategies and launch trading bots—with no code.

Save 38% to 45% on TrendSpider
Our Top Rated 4.72 ⭐ Trading Tool
✅ Leader in AI Trading & Chart Pattern Recognition
✅ Scanning & Auto-Trading
Deal Ends In:
How I Tested Moving Average Reliability
This research was performed using TrendSpider, the best backtesting software. To try it yourself, follow these steps:
- Register for free with TrendSpider.
- Select Strategy Tester > Entry Condition > Add Script > Add Parameter > Condition > Price > Greater Than > [Moving Average].
- For the Sell Criteria, select > Add Script > Add Parameter > Condition > Price > Less Than > [Moving Average].
- Finally, click “RUN.”
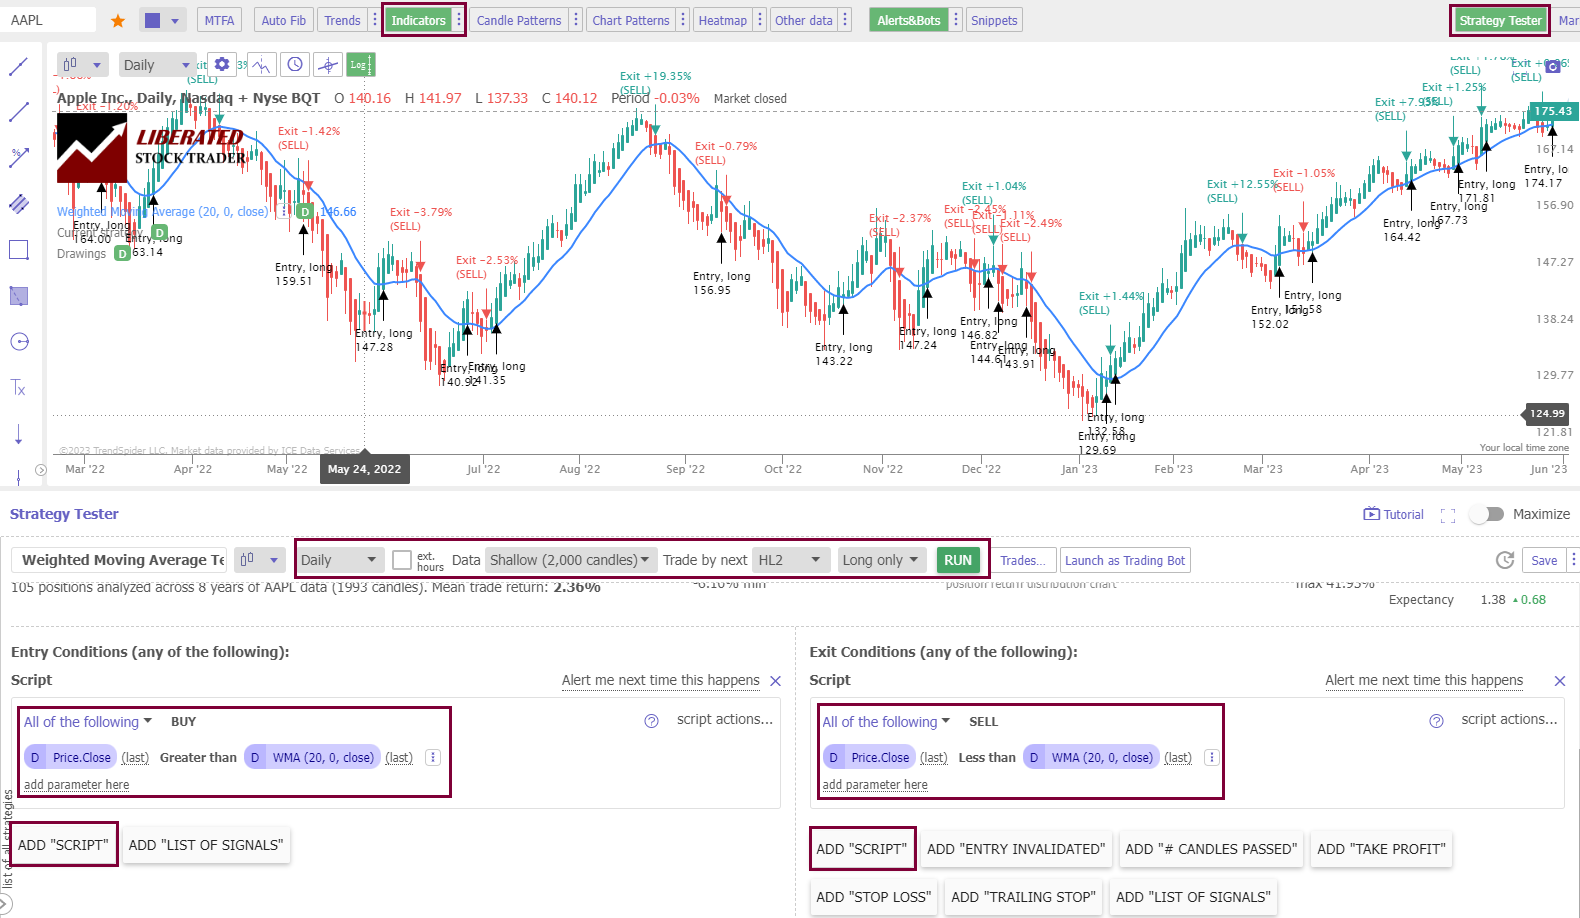
The screenshot below shows the exact backtest configuration for our weighted moving average testing.
Moving Average Test Results & Success Rates
I set up a daily chart covering eight years to test our moving averages. I configured TrendSpider’s backtesting engine to buy when the price was above the moving average and sell when it was below. I then tested each stock in the Dow Jones 30. Each moving average was tested with four configurations. 20, 50, 100, 200. The table below shows the performance of four moving averages: Simple, Exponential, Weighted, and Hull.
Moving Averages Performance
- The Simple Moving Average (SMA20) had a 23% win rate based on 4,800 trades tested.
- The Hull Moving Average (HMA50) had the best performance, with a 27% win rate across 5,160 trades.
- The Exponential Moving Average (EMA20) had a 23% win rate with 5,160 trades tested, but a 0% win rate at 100 and 200 settings.
- Finally, the Weighted Moving Average (WMA20) had a 7% win rate with 5,160 trades tested, but a 10% win rate at settings 100 and 200.
| Simple Moving Average | % Winners | # Trades Tested | Avg # Trades |
| 20 | 23% | 4,800 | 160 |
| 50 | 7% | 2,190 | 73 |
| 100 | 10% | 1,560 | 52 |
| 200 | 7% | 690 | 23 |
| Exponential Moving Average | % Winners | # Trades Tested | Avg # Trades |
| 20 | 23% | 5,160 | 172 |
| 50 | 3% | 1,830 | 61 |
| 100 | 0% | 1,530 | 51 |
| 200 | 0% | 960 | 32 |
| Weighted Moving Average | % Winners | # Trades Tested | Avg # Trades |
| 20 | 7% | 5,160 | 172 |
| 50 | 3% | 3,660 | 122 |
| 100 | 10% | 2,250 | 75 |
| 200 | 7% | 1,050 | 35 |
| Hull Moving Average | % Winners | # Trades Tested | Avg # Trades |
| 20 | 13% | 5,160 | 172 |
| 50 | 27% | 3,450 | 115 |
| 100 | 10% | 3,270 | 109 |
| 200 | 17% | 1,050 | 35 |
| Totals | 10% | 43,770 |
In conclusion, the Hull Moving Average had the highest win rate across all configurations.
What are the Best Moving Average Settings?
The best moving average settings are SMA or EMA 20 on a daily chart, which achieves a 23% win rate. At settings 50, 100, and 200, it is better to use the Hull moving average, which has win rates of 27%, 10%, and 17%, respectively.
How to Trade Moving Averages According to My Research
Moving averages must be used with other indicators. According to our testing, the success and reliability rates of moving averages are between 7% and 27%. That means, at best, 27% of stocks traded using a Hull moving average (HMA50) will outperform a buy-and-hold strategy.
Moving Average Timeframes
The time frame used to calculate a moving average varies depending on the type of security being analyzed. For example, longer time frames, such as 50-day or 200-day moving averages, are commonly used for stocks, while shorter time frames, such as 10-day and 20-day moving averages, are used for commodities.
When identifying support and resistance levels, traders often use short-term and long-term moving averages to better identify potential entry and exit points. For example, a trader may look at a 10-day moving average on an intraday chart and then compare it to a 50-day moving average on a daily chart. This analysis helps determine whether a security is trending or in a range.
Additionally, traders may use multiple moving averages to identify crossovers and confirm trends. For example, when the 10-day crosses above the 20-day moving average, it can indicate that a new uptrend is emerging. Conversely, when the 10-day crosses below the 20-day moving average, it can signal a new downtrend.
Finally, traders may also look at moving averages for clues about volatility. A security with a wide range of trading prices (high volatility) often shows greater fluctuations in its moving averages than a security with a narrow range (low volatility). By tracking the different levels of volatility, traders can get an idea of when to enter or exit positions.
5 Moving Averages Explained
The most popular moving averages are the simple moving average (SMA), exponential moving average (EMA), and weighted moving average (WMA). Each type of moving average has its benefits and drawbacks, so it is important to understand the differences before using them in trading. Knowing which type best fits your trading strategy can help you make better market decisions.
1. Simple moving average (SMA)
The simple moving average is the most common type of moving average; it averages out the closing prices of a security over a given period. The SMA smoothes out short-term price fluctuations, making it easier to spot longer-term trends.
Example Chart: Simple Moving Average
Get the Best Moving Average Indicators on TradingView
How to calculate a simple moving average
If we wanted to calculate a stock’s 5-day SMA, we would add up Apple’s closing prices over the previous five days and divide by five.
The formula for calculating a simple moving average is:
SMA = (Sum of Closing Prices / Number of Data Points)
Example:
To calculate the 5-day SMA for APPLE, we can create a table with the following information:
| Day | Price | 5-Day Moving Average |
| Day 1 | 170 | – |
| Day 2 | 172 | – |
| Day 3 | 175 | – |
| Day 4 | 174 | – |
| Day 5 | 181 | 174.4 |
| Day 6 | 186 | 177.6 |
| Day 7 | 187 | 180.6 |
| Day 8 | 189 | 183.4 |
| Day 9 | 175 | 183.6 |
| Day 10 | 170 | 181.4 |
How to trade using a simple moving average
Using the SMA in trading requires identifying when prices move above the SMA line; this generally indicates that the trend is up. When prices move below the SMA line, this suggests a downtrend. Traders can also use crossovers as entry or exit points. A crossover occurs when the two SMAs cross and indicate a change in trend direction. For example, a buy signal is generated when the short-term SMA crosses above the longer-term SMA. Similarly, a sell signal is generated when the shorter-term SMA crosses below the longer-term SMA.
2. Exponential moving average (EMA)
The exponential moving average is similar to the simple moving average, but it places more emphasis on recent data points than older ones. The EMA gives more weight to recent prices than the SMA, making it a better indicator of short-term trends. This is because the EMA reacts more quickly to changing price trends than the SMA.
Example Chart: Exponential Moving Average
Get the Best Moving Average Indicators on TradingView
How to calculate an exponential moving average
The formula for calculating an exponential moving average is:
EMA = (Closing price – EMA(previous day)) x multiplier + EMA(previous day)
Example: If we wanted to calculate the 5-day EMA, we would take the closing price on the latest trading day, subtract the 5-day EMA from the previous day, and then add the result to the 5-day EMA of the previous day. We would then multiply this sum by a multiplier based on the number of periods in our moving average (in this case, five). The resulting figure represents our current 5-day EMA.
The multiplier is calculated using the following formula:
2 / (number of periods + 1)
For example, in the case of a 5-day exponential moving average, the multiplier would be 2/6 = 0.33. Each day’s price will contribute one-third (0.33) of the overall EMA value.
Using this example, if Apple’s closing price on the current trading day is $200, and its 5-day EMA from yesterday was $150, we would calculate our 5-day EMA for today as follows:
($200 – $150) x 0.33 + $150 = $170
Therefore, today’s 5-day EMA is $170. We can use this figure to compare with Apple’s current trading price and determine whether the stock is overbought or oversold. If the 5-day EMA is higher than the current trading price, the stock is oversold and may be a good time to buy. Alternatively, if the 5-day EMA is lower than the current trading price, the stock is overbought and may be a good time to sell.
How to trade using exponential moving averages
Traders often use EMAs as entry and exit points. When prices move above the EMA, it indicates an uptrend; when prices move below the EMA, it suggests a downtrend. Crossovers are also used as signals for entry or exit points. A buy signal is generated when the shorter-term EMA crosses above the longer-term EMA, and a sell signal is generated when the shorter-term EMA crosses below the longer-term EMA.
3. Weighted moving average (WMA)
A weighted moving average (WMA) is a moving average that assigns different weights to each data point within the period. The most recent data points are given more weight than earlier ones, which reduces noise and increases the sensitivity of the average to short-term movements in price.
Example Chart: Weighted Moving Average
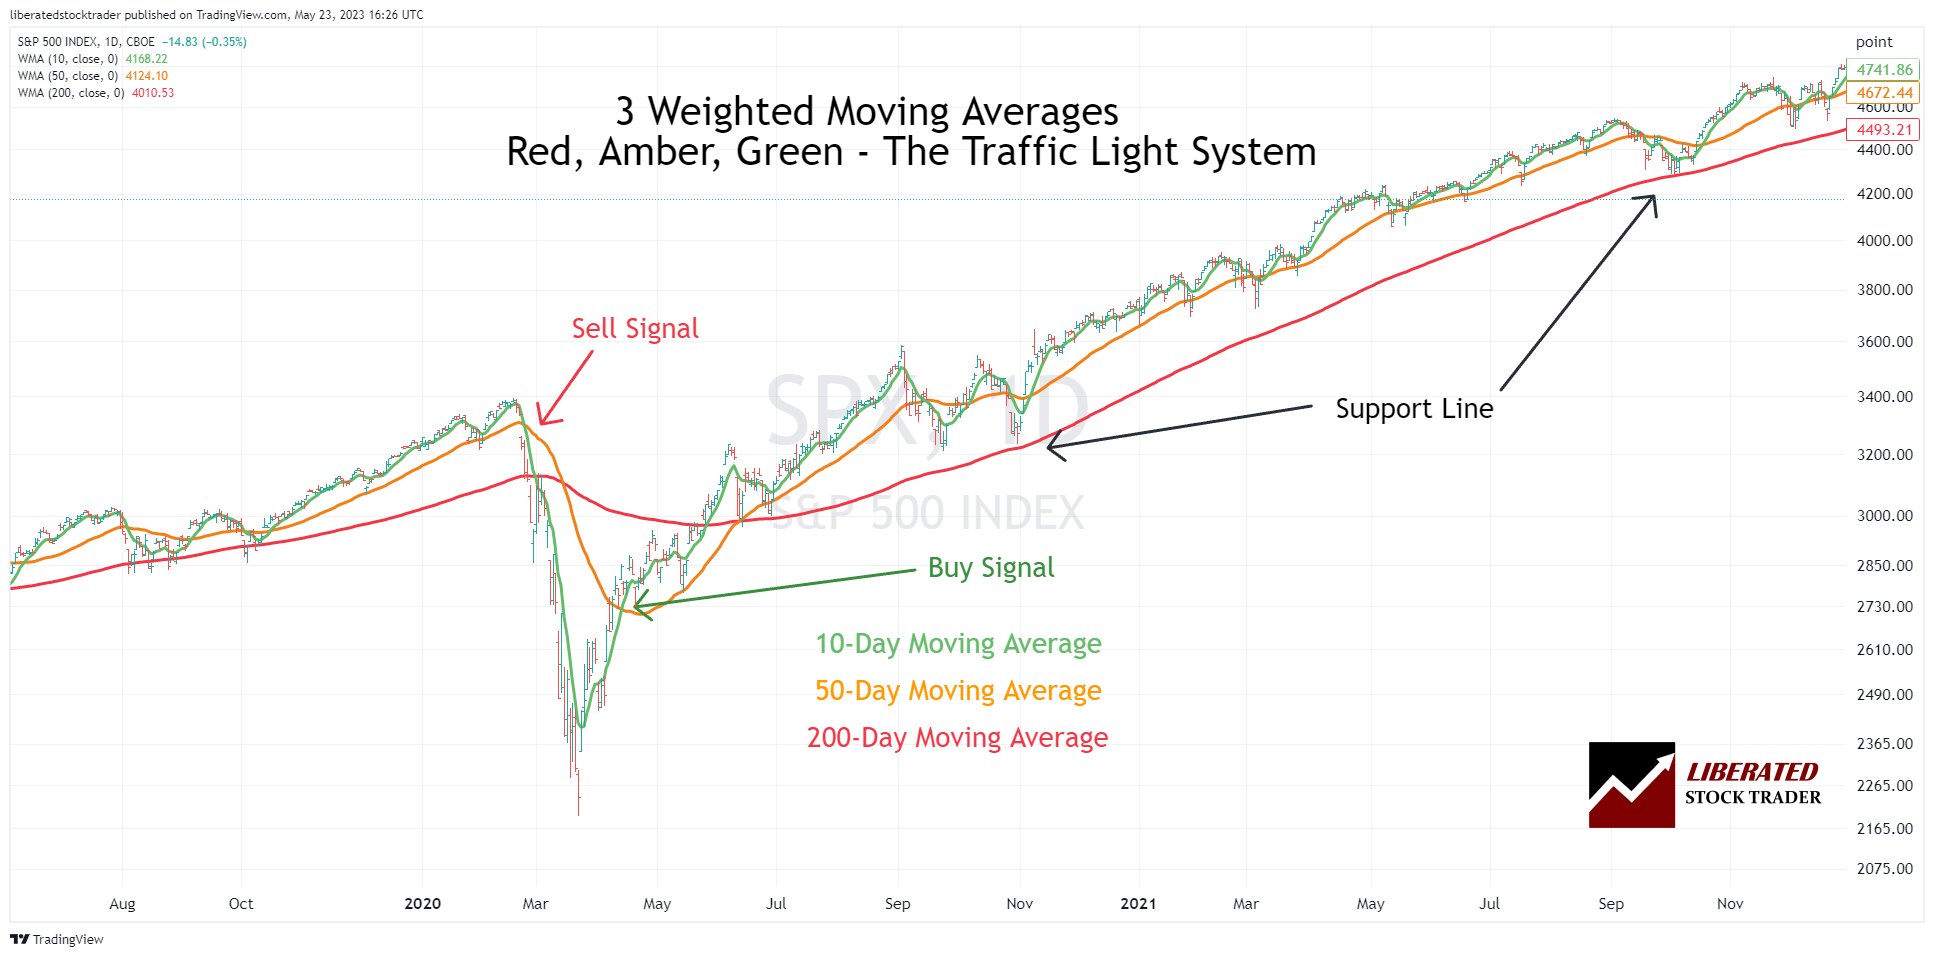
Chart Created with TradingView
How to calculate a weighted moving average?
To calculate a weighted moving average, the most recent price is multiplied by the weight assigned to it. This product is then added to the next most recent price, times its weight, and so on, until all prices within the specified period have been factored in. The sum of these products is then divided by the sum of all weights, yielding the average.
The weighted moving average formula.
The formula for a simple Weighted moving average (WMA) is as follows:
WMA = (P1*W1 + P2*W2 + ….+ Pn*Wn) / (W1+ W2+ …..+ Wn)
Where:
- P1, P2, Pn = the most recent to oldest prices
- W1, W2, Wn = the weights assigned to each price, with the most recent being the highest weight.
The weighted moving average can be smoothed out further by adding more data points and assigning different weights to them. For example, instead of a simple 3-day moving average, you could use a 9-day weighted moving average where the most recent days have higher weights and the older ones have lower weights.
How to trade using weighted moving averages
Traders often use WMAs to enter and exit trades. A buy signal is generated when the WMA crosses above a certain level, and a sell signal is generated when the WMA crosses below that same level.
Traders may assign higher weights to more recent prices and lower weights to older ones to reflect significant short-term price movements better. Additionally, some traders may opt for an exponential weighting scheme, in which each successive price is assigned a higher weight than the preceding one.
This emphasizes the most recent prices and gives them more influence over the outcome. Whatever approach is used, traders should always know how their chosen weights will affect their moving average calculations. Furthermore, choosing an appropriate range for the formula is also important, as the range should match the trader’s investing time horizon.
For instance, a long-term investor might use a 200-day moving average, while a short-term scalper may only look at prices over the last five days. Finally, some traders will choose to use multiple moving averages with different ranges to identify strong market trends.
4. Exponential weighted moving average
The exponentially weighted moving average is a variation of the simple moving average. This approach differs because it emphasizes recent data points more than all data points equally. The formula utilizes a smoothing factor known as the ‘smoothing constant’ to assign greater weight to more recent prices. Traders need to understand how this smoothing constant will impact the calculation. A higher smoothing constant will result in less lag and a more accurate representation of current prices. A lower smoothing constant will increase the lag but may be useful when identifying long-term trends.
How to calculate an exponential weighted moving average?
The basic calculation formula is:
EWMA = ((Price x S) + (Previous EWMA x (1 – S))) / (1 + S).
Where ‘S’ represents the smoothing constant. This can be calculated by taking 2 divided by (N+1), where N is the number of data points you wish to consider.
Example Chart: Exponential Weighted Moving Average
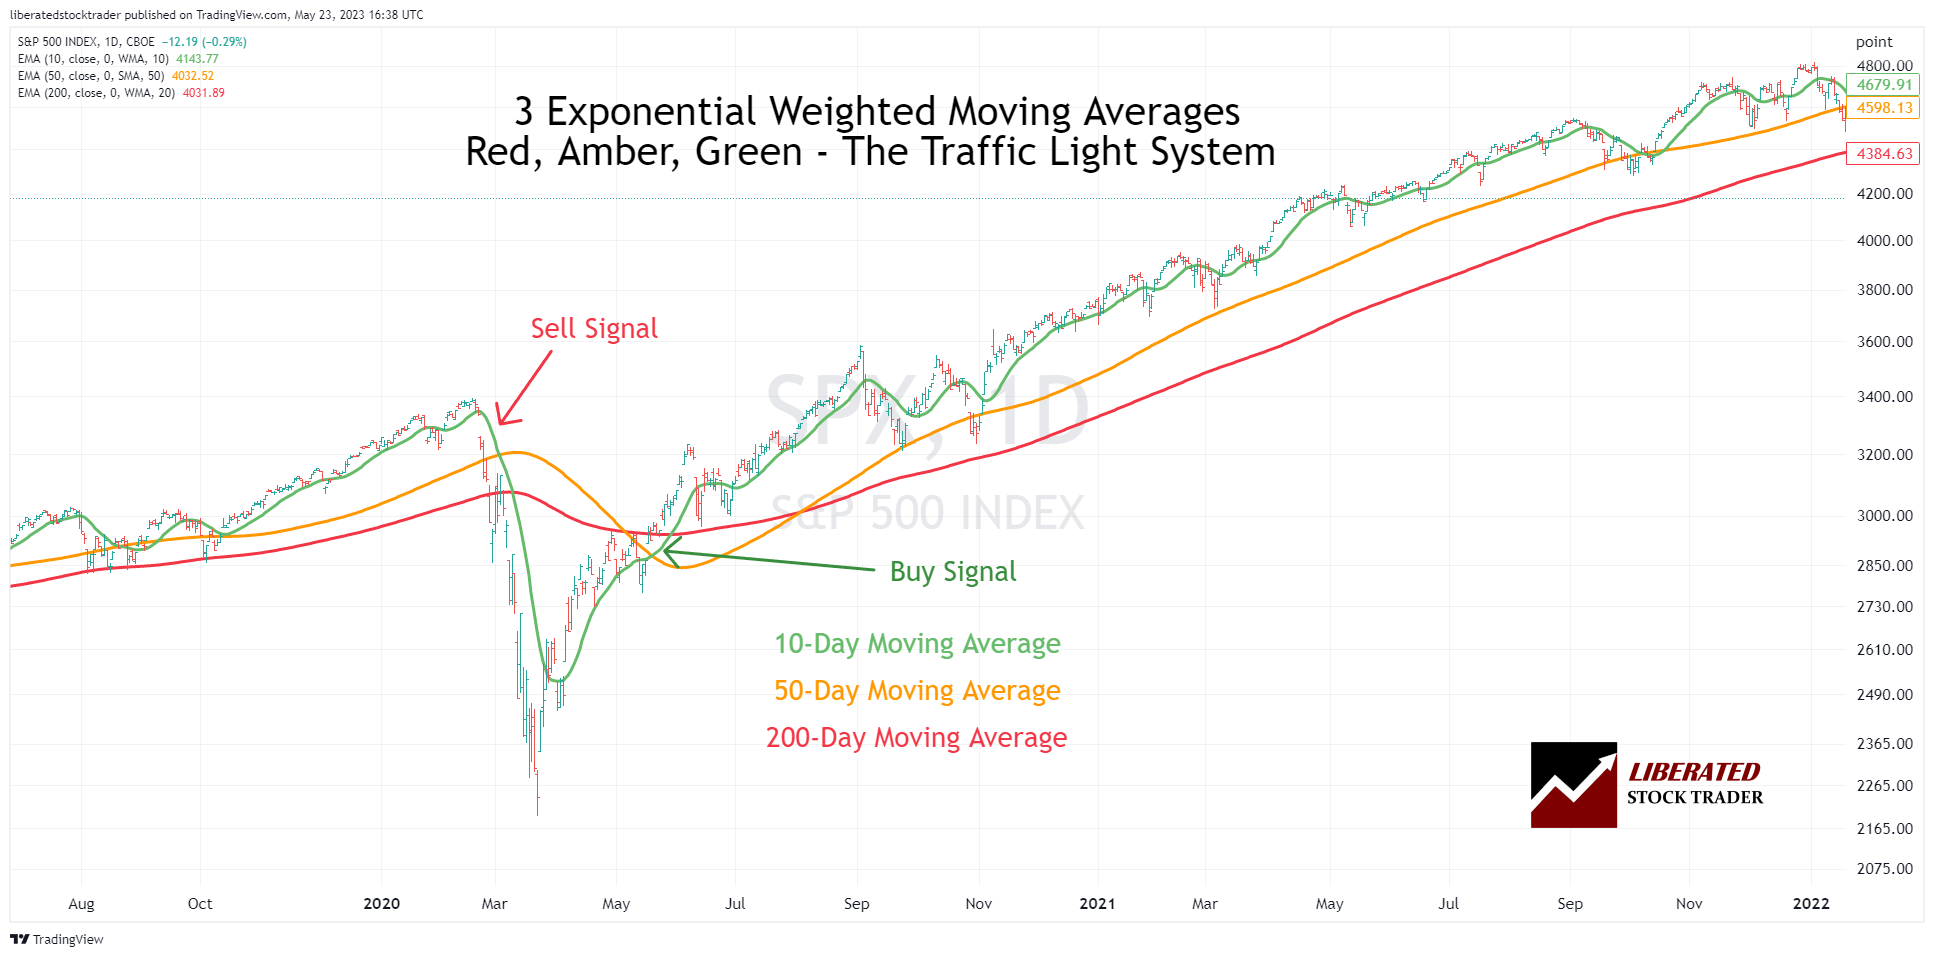
Trading an Exponential Weighted Moving Average
Traders use exponentially weighted moving averages (EWMA) to identify trend direction, strength, and momentum. When the EWMA rises, prices increase, and the market has positive momentum. Conversely, when the EWMA line falls, it suggests that prices are decreasing and that the market has negative momentum.
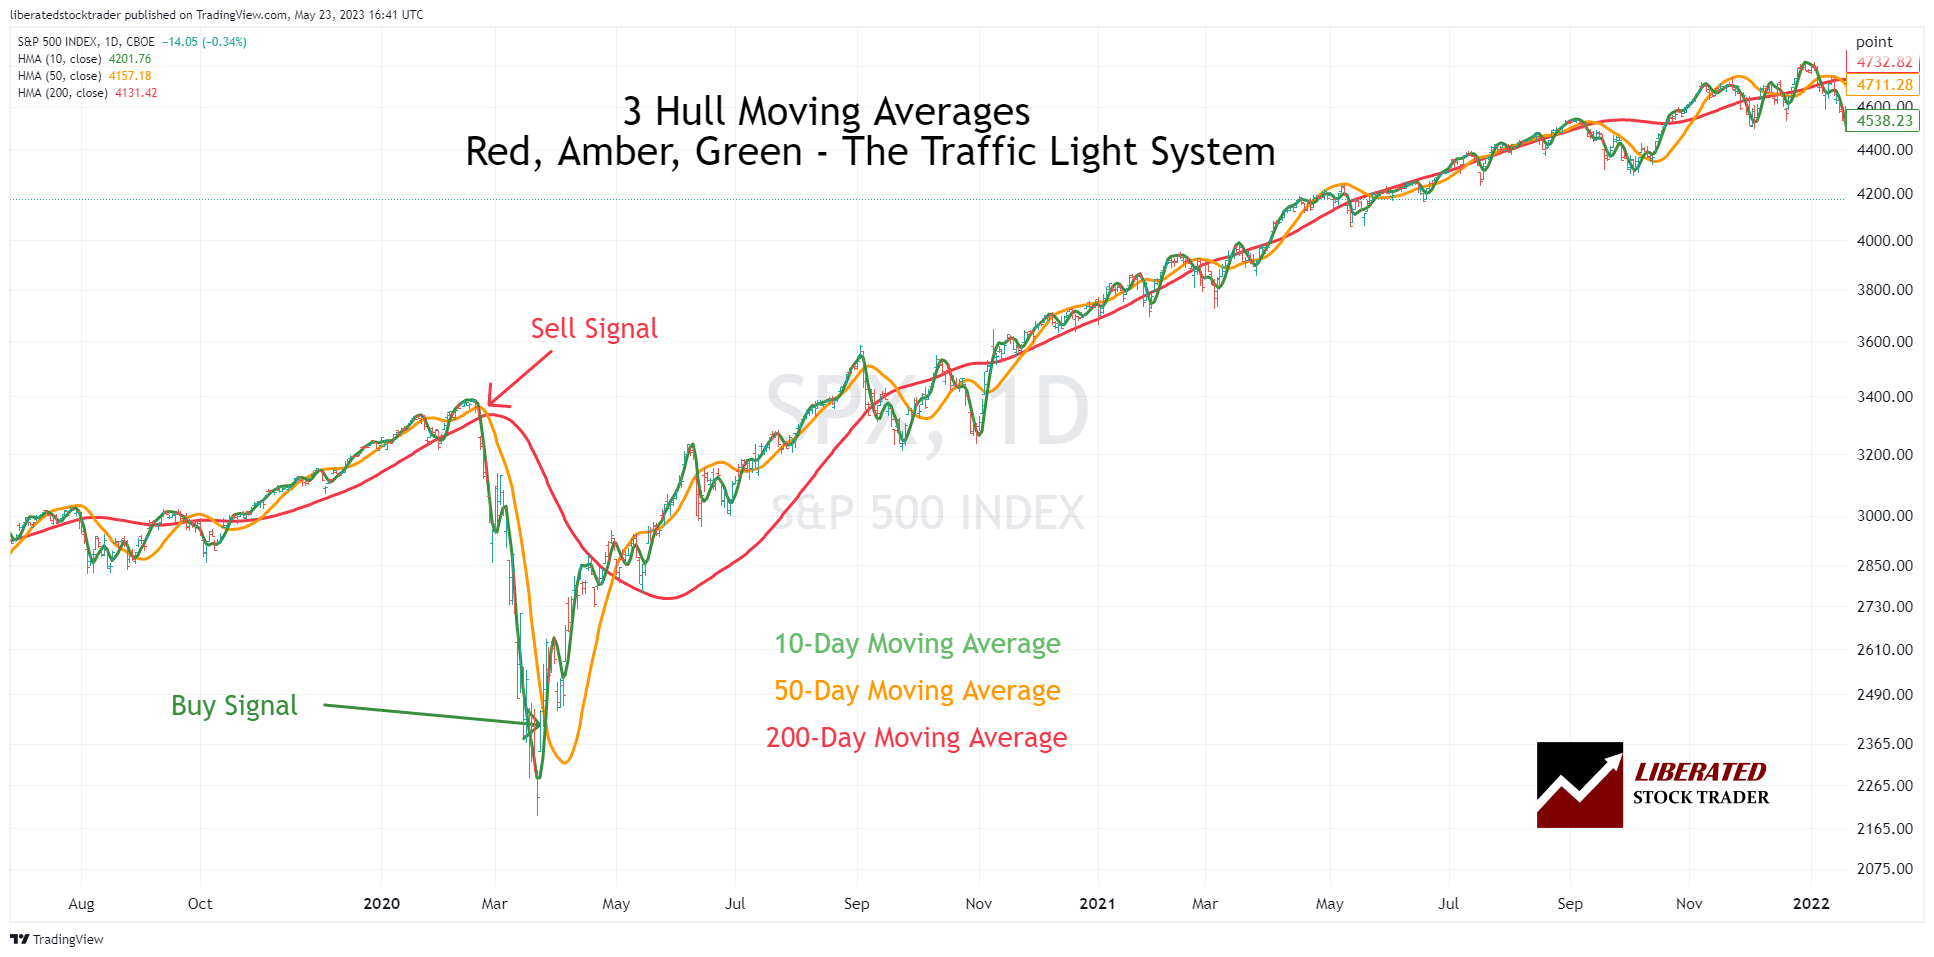
5. Hull moving average?
The Hull moving average (HMA) is an advanced form of the Exponential Weighted Moving Average (EWMA). It was developed by Alan Hull, a financial analyst and trader. The HMA attempts to reduce the lag associated with traditional moving averages by weighting prices differently over time. This results in a more responsive indicator that adjusts to the current market faster.
It also has advantages over other indicators, such as filtering out more false signals and providing clearer trading signals. The HMA can be used as a standalone indicator or in combination with other indicators, such as the MACD or RSI. Thanks to its flexibility, the HMA can be used in various trading strategies, from short-term scalping to long-term trend-following techniques. It’s a great tool for any trader who wants to stay ahead of the market.
Example Chart: Hull Moving Average
How to calculate a Hull moving average?
The HMA is calculated by finding the sum of the square roots of several price periods and dividing it by an exponential smoothing factor. This allows the HMA to quickly adjust to new market conditions, making it ideal for trend-following strategies.
The Hull moving average formula:
The HMA is calculated using the following formula:
HMA = WMA(2 * WMA(n/2) – WMA (n))
“WMA” stands for Weighted Moving Average, and “n” represents the number of data points used to calculate the average. The Hull Moving Average combines weighted moving averages (WMA), discounting older data and increasing the weighting of newer data. It incorporates both short-term and long-term data to produce a smoother curve than either of those two indicators alone.
The HMA helps traders identify potential entry and exit points more quickly and provides support/resistance levels. It can also be used to identify trends and trend reversals. Another advantage of the HMA is that it generates fewer false signals than other indicators, such as the MACD or RSI.
How to trade using a Hull moving average
Trading the Hull Moving Average is similar to trading other moving averages. Look for price crossing up through the HMA line, or use multiple HMA lines and observe the crossovers to generate buy and sell signals.
Other moving average-based indicators?
Moving averages are used in other technical analysis indicators such as the MACD indicator, Bollinger Bands, and Keltner Channels. These indicators measure a security’s momentum, volatility, and strength and can help traders identify trends.
MACD indicator – The MACD indicator plots the difference between two moving averages. It measures momentum and can be used to identify potential entry and exit points.
Bollinger Bands – Bollinger Bands are a volatility indicator that uses three simple lines to measure market activity. They consist of an upper line, a lower line, and the middle band, a moving average. The two outer lines represent the upper and lower boundaries of the market, while the middle line represents the average price. Traders can use Bollinger Bands to identify potential market entry and exit points.
Keltner Channels – Donchian Channels and Keltner Channels are another volatility indicator that uses three simple lines to measure market activity. Keltner Channels plot the average true range over a particular period, with an upper line and a lower line representing the market activity’s upper and lower boundaries. Traders can use Keltner Channels to identify market entry and exit points.
Stochastics – Stochastics is an oscillator indicator that measures momentum and potential trend reversals. Stochastics are calculated by tracking the closing price of a particular security relative to its high and low over a predetermined period. Traders can use Stochastics to identify potential market entry and exit points.
Alligator Indicator – The Alligator Indicator is a trend-following indicator that helps traders identify when to enter and exit trades. It consists of three lines representing the Jaw, Teeth, and Lips of an alligator. When the Jaw (blue line) crosses above or below the Teeth (red line), it indicates a potential buy or sell signal. Additionally, if the Lips (green line) crosses above or below both the Jaw and Teeth lines, it can also be seen as a confirmation for a trade entry or exit.
What Is a Golden Cross?
A Golden Cross is a crossover where the short-term moving average crosses above the long-term moving average. This is typically seen as a bullish signal, and traders can use this indicator to determine when to enter or exit the markets. On the other hand, a Death Cross occurs when the short-term moving average crosses below the long-term moving average. This is typically seen as a bearish signal and can warn traders of possible trend reversals.