What is the reality of trading and investing in stocks? How much money do you think you can make in one year?
Our research, using 30 years of data, reveals average yearly profits of 6.8% for gold, Treasuries (4.8%), Corporate Bonds (7.2%), Real-estate (4.8-9.5%), and Stocks (8-13%).
In this article, we present researched examples and provide guidance to set realistic expectations for your trading goals.
How Much Can You Make Investing?
One of the most common questions when considering investing in stocks is, “How much money can I realistically expect to make?”
When investing in stocks, there are various options in the market, including individual stocks, mutual funds, and exchange-traded funds (ETFs). Individual stocks may have the potential for higher returns, but they are also associated with higher risk. Mutual funds and ETFs are less risky than individual stocks because they offer diversification but may provide lower returns. For a more detailed report, see our full report on Buy-and-Hold Investments.
Growth Stocks: 10-20%
Growth stocks are expected to have higher than average revenue and earnings growth, usually above 10% yearly. Investing in these stocks can offer the potential for high returns. For example, if you had invested $1,000 in Amazon in 1997, your investment would be worth over $1 million in 2021.
Beat The Market, Avoid Crashes & Lower Your Risks
Nobody wants to see their hard-earned money disappear in a stock market crash.
Over the past century, the US stock market has had 6 major crashes that have caused investors to lose trillions of dollars.

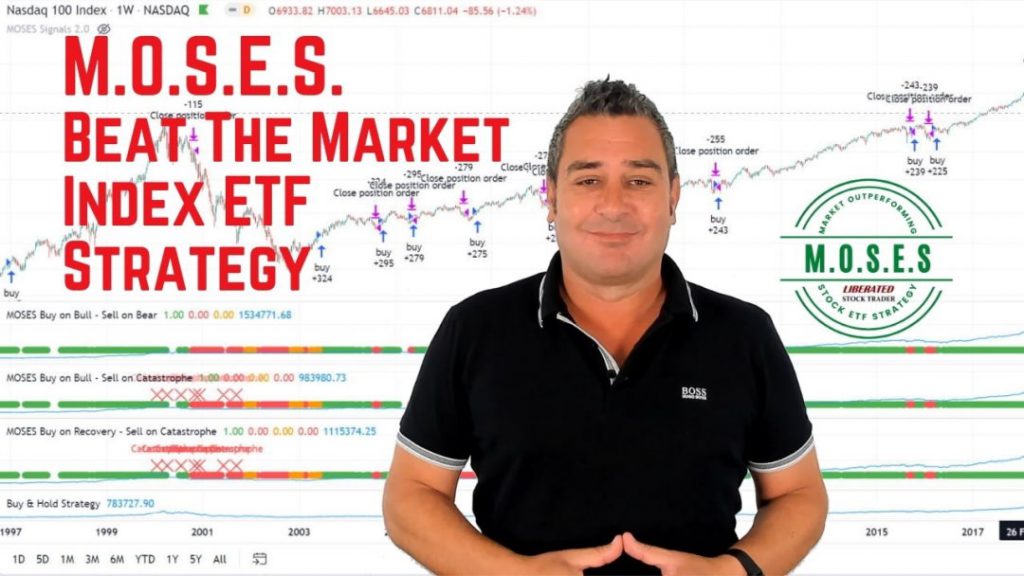
The MOSES Index ETF Investing Strategy will help you minimize the impact of major stock market crashes. MOSES will alert you before the next crash happens so you can protect your portfolio. You will also know when the bear market is over and the new rally begins so you can start investing again.
MOSES Helps You Secure & Grow Your Biggest Investments
★ 3 Index ETF Strategies ★
★ Outperforms the NASDAQ 100, S&P500 & Russell 3000 ★
★ Beats the DAX, CAC40 & EURO STOXX Indices ★
★ Buy & Sell Signals Generated ★
MOSES Helps You Sleep Better At Night Knowing You Are Prepared For Future Disasters
Investing in the stock market is a popular choice for people who want to grow their wealth. With its potential for high returns, many investors are drawn to the stock market to reach their financial goals. However, investing in stocks can also be risky, especially if you don’t understand the market’s ups and downs.
Dividend Stocks: 3-5%
Dividend stocks pay out a portion of their earnings to shareholders through regular dividends. These stocks may not have as much potential for growth as growth stocks, but they can offer a steady stream of income. For example, if you had invested $10,000 in Coca-Cola in 1990 and reinvested all the dividends, your investment would be worth over $100,000 in 2021.
A 5 Step Screening Strategy To Find Top Dividend Growth Stocks
Trading Stocks: 10-20%
Trading stocks involves buying and selling stocks over a shorter period, usually days or weeks. This strategy can be risky, as stocks can be unpredictable in the short term.
Our research into the most successful stock trading indicators for day traders reveals that using the Price Rate of Change, VWAP, and Hull Moving Average can outperform the market by double, meaning an annual return of 10-20%.
Additionally, when it comes to individual stock selection, if you had invested $10,000 in Tesla in March 2020 and sold it in December 2020, your investment would have grown to over $90,000.
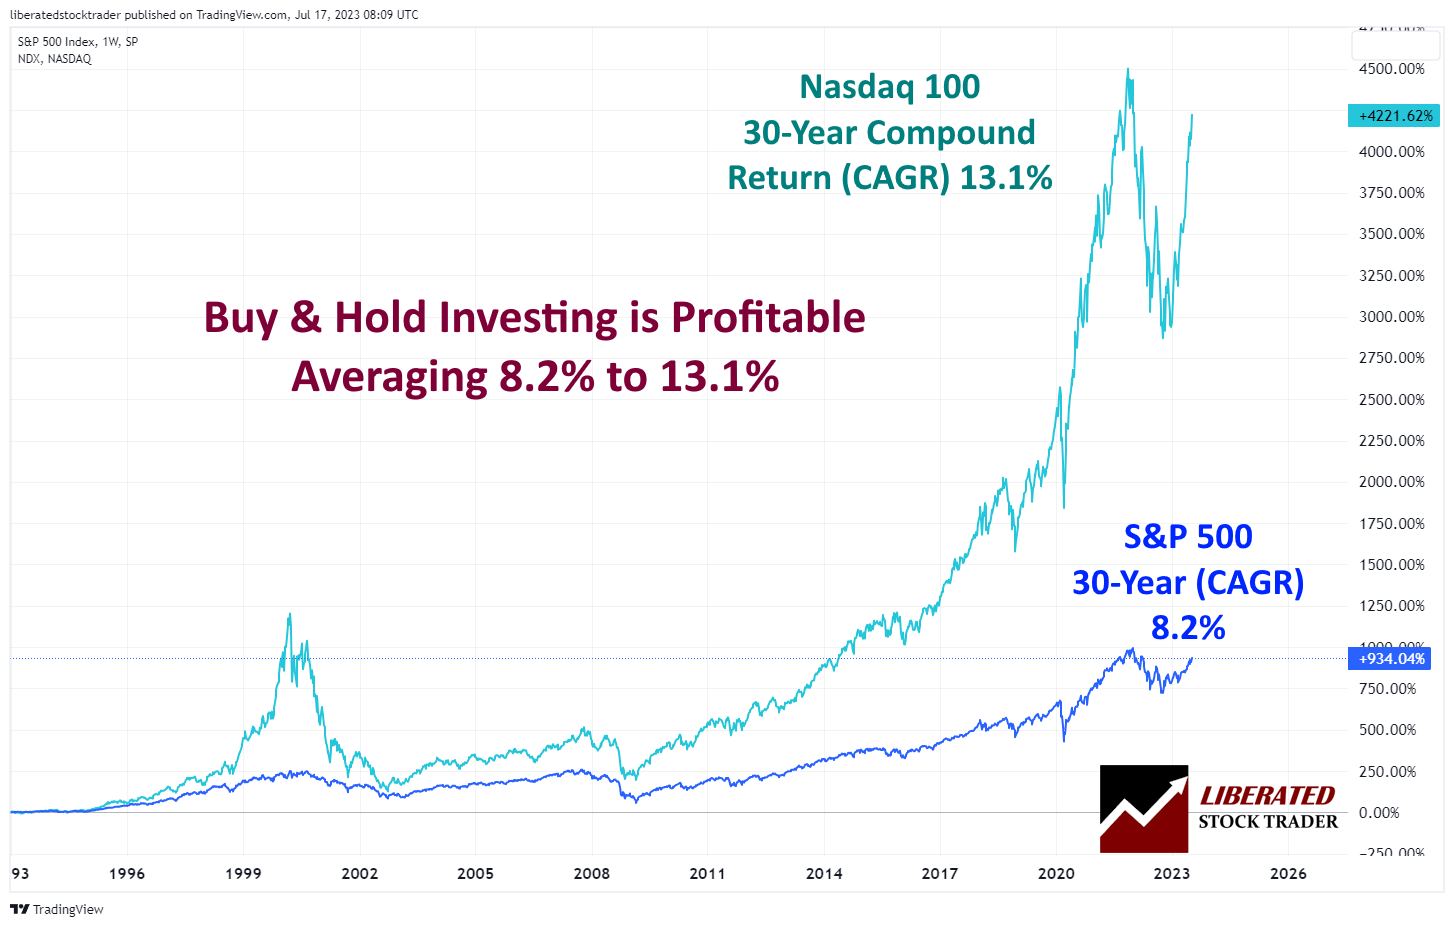
Nasdaq 100 Index Fund: 13%
Index funds track a particular index, NASDAQ 100. These can be a good way to gain exposure to the stock market without picking individual stocks. The average return for the NASDAQ 100 from 1993-2023 was 13% per year before fees and taxes. Investing in an index fund is a great way to get started.

Get the Best Charts with TradingView
S&P 500 Index Fund: 8%
Like the NASDAQ 100, the S&P 500 is another popular index fund that tracks a broad stock market index. Over the same 30-year period, the S&P 500 had an average return of 8% per year before fees and taxes.
For example, if you had invested $10,000 in the S&P 500 index in 2010, your investment would be worth over $33,000 in 2021.
Corporate Bonds: 7.20%
Corporate bonds are debt securities issued by corporations and can provide investors with a steady income stream. The average return on corporate bonds from 1993-2023 was 7.20% per year before fees and taxes.
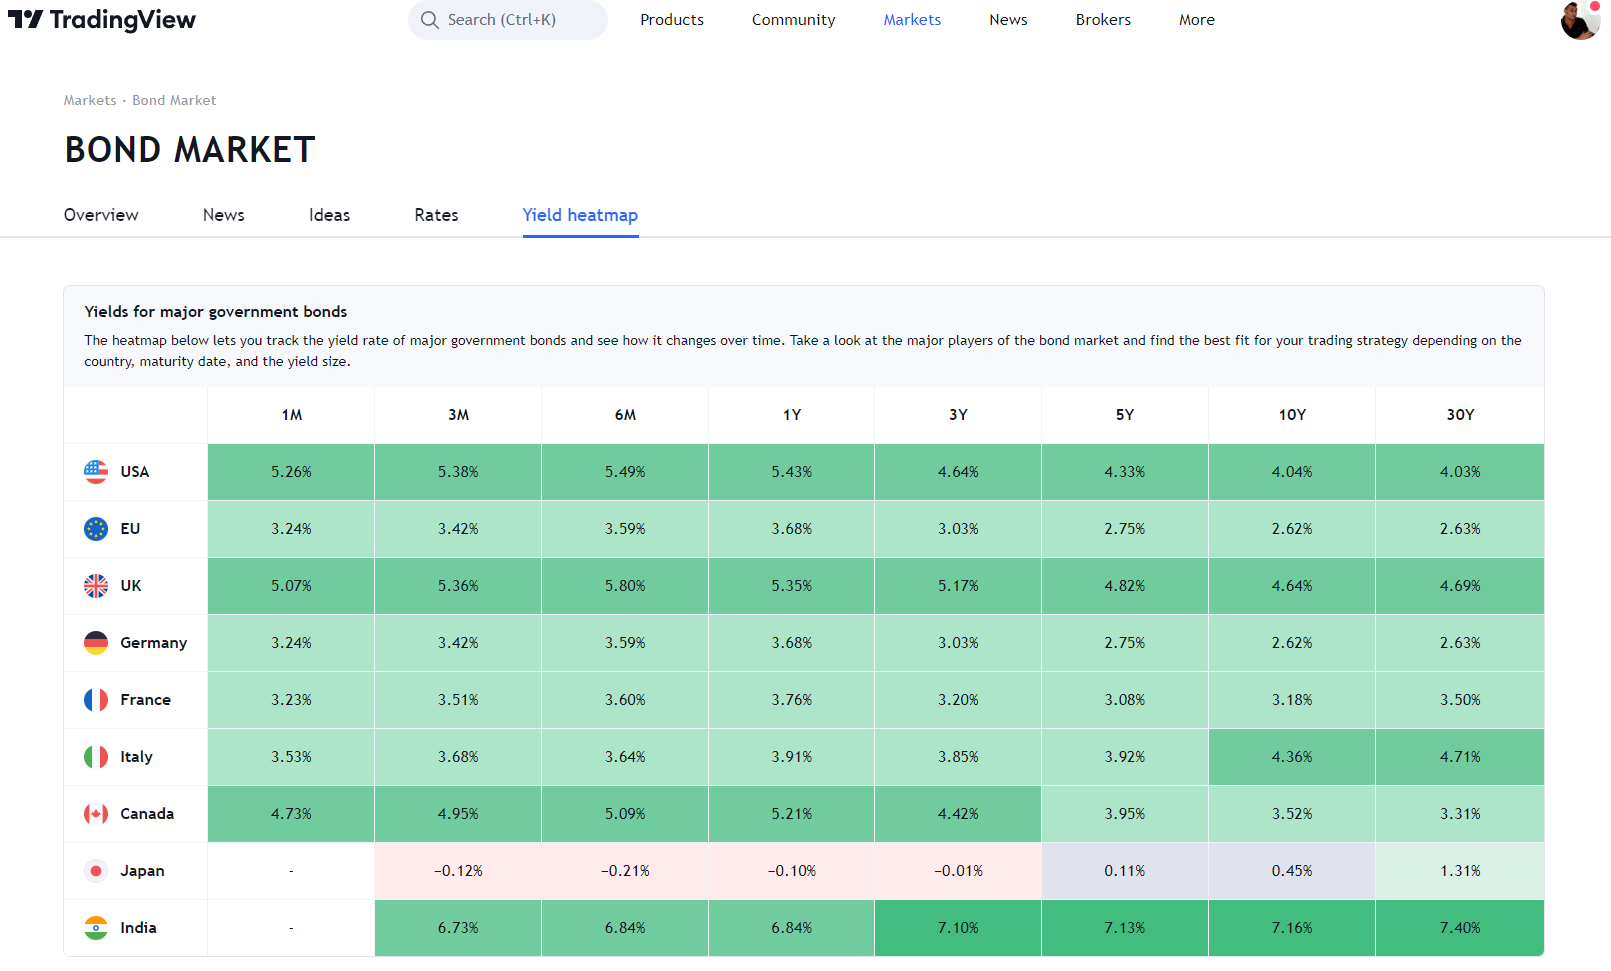
Using TradingView, you can see the world’s Bond markets in charts. This will help you better understand the overall bond market and make it easier to analyze individual bonds and evaluate their potential returns. The charts show the performance of global sovereign debt, corporate debt, emerging markets debt, mortgage-backed securities, and covered bonds.

Get Bond Investing Information in TradingView for Free
Investing in corporate bonds is generally viewed as lower risk than equities, but it’s important to note that the returns may be lower.
Gold: 6.80%
Gold is a popular asset for diversification and protection against inflation. From 1993 to 2023, it had an average annual return of 6.80% before fees and taxes.
Investing in physical gold can be costly due to storage costs, so you may want to consider investing in ETFs or other mutual funds that provide exposure to gold prices.
Real Estate: 4.8-9.5%
Real estate has historically provided investors with a steady income stream. From 1993-2023, real estate investments had an average return of 4.8% per year before fees and taxes. Real estate investments can be highly illiquid, so it is important to consider the risks associated with investing in this asset class. Additionally
US T. Bond: 4.90%
US Treasury bonds have been a reliable asset for investors seeking stability and security. From 1993-2023, US Treasury Bonds had an average return of 4.90% per year before fees and taxes. The returns on T-Bonds are often lower than other investments, but the security makes it a desirable asset for conservative investors.
3-month T.Bill: 2.20%
Three-month US Treasury bills are short-term investments with three months or less maturity. From 1993-2023, they had an average return of 2.20% per year before fees and taxes. These securities provide investors with liquidity and low risk, making them a popular choice for conservative investors who don’t have the stomach for stock market volatility.
There are no sure and easy paths to riches on Wall Street or anywhere else
Benjamin Graham – The intelligent investor
Table: Annual Returns of Stocks, Bonds, Real-Estate, Gold & Treasuries (1993-2023)
| Buy-and-Hold Assets | 30-Year Compound Annual Return |
| Index Fund: Nasdaq 100 | 13.10% |
| Index Fund: S&P 500 | 8.20% |
| Corporate Bonds | 7.20% |
| Gold | 6.80% |
| US T. Bond | 4.90% |
| Real Estate | 4.80% |
| 3-month T.Bill | 2.20% |
Source: Buy & Hold Investing
As you can see from this table, US Treasury bills have the lowest average return compared to other investment vehicles. However, they still offer a decent rate of return for investors who prioritize safety and liquidity over yields. Furthermore, their low risk makes them appealing to those who want to preserve their capital while earning a moderate return.
Try TradingView, Our Recommended Tool for International Traders
Global Community, Charts, Screening, Analysis & Broker Integration

Global Financial Analysis for Free on TradingView
Interestingly, the index funds of the Nasdaq 100 and S&P 500 have significantly higher average returns than other investment assets but come with a much higher degree of volatility. Investors looking to maximize their returns may consider investing in these funds if they have the stomach for stock market volatility and can tolerate the potential losses accompanying such investments.
In conclusion, investing in safe US Treasury bonds can provide a decent rate of return with low risk, whereas index funds of the Nasdaq 100 and S&P 500 have higher yields but also come with significantly higher levels of volatility.
Factors That Affect Your Return
A key factor that affects returns is the company you invest in. It is important to understand how the company fits in the market, its business model, and the risks involved in the company’s industry. For example, if you are buying stocks in a big retailer, understanding changing customer preferences could be a big factor in the stock’s performance.
Other factors, such as government regulations, interest rates, and global events, can significantly impact stock prices. Such macroeconomic factors tend to influence stock prices directly or indirectly.
Diversification
It’s important to diversify your portfolio by investing in a mix of different stocks and asset classes. This can help mitigate risk and potentially increase returns. It’s also important to have a long-term investment strategy and not panic during market downturns. Remember, the stock market is unpredictable, but it has historically provided strong returns over the long term.
Managing the Risk
Stock markets require a proper understanding of the risks involved and the capacity to absorb financial losses. An important concept here is understanding the idea of diversification in your portfolio. Diversification is an important part of managing risk, as it can help spread risk across different types of investments, reducing the overall risk of your portfolio.
How much money one can make in stocks depends on factors such as the companies invested in, economic fluctuations, individual risk appetites, and investment choices. While there is no guaranteed return, historical averages are the best yardstick. Invest sensibly and with proper knowledge and analysis, and remember to manage your risk and avoid unnecessary risks.
How Much Money Do the Best Investors Make?
Warren Buffett and George Soros are considered legendary investors, so how much did they make investing over the previous decades? Buffett’s net worth has increased by $60 billion since the mid-1990s, while Soros gained $25.2 billion in the 1990s alone. This shows that even for highly successful investors, there are no guarantees, and wins are not always consistent or long-lasting.
Warren Buffett: 24.7% per year
Warren Buffett is the 5th richest man in the world, with an estimated net worth of $118 Billion. He is a self-made billionaire who made it all by investing in stocks.
From 1965 through 2023, Buffett achieved an annual compound rate of return on his investments of 24.7%. This means that for every $1 invested in 1965, it has grown to $104.9 at the end of 2017. This is an impressive feat, with the S&P 500 annual return during this period being just 9.8% and gold’s average annual return being 6.8%.
Building the Best Buffett Stock Screener for Value Investing
Buffett’s success has been credited to his value investing strategy, where he looks for companies with strong assets and consistent growth potential trading at a discount. He also follows the philosophy of “buy and hold,” which means he doesn’t try to time the market or actively trade stocks but instead holds investments for the long term.
George Soros: 28.6% Annual Compound Return
George Soros is another highly successful investor who has achieved impressive returns. His average annual compound return from 1969 to 2023 was 28.6%. This means that for every $1 invested in 1969, it had grown to $735. Soros follows long-term investments but also trades complex financial instruments like derivatives and currencies.
Soros has also succeeded through short-term investments; for example, he famously bet against the British pound in 1992 and made a billion dollars in a single day.
In addition to investing, Soros is also an active philanthropist and political activist. He has donated billions of dollars to causes he believes in, including human rights, education, health care, and the environment. He also strongly supports progressive politics and has been involved in numerous campaigns worldwide.
FAQ
How much money can I make from investing?
The potential returns from investing are influenced by several factors, including the amount invested, investment choices, investment duration, and market conditions. Over the last 30 years, the stock market has historically delivered an average annual return of 6-10%, adjusted for inflation.
How long does it take to make money from investing?
Successful investing requires a long-term perspective. Although short-term gains may entice some investors, the true benefits of investing are often derived from holding investments for years or even decades. This approach unlocks the potential for compounding returns.
Can investing make you rich?
Yes, investing can make you rich if done wisely. However, it's important to understand that it's not a get-rich-quick scheme. Building wealth through investing usually requires time, patience, and a well-diversified portfolio.
How much do I need to invest to make $1000 a month?
This depends on your expected annual return rate. If you expect a 7% annual return (around the historical average for the stock market), you would need to invest approximately $171,000 to generate $1,000 per month.
How much should I invest in stocks as a beginner?
There's no one-size-fits-all answer to this question. It depends on your financial situation, risk tolerance, and investment goals. However, good advice is to start small, learn the basics, and gradually increase your investments as you become more comfortable.
What is the best software for tracking how much I make investing?
If you are primarily stock trading, the best software is TradingView. TrendSpider is the best for an AI-powered systematic approach to investing, and for long-term investors, Stock Rover is the best choice for value, growth, and income investors.
What makes more money, ETFs, day trading, or growth investing?
Our research shows ETFs are generally lower-risk but can make 13% per annum, but growth investing can yield higher returns of up to 20% per year over the long run. Day trading can yield up to 25% annually but is risky and requires more frequent monitoring.
What advice do you have for new investors?
The best advice for beginning investors is to start small and get comfortable with your investment strategies before increasing your investments. Make sure to research different stocks and ETFs and understand the risks you're taking with each one.
Can I make more money in real estate or stocks?
The evidence suggests the annual returns of investing in major stock index trackers like the NASDAQ 100 can be up to 10% per year, but also wise investment choices in real estate can yield from 4.8-9.5%.
How Much Can You Really Make Investing?
Based on our data, you are realistically not going to make more than 25% per year, like legendary investors. However, you can realistically make 8-13% by investing long-term in index funds, 7.2% in corporate bonds, or 4.9% in treasury bonds.
Our research, using 30 years of data, reveals realistic earning potential across multiple assets. Investing in gold, bonds, growth stocks, real estate, or index funds can yield annual returns between 5% and 20%.
For those wanting higher returns, investing in growth stocks may be the answer to achieving 20% compound returns per year.
You want to be a successful stock investor but don’t know where to start.
Learning stock market investing on your own can be overwhelming. There’s so much information out there, and it’s hard to know what’s true and what’s not.
Liberated Stock Trader Pro Investing Course
Our pro investing classes are the perfect way to learn stock investing. You will learn everything you need to know about financial analysis, charts, stock screening, and portfolio building so you can start building wealth today.
★ 16 Hours of Video Lessons + eBook ★
★ Complete Financial Analysis Lessons ★
★ 6 Proven Investing Strategies ★
★ Professional Grade Stock Chart Analysis Classes ★


Dear Mr Moore .
Thank you for the information you provided .
I wanna ask you about a study i have made which has convinced me to plan my own Business Project (includes office , employees ….etc) for managing turkish portfolios :
I applied my technical analysis on 15 kinds of profitable Turkish Stocks for the last year(2014) and according to this study i found out that my profits have reached 40% .
So is this not real (according to your essay)? or is there something wrong with my study ?
Looking for your advice plz
Thank you
Hi Mazen,
thanks for the comment, yes when we create scans and systems sometimes is seems that we can achieve high returns, from the past this may have worked but will it work in the future? One way is to test the system by putting your money on it, another way is to watch the system to see how it performed in the next year. Returning 40% year on year may not be realistic as the markets go through bull and bear phases, check how the system performed in 2007 to 2009 they you can see if it is robust enough for the long term. Also the “How to avoid the next stock market crash course” has some solid technical analysis which may be useful to incorporate into your system, to avoid downside losses. Good luck with your work
Barry