Professional analysts define all stock market trends using timeframe and direction: Timeframes are short-term, medium-term, and long-term. Direction is described using uptrend, downtrend, or consolidation.
Analyzing the direction and duration of asset price movements in the market enables you to improve your investing outcomes.
In this expert guide, we’ll explore the key characteristics of uptrends, downtrends, and consolidations and delve into the factors that lead to them.

Quick Summary
Stock Price Trends:
- Uptrend: The stock or index is moving up, making new highs or higher highs
- Downtrend: The stock or index is moving downwards, making lower lows
- Sideways consolidation: neither making significant new highs nor new lows
Stock Trend Timeframes:
- Short-Term: Lasting days to weeks
- Medium-Term: Weeks to months
- Long-Term: Months to years
1. Stock Market Trend Timeframe
A stock market trend is partly the direction but also the time factor. There are three commonly agreed time frames for a trend: short-term, medium-term, and long-term.
Short-term Market Trend
A short-term trend typically lasts from a few days to a few weeks. They are influenced by short-term news events, company-specific announcements, or technical factors. For example, releasing quarterly earnings reports or FDA approvals can trigger short-term trends.
Short-term trends are often characterized by volatile price movements and can provide opportunities for active traders looking to capitalize on quick price swings. Using this reference, we can say that the market is in a short-term uptrend, downtrend, or consolidation.
Example: Short-term Market Trend Chart
The chart below shows NVidia Corp’s three short-term trends. Notice how each trend lasts from days to weeks. In August, the stock was in a short-term uptrend that lasted five days. This then changed into a short-term consolidation. This consolidation ended in a short-term downtrend that lasted eight days. The consolidation ended when the price broke below the support line. Finally, this short-term downtrend reversed and moved into a medium-term uptrend.

View this chart on TradingView
Medium-term Market Trend
A medium-term stock market trend typically lasts from a few weeks to a few months and is influenced by a combination of technical and fundamental factors. Changes in market sentiment, economic indicators, or industry-specific developments can drive medium-term trends. Investors focusing on medium-term trends often seek to capture larger price movements and take advantage of trend confirmations and reversals.
Using this time frame, we can say that the market is in a medium-term uptrend, downtrend, or consolidation.
Example: Medium-term Trend Chart
The chart below shows Microsoft Inc.’s three medium-term trends. Notice how each trend lasts from weeks to months. The stock was in a medium-term downtrend from early 2020, which then reversed into a medium-term uptrend. The downtrend ended when the price broke above a resistance line, which marked the beginning of an uptrend. The uptrend ended in September 2020, and Microsoft’s trend moved into a medium-term consolidation.
View this chart on TradingView
Long-term Market Trend
A long-term stock market trend typically lasts from several months to several years. Long-term economic cycles, industry trends, and structural shifts in the market influence them. Long-term trends are often driven by fundamental factors such as demographic changes, technological advancements, or regulatory developments. Investors focusing on long-term trends are typically looking to capitalize on large-scale price movements and capture major trend reversals.
Example: Long-term Market Trend Chart
The chart below shows the NASDAQ 100 10-year long-term uptrend. Notice the long timeframe in the chart, which is a weekly chart spanning ten years.
View this chart on TradingView
2. Stock Market Trend Direction
The first component in analyzing a stock market trend is understanding the stock’s or index’s direction. There are only three directions a stock price can take.
Uptrend: Riding the Wave of Optimism
A stock market uptrend occurs when stock prices consistently go up. This indicates that the economy is doing well and that investors are confident in the future.
An uptrend is characterized by a consistent upward movement in stock prices over a period of time. During an uptrend, investors witness higher highs and higher lows, indicating an overall positive sentiment in the market. Some defining features of an uptrend include:
- Gradual and sustained increase in stock prices
- Higher trading volumes as more investors join the buying spree
- Positive investor sentiment and optimism about the company or the broader market
- Bullish chart patterns, such as higher highs and higher lows
Factors contributing to an uptrend can vary but often include strong company earnings, positive economic indicators, and favorable market conditions. For example, a technology company releasing a groundbreaking product may experience an uptrend as investors anticipate increased profits.
An uptrend is defined by the stock price making higher highs and higher lows.
Example: Stock Market Uptrend
We can observe a strong upward trend in Apple Inc.’s performance. It is worth noting that the lower support trend line is gradually rising, while the upper resistance line also shows an upward trajectory. – This is a clear sign of an uptrend.
View this chart on TradingView
Downtrend: Navigating the Stormy Waters
A consistent downward movement in stock prices characterizes a downtrend. During a downtrend, investors witness lower lows and lower highs, indicating a negative sentiment in the market. Key features of a downtrend include:
- A gradual and sustained decrease in stock prices
- Lower trading volumes as investors become cautious or exit their positions
- Negative investor sentiment and pessimism about the company or the broader market
- Bearish chart patterns, such as lower lows and lower highs
Downtrends are often triggered by factors such as poor company earnings, negative economic indicators, and unfavorable sentiment toward the market. For instance, a sudden increase in interest rates or a global economic recession can lead to a downtrend in the stock market.
The duration of a downtrend can also vary, ranging from days to years, depending on the severity of the factors impacting the trend.
Example: Downtrend Chart
This example of a strong downtrend in Netflix Inc. shows the stock price falling 70% from $700 to $181 over seven months as investors become more bearish.
The chart displays the lower lows and lower highs associated with a downtrend, indicating that prices are heading lower with each successive wave. When investors believe that the trend will only continue downward, they will likely sell their positions in the stock and find other investments, leading to further price drops.
View this chart on TradingView
Consolidation: The Calm Before the Storm
Consolidation refers to a period of price consolidation or sideways movement without a clear upward or downward trend. During consolidation, stock prices trade within a specific range or channel. Key features of consolidation include:
- Sideway movement with no clear trend direction
- Lower trading volumes as traders wait for a breakout or breakdown
- Uncertainty and indecision among investors
- Chart patterns such as a trading range or a symmetrical triangle
Consolidation occurs when the market lacks a catalyst to push prices decisively in one direction. It often happens after a prolonged uptrend or downtrend as investors take a breather and reassess their positions.
The duration of consolidation can vary greatly, from a few days to several months, depending on market conditions and the forces at play.
A sideways trend or price consolidation is when a stock or index finds equilibrium and investors feel the price is at fair value. This consolidation is seen by observing that the price is moving sideways.
Example: Consolidation Trend Chart
Here is an example of NVidia’s seven-month consolidation trend before an explosive uptrend. Notice how the price kept a tight range for seven months before taking off. The trendline is drawn to illustrate this consolidation period.
Read the full consolidation rectangle trading article.
3. Combining Time & Direction
By combining the timeframe and trend direction, you can accurately categorize the current and historical stock market trends. Below, you can see over the last three years, the S&P 500 index has experienced a short-term downtrend (the Covid Crash), a long-term uptrend (the Covid Recovery), and a medium-term down-trend in 2022.
Example Chart
In addition to these more general trends, there have been various consolidations. Consolidations occur when prices remain within a tight range and demonstrate neither an uptrend nor a downtrend. Depending on the stock and market conditions, these consolidation periods can last for days, weeks, months, or even years. Understanding how to trade stocks during these sideways periods is essential for ongoing success.
4. Identifying Trends with Moving Averages
The easiest way to identify a stock trend is to plot a simple moving average of a stock chart. If the stock price is above the moving average, it is in an uptrend. If the price is below the moving average, it is a downtrend.
We can use moving averages to quickly assess if the market is in an up or downtrend and in what time frame. To do this, we need to set up three moving averages on a chart.
Using Moving Averages to Assess the Stock Trend
- Open your stock charting software; try TradingView for free.
- Set the chart price scale to logarithmic or percent.
- Select the timeframe to 1 day per bar.
- Set up a long-term moving average: Add the Moving Average indicator and set it to 200. Set the color to white. This is the moving average of 200 days of price history.
- Set up a medium-term moving average: Add a Moving Average of 100 with an orange color. This is the moving average of 100 days of price history.
- Set up a short-term moving average: Add a Moving Average of 20 with a green color. This is the moving average of 20 days of price history.
You can now look at the chart. The stock is in a short-term uptrend if the price exceeds the green line. It is in a medium-term uptrend if the price is above the orange moving average. Finally, if the price is above the white 200-day moving average, it is in a long-term uptrend.
If the price exceeds the 200-day moving average, we can assume it is a long-term uptrend. Below, then it is in a long-term downtrend. 200 days = 10 months = months to years time frame.
If the price is above the 100-day moving average, we can assume it is in a medium-term uptrend because it is above 100 days = 5 months = weeks to months time frame.
The same goes for the 20-day moving average; this represents 20 days = days to weeks.
So now you know the theory, let’s look at the charts and draw our conclusion.
My thorough testing awarded TradingView a stellar 4.8 stars!
With powerful stock chart analysis, pattern recognition, screening, backtesting, and a 20+ million user community, it’s a game-changer for traders.

Whether you're trading in the US or internationally, TradingView is my top pick for its unmatched features and ease of use.
Explore TradingView – Your Gateway to Smarter Trading!
Long-term Uptrend & Downtrend Examples
In this example, we can see four distinct phases of a stock trend. Firstly, we observe the long-term downtrend as the stock market crashes. The price has been below the white 200-day moving average for an entire year.
Next, we can see that the price crosses through the white moving average indicators, meaning the market is now in an uptrend.
In the third phase, the stock price moves continuously up and down through the white moving average indicator; this means it is in a sideways consolidation.

Finally, the price moves strongly up through the moving average 200 indicator, confirming the start of a new long-term uptrend.
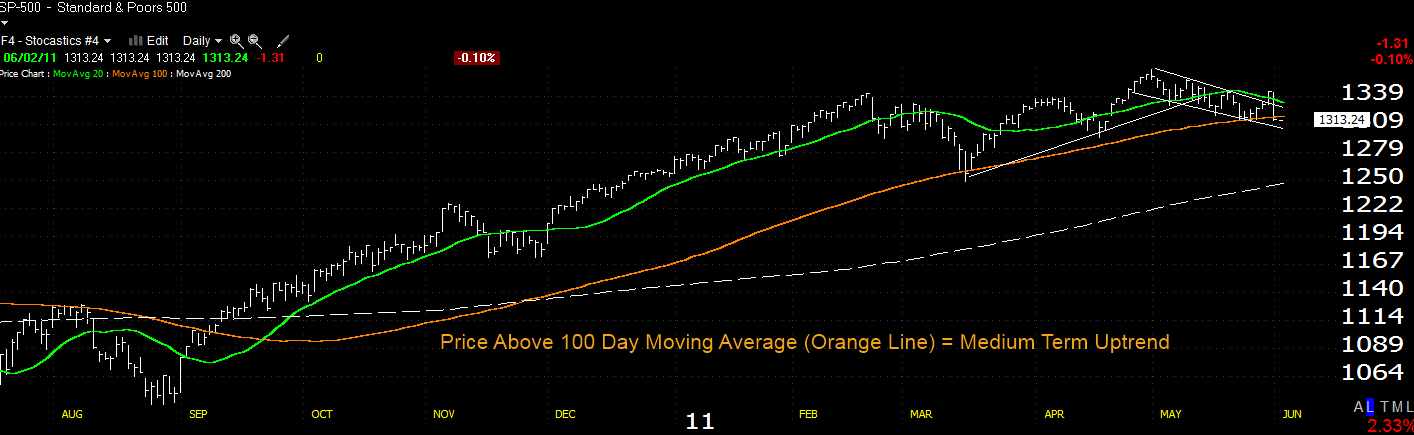
Medium-term Uptrend Example
In this example, we are looking at two years of stock price data. We can clearly see that the stock price moved above the orange 100-day moving average indicator in September. This means the stock is in a medium-term uptrend. It is also above the 200-day moving average and is in a long-term uptrend.
Short-term Uptrend Example
Using the 50-day moving average, we can observe six distinct uptrends and downtrends. Each is clearly visible when the stock price is above or below the green line.

You want to be a successful stock investor but don’t know where to start.
Learning stock market investing on your own can be overwhelming. There’s so much information out there, and it’s hard to know what’s true and what’s not.

Liberated Stock Trader Pro Investing Course
Our pro investing classes are the perfect way to learn stock investing. You will learn everything you need to know about financial analysis, charts, stock screening, and portfolio building so you can start building wealth today.
★ 16 Hours of Video Lessons + eBook ★
★ Complete Financial Analysis Lessons ★
★ 6 Proven Investing Strategies ★
★ Professional Grade Stock Chart Analysis Classes ★
5. How to Scan for Trending Stocks
Most stock analysis programs allow you to scan for trending stocks. You can use stock screening to filter all stocks above the 50-day moving average. Alternatively, you can filter for stocks making new all-time price highs.
How to Find Intraday Trending Stocks?
To find trending intraday stocks, you can use the 50, 100, and 200 moving average indicators. The chart time frame must be 1 minute or 5 minutes per bar.
Is the Stock Market in an Uptrend or Downtrend?
The stock market is in an uptrend if a broad market index like the S&P 500 or the Russell 2000 is above the 200-day moving average. If the price is below, it is in a downtrend.
Summary
There is a simple process for assessing the trend of any stock. Plot 3 moving average indicators with different lengths onto a stock chart. I suggest 50, 100, and 200-day moving averages. You can then easily visualize the stock’s trend and the period of that trend.
Also, do not forget short-term trends develop into medium-term trends, which can develop into long-term trends. Not that you understand stock trends using moving averages, but you may want to learn how to draw trendlines.
How Pro Investors Use Chart Trendlines to Make Better Trades
Final Thoughts
Now, you know how to categorize the market situation. You can confidently say this is a short-term uptrend, medium-term consolidation, or a long-term bear market down-trend. You can explain it to others and understand it for yourself, which helps you make improved investing decisions.
FAQ
What is the best software to detect stock trends?
The best software for automatically detecting trends is TrendSpider. TrendSpider uses algorithms to detect short, medium, and long-term trends on multiple timeframes and displays them on a single chart.
Is there a list of platforms that can detect trendlines and chart patterns?
Yes, our testing and research into automated trading platforms and pattern recognition software detail all the best tools for traders.
What is an uptrend and downtrend in the stock market?
In the stock market, an uptrend is any stock price continuing to make new highs over time. In a downtrend, a stock price makes new lows over a period. The length of the price move defines whether the uptrend or downtrend is a short, medium, or long-term trend.
What is a short-term trend in stocks?
A short-term trend in stocks is a price movement that lasts from days to weeks. For example, a stock may move up quickly over a few days and then decline again. Short-term trends can be identified using indicators such as technical analysis or a chart patterns.
What is a medium-term trend in stocks?
A medium-term trend is a price movement that lasts from weeks to months. Medium-term trends are longer than short-term trends and can be identified by looking at a daily chart.
What is a long-term trend in stocks?
A long-term trend in stocks is a price movement that lasts months to years. Long-term trends can be identified using higher time frames, such as weekly or monthly charts. Such long-term trends are usually more reliable than short-term ones but take longer to develop.
What is an uptrend in a stock chart?
An uptrend can be identified in a stock chart when the price consistently makes higher highs and higher lows. This means that each successive high point is higher than the preceding high, and each low point also increases in value, albeit less significantly.
What is a downtrend in a stock chart?
A downtrend can be identified in a stock chart when the price is making lower highs and lower lows consistently. This means that each successive high point is lower than the preceding high, and each low point is also decreasing in value, albeit less significantly.
What is sideways consolidation in stocks?
Sideways consolidation in a stock chart is the trading pattern that appears when a stock price is stuck in a narrow range over an extended period of time. This can be seen as a period of indecision, where neither bulls nor bears can control the trend.
How long does consolidation typically last?
The duration of consolidation can vary widely, ranging from a few days to several months. It depends on market conditions and the forces at play.
How do macroeconomic factors impact market trends?
Macroeconomic factors like inflation, interest rates, and global economic conditions can significantly influence market trends. Depending on their impact on investor sentiment, they can trigger shifts from uptrends to downtrends or vice versa.
What is the difference between short, medium, and long-term trends?
Short-term trends last a few days to weeks, medium-term trends last weeks to months, and long-term trends span several months to years.
What are the key indicators of a short-term trend?
Short-term trends are unpredictable, volatile price movements influenced by short-term news events or company announcements. They provide opportunities for active traders.
How do investors benefit from long-term trends?
Long-term trends offer the potential for substantial returns as they encompass larger market cycles and structural shifts. Investors can capitalize on long-term trends by identifying emerging industries and riding sustainable growth trajectories.
I am interested in stocks that have consolidated on the way up thereby possibly having a breakout to the upside.
Hi Terry, that is a very good idea, it means you are looking to trade the rectangle pattern. Research show the rectangle pattern has an 85% success rate in bull markets and an average profit potential of +50%. Find out how to detect and trade rectangles in this article. https://www.liberatedstocktrader.com/rectangle-chart-pattern/
For other chart patterns check out this category. https://www.liberatedstocktrader.com/category/stock-trading/technical-analysis/patterns/