Welcome to the stock market; it’s an exciting, emotional place where fortunes are created and destroyed. Done right, investing in stocks is an excellent wealth-creation engine.
Stock market beginners must understand exchanges, indexes, buy-and-hold, and diversification. Risks, rewards, and goals are key to a solid foundation. Finally, our proven charts, patterns, and indicators are the key to a good start in trading.
Why the Elite Stock Investing Starter Guide?
Updated annually, our Elite Stock Market Beginner’s Guide is different because it is based on tested and researched data. We have researched hundreds of charts, indicators, and patterns and know which ones work.
Additionally, we have tested all the best tools and software so we can recommend the best. Beginner investors should not waste time learning outdated techniques and using poor software and tools.
So join us on your maiden journey into stock market investing.
What is the Stock Market?
The stock market, in its most fundamental sense, is a marketplace. But instead of buying and selling goods or services, participants trade in shares of publicly traded companies. This concept can be likened to a bustling bazaar, where buyers and sellers meet, negotiate, and transact. However, the difference lies in what’s being traded – ownership stakes in businesses rather than physical products.
The Role of Stock Markets
At the heart of a stock market is a mechanism that allows investors to buy and sell stocks openly and transparently. This serves two important roles: first, it provides a platform for financial trading between buyers and sellers; second, it facilitates investment by providing purchasers with access to companies with the potential for strong growth and returns.
📈 Chart: 20 Years of Stock Market Returns
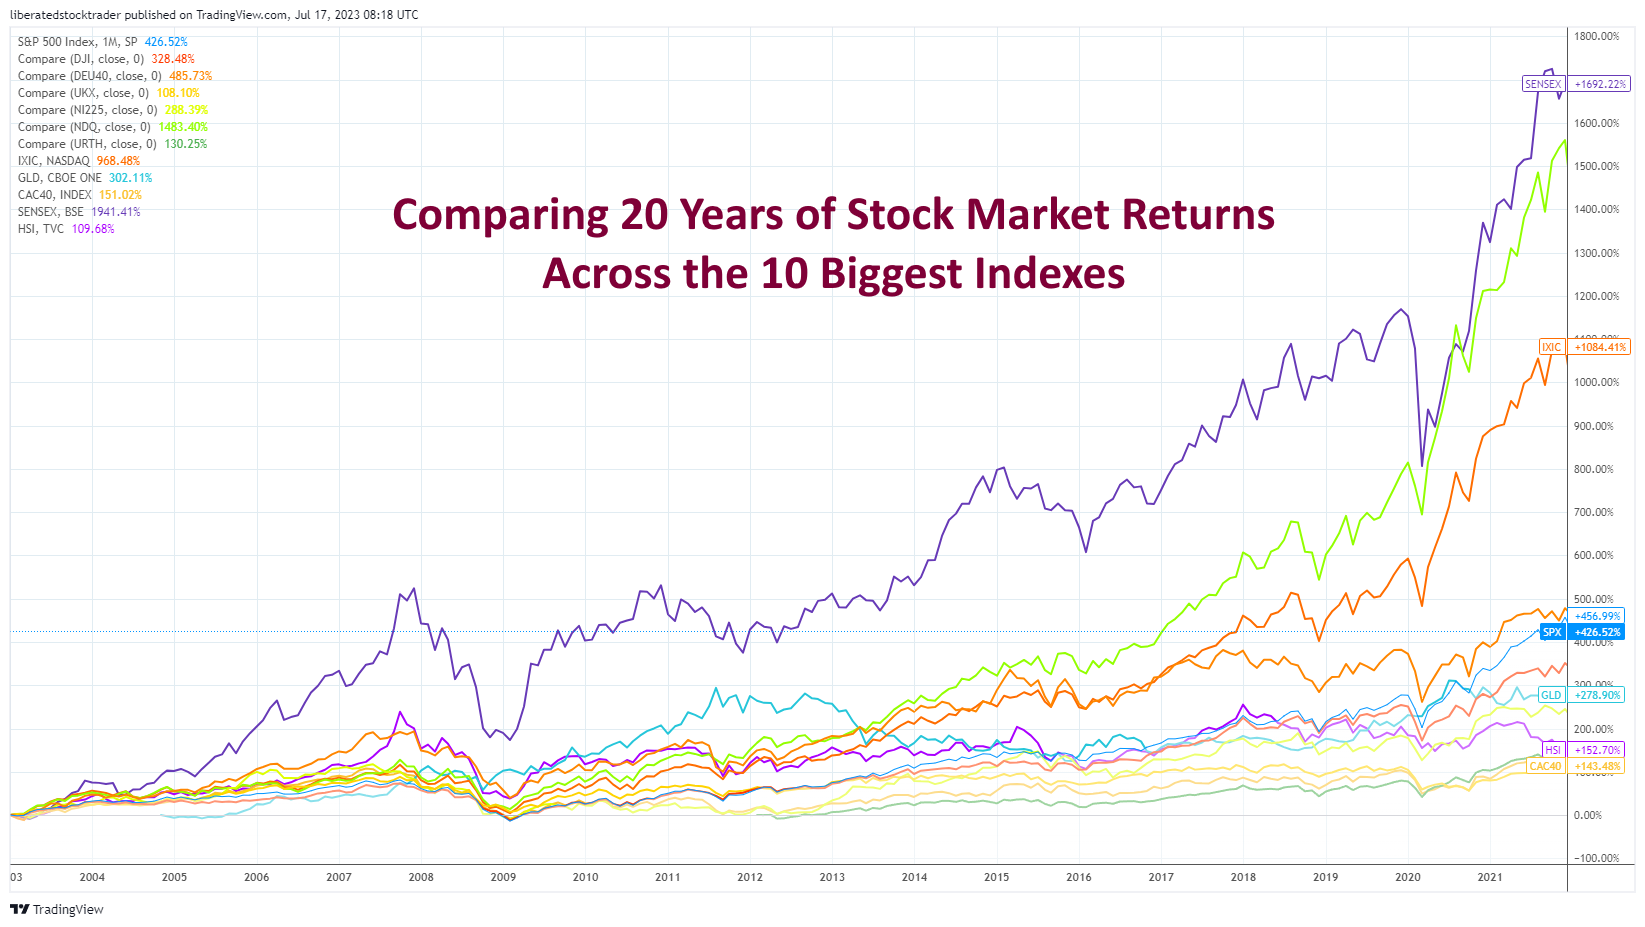
Get this chart free in TradingView
Stock markets also act as a barometer of economic activity. As investors become more optimistic about the economic prospects, they are generally willing to pay higher stock prices. Conversely, when investors are bearish, they tend to reduce their stockholdings and demand lower prices. This means that stock markets provide useful insight into the overall sentiment surrounding an economy and its outlook for the future.
- Facilitating Transactions: The primary role of the stock market is to facilitate the buying and selling of stocks, making it easier for investors to acquire or dispose of shares in a company.
- Setting Prices: The stock market helps determine the price of each share through the laws of supply and demand. When demand for a particular stock exceeds supply, the price rises. Conversely, if supply outstrips demand, prices may fall.
- Raising Capital for Businesses: Companies can raise funds for business expansion or debt repayment by listing their shares on a stock exchange. This process, known as an initial public offering (IPO), allows firms to sell a portion of their ownership to the public.
- Wealth Creation for Investors: Over time, the stock market has proven a powerful tool for wealth creation. Investors who buy shares in successful companies can earn profits through capital appreciation (when stock prices rise) and dividends (a portion of the company’s earnings distributed to shareholders).
It’s important to remember that while the stock market offers potential rewards, it also carries risks. Prices can fluctuate due to various factors, from company-specific news to broader economic trends. Therefore, understanding the stock market fundamentals and suitable investing strategies is crucial for navigating this dynamic landscape.
What are Stocks, Shares & Exchanges?
Stocks represent ownership in a company. When you buy a stock, you buy a small piece of that company. It’s like owning a part of a business without going to the office daily or worrying about the details of running it.
A share is just another name for stock. So, when you hear someone say they own shares in a company, they mean they own parts of that company’s stock. The more shares you have, the larger the portion of the company you own.
Exchanges are the places where stocks are bought and sold, kind of like a marketplace. You’ve probably heard of popular ones like the New York Stock Exchange (NYSE) or the Nasdaq. These exchanges act as a platform where buyers meet sellers. It’s done virtually – on computers rather than in a physical location.
Stock Exchange Examples
The two biggest stock exchanges are the New York Stock Exchange (NYSE) and the Nasdaq.
New York Stock Exchange (NYSE): This is like the main street of stock exchanges – one of the largest and most well-known in the world. It’s based in New York City, hence the name. Companies from all over the world want their stocks to be traded here. Some of the biggest and oldest companies, such as Coca-Cola, McDonald’s, and Walmart, are listed on the NYSE.
NASDAQ stands for the National Association of Securities Dealers Automated Quotations. That’s a mouthful. Simply put, it’s another big marketplace for buying and selling stocks. However, unlike the NYSE, NASDAQ is completely electronic—there’s no physical trading floor where transactions happen. It’s known for listing many tech companies, including giants like Apple, Amazon, and Google.
LSE: The London Stock Exchange is the oldest in the world. As its name suggests, it’s based in the United Kingdom and lists many British stocks. But companies from all over Europe are traded there too!
HKEX: Last but not least, we have Hong Kong Exchanges and Clearing Limited – abbreviated as HKEX. Asia’s largest stock market lists many companies from all over China. It’s an important hub in East Asia and trades stocks, bonds, commodities, derivatives, etc.
Think of these exchanges as different types of shopping centers. The NYSE might be more like a traditional mall with a mix of different stores (companies), while the NASDAQ is like an online marketplace specializing in tech gadgets. When you want to buy company shares, you’ll go to one of these ‘shopping centers,’ depending on where the company’s shares are being sold.
Why Invest in Stocks?
Investing in stocks offers a range of advantages, making it an attractive option for those who wish to build their wealth over time.
First and foremost, stocks have the potential to generate significant returns over the long term. Studies have shown that stock markets produce higher average annual returns than other investments, such as bonds or cash deposits. This means that with careful stock selection and a disciplined long-term approach, investors have the potential to grow their wealth.
In addition, many stocks pay dividends – regular payments made by companies to their shareholders. These distributions can provide an additional source of income for investors who hold onto their shares over time.
Owning stocks also gives investors a stake in successful companies with a strong track record of performance. As the fortunes of great companies rise, so too can shareholders’ profits and wealth.
For all these reasons, stocks present a compelling way for investors to make their money work smarter.
Misconceptions about Investing in Stocks
While stocks can provide substantial returns, many potential investors are deterred by common misconceptions and concerns, particularly risks and volatility.
One common misunderstanding is that investing in stocks is akin to gambling. However, this comparison is fundamentally flawed. Unlike gambling, which is based on pure chance, investing is about making informed decisions based on company performance, industry analysis, and economic indicators.
Another concern is the perceived high risk associated with stock investing. While risk is involved, strategies such as diversification—spreading investments across different sectors and stocks—can help manage and mitigate these risks.
The stock market’s volatility can also be a source of worry for potential investors. While it’s true that stock prices can fluctuate greatly in short periods, it’s important to remember that stock market investing should be viewed with a long-term perspective. Over the long haul, the overall trend of the stock market has historically been upward despite periods of volatility.
Finally, some people believe that stock investing is only for the wealthy. This is no longer true, especially with the advent of fractional shares and low or zero-commission trading platforms, which have made stock investing accessible to virtually everyone.
While investing in stocks carries certain risks and requires careful decision-making, these concerns should not deter potential investors willing to learn, diversify, and adopt a long-term perspective.
Setting Investment Goals
Setting clear investment goals is crucial in guiding your decision-making and overall investment strategy. These goals provide direction and purpose to your investments, ranging from saving for retirement and funding children’s education to purchasing a home or building an emergency fund.
The timeline for these goals can vary from short-term (less than three years) to medium-term (3-7 years) to long-term (more than seven years). Your goals’ nature and timeframe will directly influence your choice of investment vehicles. For example, if you’re saving for retirement 30 years later, you might choose higher-risk, higher-return investments such as stocks.
Conversely, safer, low-risk investments like bonds might be more suitable if you save for a down payment on a house you plan to buy within five years. By defining clear, time-bound goals, you can better tailor your investment strategy to meet your unique needs and circumstances.
Aligning Investment Goals with Risk Tolerance and Time Horizon
Aligning your investment goals with your risk tolerance and time horizon is crucial for creating a robust investment strategy. Here are some tips to help you with this:
1. Understand your risk tolerance
Your risk tolerance is your capacity to withstand losses in your investment portfolio without panicking. Each investor’s risk tolerance is unique and depends on their income level, financial situation, age, and personality. Understanding your risk tolerance will help you select the right investment vehicles.
2. Consider your time horizon
Your time horizon is the expected number of months, years, or decades you will invest to achieve a particular financial goal. Investors with a longer time horizon can generally afford to take on more risk because they have more time to recover from potential losses.
Diversify your portfolio: Diversification, or spreading your investments across various asset classes, can help balance risk and reward in your portfolio. This strategy can help to offset losses in one area with gains in another.
3. Regularly review and adjust your portfolio
It is important to review your portfolio periodically to ensure it remains aligned with your investment goals, risk tolerance, and time horizon. Life changes, such as marriage, having children, or nearing retirement, may require adjustments to your investment strategy.
4. Seek professional advice if needed
If you’re unsure how to align your goals with your risk tolerance and time horizon, consider seeking advice from a financial advisor. They can guide you toward an investment strategy that fits your circumstances and financial goals.
Understanding Risk and Return
No investment comes without risk, which is certainly true for stocks. To benefit from stock market returns, it’s important to understand the risks and rewards associated with investing in stocks.
First and foremost, stock prices can drop significantly over short periods. This is due to various factors such as changes in market conditions, company performance, international economic news, and more. As such, investors need to keep track of news related to their investments.
Additionally, stocks are more volatile than other types of investments, making it difficult to predict their performance. Investors need to understand that stock prices can fluctuate quickly and dramatically. Therefore, short-term gains or losses should not be the sole basis for deciding whether to buy or sell a particular stock.
Researching Stocks
Conducting thorough research before investing in specific stocks is crucial for informed decision-making and successful investing. This process, often called due diligence, involves examining a company’s financials, industry position, and market trends to assess its potential as a viable investment.
Understanding a company’s financial health, including analyzing its balance sheet, income statement, and cash flow, gives insight into its profitability, debt, and overall financial stability. Reviewing industry positions helps to determine the company’s competitive standing and potential for future growth.
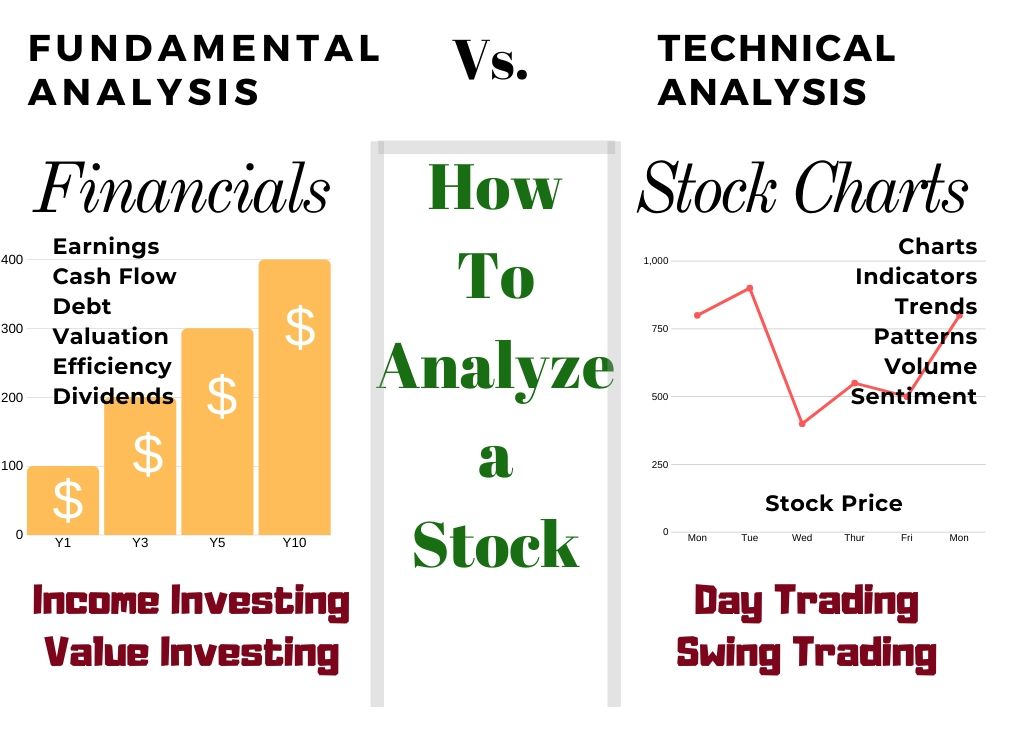
📈 Infographic: Fundamental vs. Technical Analysis
Moreover, staying abreast of market trends, including economic indicators and sector performance, can help predict future stock price movements.
By conducting extensive research, investors can mitigate risk, make more educated decisions, and potentially enjoy higher returns. This diligent approach is especially essential for long-term investment strategies, where the impact of initial stock selection can be profound.
Fundamental Analysis
Fundamental analysis of stocks involves assessing a company’s financial health. This process involves analyzing a company’s balance sheet, income statement, and cash flow to determine its profitability, debt levels, and overall stability. It also considers management structure, competitive landscape, and regulations. Through this approach, investors can understand the company’s strengths, weaknesses, and potential for future success.
Investing In Stocks Can Be Complicated, Stock Rover Makes It Easy.
Stock Rover is our #1 rated stock investing tool for:
★ Growth Investing - With industry Leading Research Reports ★
★ Value Investing - Find Value Stocks Using Warren Buffett's Strategies ★
★ Income Investing - Harvest Safe Regular Dividends from Stocks ★

"I have been researching and investing in stocks for 20 years! I now manage all my stock investments using Stock Rover." Barry D. Moore - Founder: LiberatedStockTrader.com
Technical Analysis
Technical analysis of stocks is based on studying the stock’s past price performance and trends to predict its future behavior. Technical analysts use indicators such as moving averages, volatility, momentum, relative strength index (RSI), and volume data to identify patterns that could influence future stock prices. By analyzing historical data, investors can gain insights into the stock’s current market value and potential for future growth.
Whether you use fundamental or technical analysis, it is important to remember that no one can predict stock prices with 100% certainty, and there are always risks associated with investing in stocks. As such, conducting thorough research before making any investment decisions is essential.
▶️ Video: How to Analyze Stock for Beginners
Reliable Tools For Beginner Investors
For novice investors, gaining reliable insights is key to making informed decisions. These tools can provide a wealth of timely and relevant information:
TradingView
TradingView is the biggest global social network for traders and investors. It provides real-time data and browser-based charts. With its wide range of technical analysis tools, users can track market trends and make well-informed trading decisions.
Try TradingView, Our Recommended Tool for International Traders
Global Community, Charts, Screening, Analysis & Broker Integration

Global Financial Analysis for Free on TradingView
Stock Rover
Stock Rover is a comprehensive research platform that offers detailed financial data, analytics, and powerful screening tools. With its in-depth research capabilities, investors can thoroughly analyze stocks, compare them with peers, and make data-driven decisions.
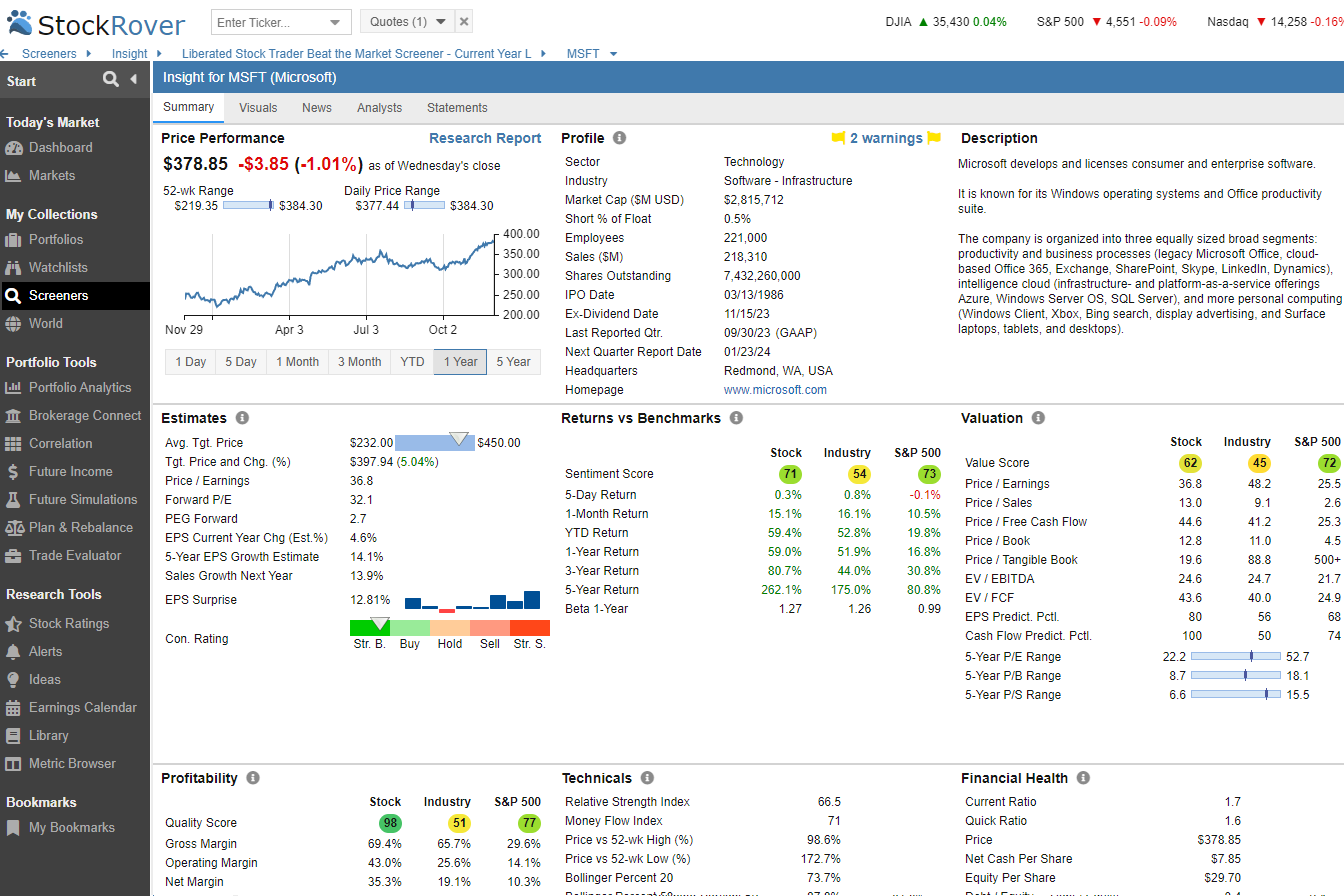
Try Powerful Financial Analysis & Research with Stock Rover
Stock Rover’s Screening & Portfolio Tools Full Test & Rating
TrendSpider
An automated technical analysis platform, TrendSpider helps traders identify opportunities and make informed decisions. It offers advanced charting tools with a wide range of indicators and actionable alerts that keep users up-to-date on the latest market trends.
My thorough testing awarded TradingView a stellar 4.8 stars!
With powerful stock chart analysis, pattern recognition, screening, backtesting, and a 20+ million user community, it’s a game-changer for traders.

Whether you're trading in the US or internationally, TradingView is my top pick for its unmatched features and ease of use.
Explore TradingView – Your Gateway to Smarter Trading!
Benzinga Pro News
Benzinga is a real-time news platform that caters to traders and investors with various resources. It offers actionable trading ideas, market analysis, and company news, keeping investors updated on the latest trends and events.
By leveraging these tools, beginner investors can stay informed about the stock market, track performance, and make educated decisions. Reliable resources such as these can also help novice investors become more comfortable with stock trading and maximize their returns.
Investing Strategies for Beginners
There are several investment strategies that novice investors can consider to get started in the world of stocks, including dollar cost averaging, buy-and-hold-investing, diversification, and more:
Dollar-cost averaging (DCA)
This strategy involves investing a fixed amount of money in a specific stock or portfolio at regular intervals, regardless of the stock’s price. Over time, DCA can potentially reduce the impact of volatility on the overall purchase price of the investment.
Buy and Hold
As the name suggests, buy-and-hold is a long-term strategy that involves buying stocks and holding onto them for an extended period, regardless of market fluctuations. This strategy is based on the belief that, in the long run, financial markets will give a good rate of return despite periods of volatility or decline.
Diversification
A diversification strategy involves spreading investments across various types of assets or asset classes to reduce risk. By having a mix of stocks, bonds, and other investments, investors can buffer against potential losses.
Value Investing
A value investing strategy involves buying stocks that appear underpriced based on some fundamental analysis. The underlying idea is that the market overreacts to good and bad news, resulting in stock price movements that do not correspond to a company’s long-term fundamentals.
Building the Best Buffett Stock Screener for Value Investing
Growth Investing
A growth investing strategy involves investing in companies expected to grow at an above-average rate compared to other companies in the market. This strategy often involves investing in young companies with high-growth potential.
Dividend Investing
A dividend strategy involves buying stocks with a steady stream of dividend payments. These dividends can help offset the volatility’s impact on the stock price or reinvest for long-term growth.
Each strategy has its own set of risks and rewards, and it’s crucial for beginners to understand these before deciding on the right one. Typically, a combination of these strategies can help balance risk and reward.
Stock Trading Techniques for Beginners
Once you’ve selected the best strategy for your goals, it’s time to learn about some of the most popular stock trading techniques. These can help you take advantage of short-term opportunities or reduce risk from long-term investments.
Understanding Stock Charts and Patterns
As a novice investor, getting acquainted with the visual language of stock trading can significantly aid in making informed decisions. Let’s delve into some key concepts:
Stock Charts
Stock charts represent price and volume information in a graphical format, making it easier to visualize a stock’s performance over time. The most common types of stock charts are line, bar, and candlestick charts.
Line charts are the simplest form of stock chart and only display the closing price of a stock for each period.
▶️ Video: Stock Charts
Bar and candlestick charts provide detailed information about a stock’s high, low, opening, and closing prices. The difference lies in their visual representation. In a bar chart, a single bar represents a whole trading period, with the top and bottom showing the high and low prices and the horizontal lines on either side representing opening and closing prices.
On the other hand, Candlestick charts use rectangular bars or “candles” to represent price movements. The candle’s body represents the range between the opening and closing prices, and the “wicks” represent the highest and lowest prices during the trading period. A filled (or colored) candle indicates a closing price lower than the opening price, while an empty (or uncolored) candle indicates a higher closing price.
Chart Patterns
Chart patterns are specific formations created by price movements on a stock chart. They are essential tools in technical analysis to predict future price movements. Common patterns include the ‘head and shoulders,’ ‘double bottom,’ and ‘cup and handle,’ each having its predictive value.
▶️Video: Bullish Chart Patterns
Candlestick Patterns
Candlestick patterns are patterns formed by one or more candlesticks on a chart. They can help investors understand market sentiments and anticipate possible future price movements. Some common candlestick patterns include ‘doji,’ ‘hammer,’ ‘bullish and bearish engulfing,’ etc.
▶️Video: Profitable Candlestick Patterns
Stock Chart Indicators
Stock chart indicators are calculations plotted as lines on a stock chart to predict future price movements. They can provide information about trends, volatility, momentum, and the strength of a stock’s price movement. Common indicators include moving averages, relative strength index (RSI), moving average convergence divergence (MACD), and Bollinger Bands.
11 Accurate Day Trading Indicators Tested & Proven with Data
The key is to understand that these charts and patterns are tools to help inform your decisions. They are not foolproof and should not be the only resources you rely on when investing. Always conduct thorough research and consider the fundamental aspects of a stock before investing.
▶️Video: 10 Best Free Chart Indicators for Beginners
Conclusion
In conclusion, this article has provided insights into several aspects of investing for beginners. We began by emphasizing the importance of understanding the fundamentals of the stock market, including the key terminologies. Subsequently, we introduced reliable resources to help novice investors track market trends, evaluate stock performance, and make educated decisions.
While this article has provided a solid foundation to begin your journey into the stock market, continuous learning is key to becoming a successful investor. It’s a dynamic world, with trends shifting and new strategies evolving. Therefore, it’s essential to stay updated and keep enriching your knowledge.
Consider taking a course like the Liberated Stock Trader Pro training program. This comprehensive course is designed to take you through the nitty-gritty of investing, equipping you with the knowledge and confidence to navigate the stock market effectively. It covers a wide range of topics, including understanding financial statements, selecting winning stocks, and managing risks. Embarking on this course could be your next significant step toward becoming a savvy investor.
Remember, every expert investor started as a beginner. The key is taking that first step, staying committed, and always learning. Happy investing!
FAQ
What is the best free software for novice investors?
The best free software for those new to the stock market is Stock Rover for people wanting to invest long-term or TradingView for those wanting to swing trade stocks.
Is there a list of free charting tools for beginner stock market investors?
Yes, our testing and research into free stock charting tools cover everything a beginner investor or trader might need.
What is stock market investing?
Stock market investing involves buying shares of a company with the hope that they will increase in value over time. You become a part-owner of the company and can benefit from its success.
Why should I invest in the stock market?
Investing in the stock market can help you grow your wealth over time. It's a way to potentially earn more money than you might get from keeping it in a savings account.
How do I start investing in stocks?
You can start by opening a brokerage account, which is like a special bank account where you can buy and sell stocks. There are many online brokerage platforms available today.
What is a stock?
A stock represents a share of ownership in a company. When you buy a stock, you buy a small piece of that company.
What's a stock exchange?
A stock exchange is a marketplace where stocks are bought and sold. Examples include the New York Stock Exchange (NYSE) and NASDAQ.
How much money do I need to start investing?
There's no set amount needed to start investing. Some online brokers even allow you to buy fractional shares, meaning you can start with a few dollars.
What is a brokerage account?
A brokerage account is an account you open with a brokerage firm to buy and sell stocks, bonds, mutual funds, and other investment products.
What are dividends?
Dividends are a portion of a company's profits paid to shareholders. Not all companies pay dividends, but those that do provide another way for investors to earn money.
What is a mutual fund?
A mutual fund is a type of investment that pools money from many investors to buy a diversified mix of stocks, bonds, or other assets.
What is a bond?
A bond is a type of investment where you loan your money to a government or company for a certain period. In return, they promise to pay you interest and return your money at the end of the period.
What is risk tolerance?
Risk tolerance refers to how much financial risk you're comfortable taking with your investments. It can depend on factors like your financial goals, timeline, and personality.
What are ETFs?
Exchange-Traded Funds (ETFs) are investment funds that trade on a stock exchange. They can track an index, sector, commodity, or basket of assets.
What is a portfolio?
A portfolio is a collection of all your investments, including stocks, bonds, mutual funds, ETFs, and other assets.
What does diversification mean?
Diversification is a strategy to spread your investments across different types of assets to reduce risk. It's like the saying, "Don't put all your eggs in one basket."
What is a stock split?
A stock split happens when a company decides to increase the number of its shares by dividing its existing shares. It doesn't change the company's overall value, just the number and price of individual shares.