Six waves and cycles influence how our economies, businesses, and financial markets expand and contract.
The Kondratieff Wave, Kuznets Cycle, Juglar Cycle, Business Cycle, Presidential Cycle, and Seasonal Cycle will change how you see the world.
Though the business world may seem mysterious, grasping economic cycles is crucial to unlocking success across industries. By studying business and economic cycles, we can discern trends and foresee market changes, allowing us to make more informed financial decisions for our businesses or portfolios.
The most well-known business cycle model is the four-stage recession, recovery, growth, and decline model. However, other models include different stages, such as inflation, expansion, peak production, troughs of production levels, a deflationary phase, and recovery. Each stage affects different parts of the population: large corporations, small businesses, and individual consumers.
Paying attention to the macroeconomic indicators that signal each cycle phase is important, no matter what industry you’re in or which type of cycle you’re studying. With an understanding of these signals and how they interact, you can learn when to buy low or sell high—and maximize your profits while minimizing risks.

The 6 Waves That Explain Economic Activity
Over the past 200 years, much has been written about cycles; some are very useful, and some do not apply to trading success. Cycles are evident in the form of the Earth’s rotation (days), the Earth’s rotation around the Sun (years), the Moon’s rotation around the Earth (tides), the seasons, animal migration, and solar activity. Some traders believe natural cycles affect the market.
In some ways, they do; for example, Weather cycles can affect crop output, which can affect commodity prices, which in turn affect a company’s stock price, which is dependent on the commodity. However, can other cycles be measured for the more general stock market activity?
The effect of cycles on the economy, marketplace, and business is clear- We will examine the theory of cycles and how we can apply them to improve our understanding of market fluctuations and major moves. This will, in turn, enable us to make better trading decisions.
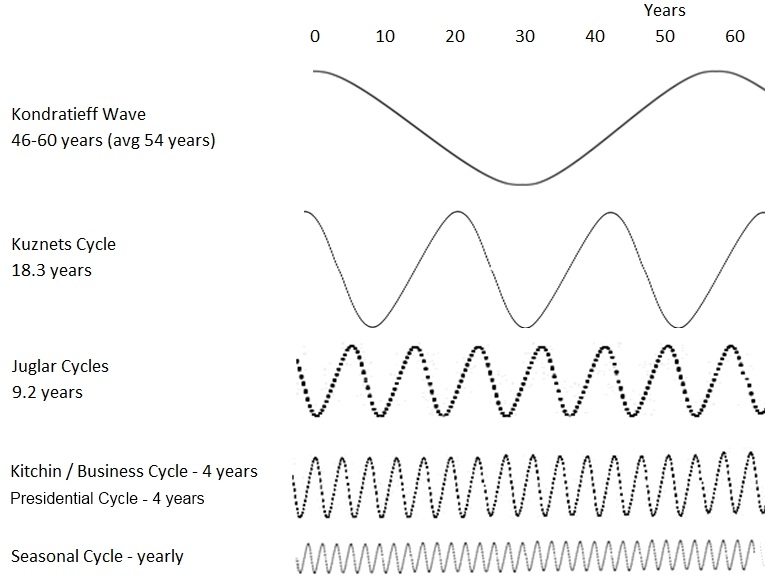
Stock Market Cycles & Waves Chart

1. Kondratieff Wave
The Kondratieff Wave is a theory proposed by Russian economist Nikolai Kondratieff in the 1920s. It states that the economy undergoes long-term (50-60 year) cycles, alternating periods of high growth and recession. During high growth, businesses invest heavily in production and commercial structures. This leads to increased wages, employment opportunities, and higher profits for businesses.
This cycle is followed by a period of recession, where businesses respond to falling demand by cutting costs, resulting in decreased wages and higher unemployment.
The Kondratieff Wave has been used to explain major economic events, such as the Great Depression of 1929, and some economists have argued that it can be used to predict future market trends. Some traders use this theory to time their investment decisions, believing that they can identify when a certain sector or market is set to experience a downturn or an upturn based on this long-term cycle theory.
Whether or not this theory is used for time investments, it provides an interesting perspective on economic growth and recession cycles.
It is important to note that the Kondratieff Wave is just a theory, and there are no guarantees that it will accurately predict future market trends. Nevertheless, by understanding this concept, traders can gain valuable insights into how
The Kondratieff wave measures between 46 and 60 years with a periodicity of 54 years. Based on Wholesale Prices in the US in the 1800s, this phenomenon has been mapped from the 1800s through today. The last trough was in 1940, and the prediction for a trough in 2000 seemed correct.
However, to see if this cycle theory proves correct again, we will have to wait for another 40 to 50 years. Another question is how actionable this data is. Normally, statistical data proves a trend/theory after 12 to 16 data points, which we certainly do not have here. Also, this theory is quite controversial in economists’ annals.
Try TradingView, Our Recommended Tool for International Traders
Global Community, Charts, Screening, Analysis & Broker Integration

Global Financial Analysis for Free on TradingView
2. The Kuznets Cycle
The Kuznets Cycle is an economic theory proposed by Nobel laureate and economist Simon Kuznets. It states that economic growth follows a U-shaped path, with a dip in the rate followed by a rise over time.
This cycle has two distinct phases. The first phase, the “trough” phase, is characterized by stagnant economic activity and low economic growth. The second cycle stage, known as the “peak” phase, is marked by higher levels of economic activity and robust economic growth.

Although economists have widely accepted this theory, it has received criticism for not considering other factors, such as population growth or technological advancements, which can also affect economic output. In addition, it is important to note that the U-shape of economic growth does not necessarily guarantee that an economy will experience a sustained period of growth.
It is also possible for economies to move in cycles with alternating periods of growth and contraction. For example, during times of recession, economic activity can decline even when other factors, such as population growth or
New research has challenged the U-shaped path of economic growth in recent years. This research suggests that economic growth will likely follow an S-shaped trajectory. This conflicting theory proposes a gradual increase in economic activity over time instead of cyclical troughs and peaks. This implies that long-term sustainable economic growth can be achieved
3. Juglar Cycle
The Juglar cycle is a theory of economic activity that posits that alternating periods of growth and contraction occur over seven to 11 years. The cycle is named after Clément Juglar, the first economist to identify the phenomenon in 1862.
A pattern of booms and busts characterizes jugular cycles. During the boom stage, economic activity increases as businesses expand production and consumption rises due to increased purchasing power. This leads to higher profits for companies and lower prices for consumers. During the bust stage, however, the opposite occurs as businesses cut back their production and consumption falls due to reduced purchasing power. This causes a decline in profits for companies and higher prices for consumers.
The Juglar cycle has been used to explain both short-term and long-term fluctuations in economic activity. For example, it can explain why some economies experience boom years followed by recessionary periods or vice versa. It can also explain why some countries experience sustained periods of economic growth while others falter after initial bursts of growth.
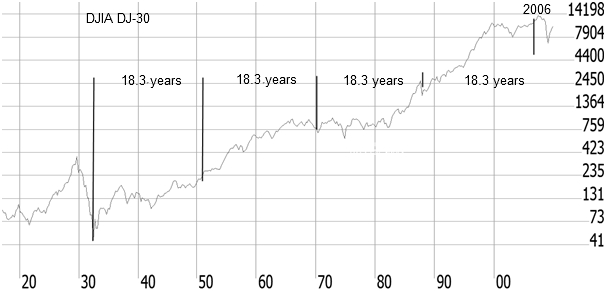
The Juglar cycle is approximately half the 18.3-year cycle at 9.2, fluctuating between 7 and 11 years. This highlights the concept of nominality, meaning each larger wave detected seems twice the size of the next smaller wave. The Juglar cycle is similar in wavelength to the 10-year “stock market cycle.”
4. Kitchin/Business Cycle
The Kitchin/Business Cycle is a short-term economic cycle that usually lasts between 3 and 5 years. It is characterized by periods of expansion, contraction, and stabilization. During the expansion phase, production and employment increase across all sectors of the economy. During the contraction phase, production levels and employment begin to decline. Finally, during the stabilization phase, production levels reach their original pre-expansion level, accompanied by increased employment rates.
The Kitchin cycle does not necessarily follow the Juglar cycle in terms of timing. However, it has been observed that the Kitchin cycle frequency increases when the Juglar wave increases. This is because increased investment during a Juglar wave can often lead to an increase in short-term economic activity as businesses capitalize on new opportunities or take advantage of lower costs associated with certain inputs such as labor or capital goods.
My thorough testing awarded TradingView a stellar 4.8 stars!
With powerful stock chart analysis, pattern recognition, screening, backtesting, and a 20+ million user community, it’s a game-changer for traders.

Whether you're trading in the US or internationally, TradingView is my top pick for its unmatched features and ease of use.
Explore TradingView – Your Gateway to Smarter Trading!
5. Presidential Cycle
The Presidential Cycle is an economic theory that states there are cyclical patterns in the performance of a nation’s economy based on the political party in power. It suggests that government policies such as increased spending and lower taxes are implemented during election years to stimulate economic growth. This leads to higher GDP growth rates and stock market returns during pre-election years, while post-election years experience slower economic growth and lower stock market returns. This theory has been widely debated, but it remains a popular tool for investors looking to identify potential economic or market patterns.
Which political parties run the economy better?
According to our analysis, the Republican party has seen more job growth since World War II, but Democrats have had higher GDP growth. In addition, the stock market has fared better under Democratic presidents than Republican presidents, with an average total return of 13.5% versus 10.9%. However, regarding the unemployment rate, Democrats have typically been more successful in reducing unemployment during their terms in office.
Overall, both parties have seen successes in different areas of economic performance since WWII. It is difficult to conclude which party has been most successful in economic terms without considering political biases or understanding the economic policies adopted by each administration.
6. Seasonal Cycle
The seasonal cycle of the economy generally follows a predictable pattern year after year. In most cases, economic activity and stock market performance peak in the latter half of the year, around September or October. This is usually followed by a relatively slow period towards the end of the year, as consumers spend less during the holiday season.
However, this is not always true for all industries and stocks. Some sectors tend to do better than others, depending on what part of the annual cycle they are in. For example, retailers tend to benefit from increased consumer spending during the holiday season, while energy companies may experience lower demand during warmer months when people use less electricity or gas.
In addition to sector-specific trends, investors should consider macroeconomic factors such as GDP growth and inflationary pressures to gauge how different economic cycles will impact their investments. By considering these variables, investors can decide which stocks or industries are best positioned to take advantage of seasonal conditions and generate higher returns.
Final Thoughts
The Kondratieff Wave is a long-term economic cycle of 50-60 years, characterized by alternating high and low growth. The Kuznets Cycle, lasting 20-30 years, explains changes in inequality over time. The Juglar Cycle lasts 7-11 years and consists of expansion, recession, and revival. The Business Cycle has four stages: expansion, peak, contraction, and trough. The Presidential Cycle refers to stock market fluctuations every four years with a new president—lastly, the Seasonal Cycle accounts for annual trends in stocks or industries.
Understanding these cycles can help you make more informed investment decisions. If you want more, try our professional investing training.
You want to be a successful stock investor but don’t know where to start.
Learning stock market investing on your own can be overwhelming. There’s so much information out there, and it’s hard to know what’s true and what’s not.
Liberated Stock Trader Pro Investing Course
Our pro investing classes are the perfect way to learn stock investing. You will learn everything you need to know about financial analysis, charts, stock screening, and portfolio building so you can start building wealth today.
★ 16 Hours of Video Lessons + eBook ★
★ Complete Financial Analysis Lessons ★
★ 6 Proven Investing Strategies ★
★ Professional Grade Stock Chart Analysis Classes ★


You really make it seem really easy with your presentation but I find this topic to be really something which I feel I might never understand. It sort of feels too complex and very huge for me. I’m taking a look forward for your subsequent submit, I will try to get the hold of it!
Thanks dude, this is extremely helpful info, thankyou.