A bullish engulfing candle formation in technical analysis is a bullish reversal pattern. It occurs when a small black candlestick is followed by a larger white candlestick that completely engulfs the previous day’s candle.
It indicates that buyers have taken control of the market and are pushing prices higher.
Most mainstream websites consider the bullish engulfing pattern to be one of the most reliable and powerful signals in technical analysis. But they are wrong!
My research shows the Bullish Engulfing candle is not as profitable as most traders believe. Based on 568 years of data, it has a 55% success rate and an average win of 3.5%.
How can we effectively trade the Bullish Engulfing profitability? To find the truth, I tested 3,735 Bullish Engulfing trades.
RESEARCH SUMMARY
- The Bullish Engulfing is not a high-performing candle, but it is relatively reliable, with a win rate of 55%.
- The Bullish Engulfing pattern predicts a bullish move with 55% accuracy.
- The profit per trade is 0.46%, 10% lower than the 0.51% performance of the average candlestick we tested.
- Our testing suggests the Bullish Engulfing is the 13th most profitable candle pattern.
Prepare to master trading the Bullish Engulfing pattern with solid, data-driven insights!
What Is a Bullish Engulfing Candle?
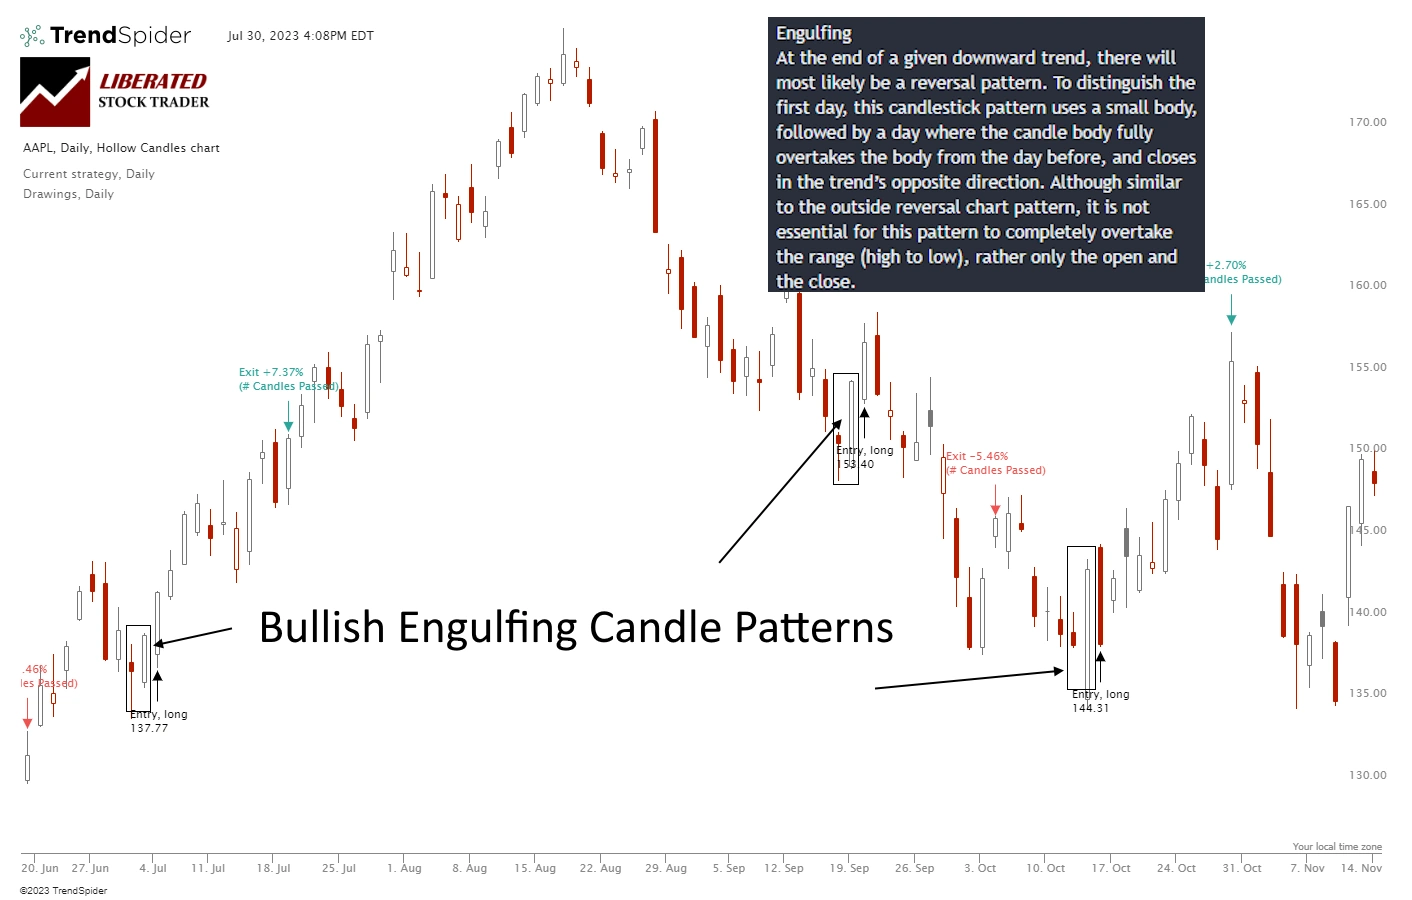
A Bullish Engulfing pattern has two candles in technical analysis. It is characterized by a small bearish (red) candle, followed by a long (green) “engulfing” candlestick. The opening price of the Bullish Engulfing candle is typically lower than the previous day’s close, and its closing price is much higher than the previous day’s open, thus entirely encompassing or “engulfing” the body of the first candle.
This pattern indicates that the buying pressure has surpassed the previous day’s selling pressure, suggesting a shift in market sentiment.
Although a lesser-known pattern in Japanese candlestick analysis, does the Bullish Engulfing candle deserve greater recognition among traders? Based on our extensive testing, perhaps not.
What Does a Bullish Engulfing Candle Mean?
When a Bullish Engulfing candle materializes in the market, it often displays distinct characteristics that indicate a potential transition from a bearish trend to a bullish one.
- Bearish Trend: Before the formation of the Bullish Engulfing candle, the market experiences a downtrend characterized by a series of lower lows and lower highs. Sellers dominate the market sentiment, pushing prices lower.
- Bearish Candlestick: The formation starts with a smaller bearish candlestick, representing selling pressure. This candlestick signifies the continuation of the prevailing downtrend.
- Bullish Candlestick: Following the bearish candlestick, a larger bullish candlestick emerges. It engulfs the entire body of the previous candlestick, indicating a dramatic shift in market sentiment and a potential reversal.
- Buying Pressure: The bullish candlestick shows increased buying pressure, overpowering the selling pressure seen in the preceding candlestick. This surge in buying volume suggests that bulls are gaining control over the market, leading to a price increase.
The formation of a Bullish Engulfing candle suggests buyers have taken control and that a bullish trend may follow. Traders often view this pattern as a signal to consider taking long positions.
But is this a correct assumption?
Traders believe this pattern signifies buyers are gaining momentum against sellers, heralding a potential bullish trend. Our decades of research suggest this theory is correct. Interestingly, the Bullish Engulfing pattern is much less bullish than the Bearish Engulfing pattern.
TrendSpider 4.8/5⭐: My Pick for AI-Power & Auto-Trading
I’ve used TrendSpider for 7 years for my research and testing. It auto-detects trendlines, patterns, and candlesticks, backtests ideas, and lets you use AI to create unique strategies and launch trading bots—with no code.

Save 38% on TrendSpider
Our Top Rated 4.72 ⭐ Trading Tool
✅ Leader in AI Trading & Chart Pattern Recognition
✅ Scanning & Auto-Trading
Deal Ends In:
Types of Engulfing Candle
There are two types of Engulfing candles: Bullish Engulfing and Bearish Engulfing. The Bullish Engulfing is one of the poorest-performing candlestick patterns we have tested, with a 0.46% profit per trade. However, the Bearish Engulfing is the opposite; it is the fourth-best candlestick pattern with a high win rate and profit per trade.
Bullish Engulfing Candles Explained By Data
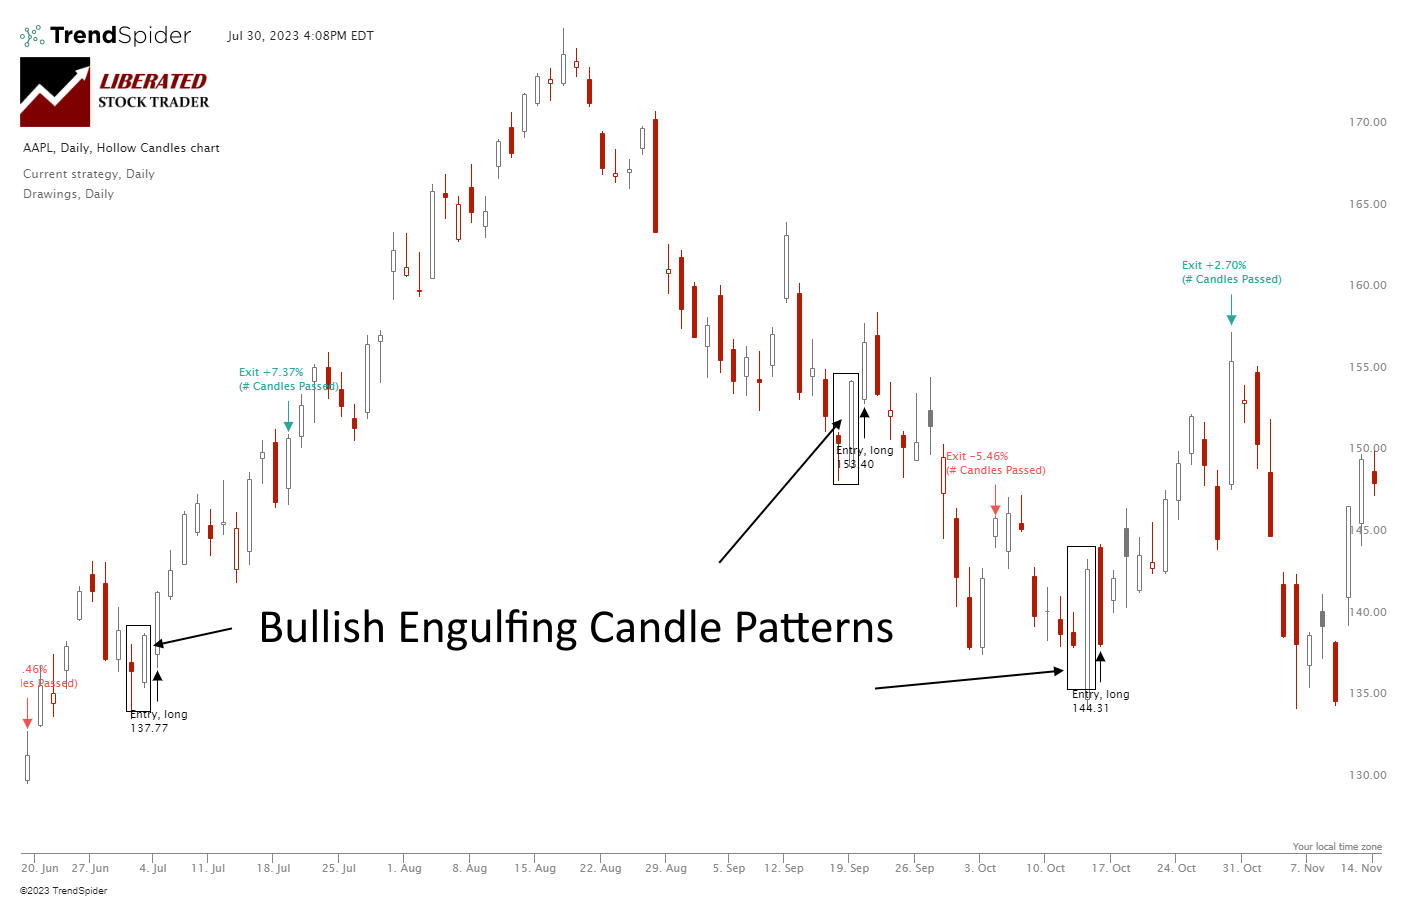
The data suggests a Bullish Engulfing candle can occur during an uptrend or downtrend and can be a reversal or continuation pattern. The image below shows three Bullish Engulfing candles; two occur during a downtrend, thus accelerating the price decline, and one occurs during an uptrend, signifying a reversal.
The data does not support the theory touted by mainstream financial publications that the Bullish Engulfing candle is a reversal pattern. 55% of Bullish Engulfing candles produce a 3.7% profit over the next 10 days. This also means that 43% of the time, it produces a -3.3% loss or a -3.3% gain if you short the trade.
Candle Pattern Recognition with TrendSpider
Our testing shows the Bullish Engulfing candle indicates bullish sentiment but results in weak bullish moves over the next 10 trading days.
The Psychology of the Bullish Engulfing Candle
The psychology of the Bullish Engulfing candle is that sellers are pessimistic and push prices down during the first day. On the second day, prices exploded higher due to extreme optimism, as shown in the long green bullish candle.
This hugely positive trading day shifts the momentum because the buying pressure has been exhausted, and a short-term downside reversal might be coming. The Bullish Engulfing candle, therefore, represents a battle that leads to upside price exhaustion, signaling consolidation.
How to Trade a Bullish Engulfing Based on Data
When trading Bullish Engulfing candles, it is important to wait for the next day’s open and observe the price direction before making a trade. Our tests show that a bullish engulfing candle has a 55% chance of a 3.7% profit over the next 10 days. If you improve your entry and wait for confirmation before trading, you can increase this profitability.
While the Bullish Engulfing signifies a bullish end to the trading day, this does not guarantee the next day will be positive; it suggests that 55% of the time, the next 10 days will be a bullish uptrend.
Trading the Bullish Engulfing: Apple Inc. 20-Year Test
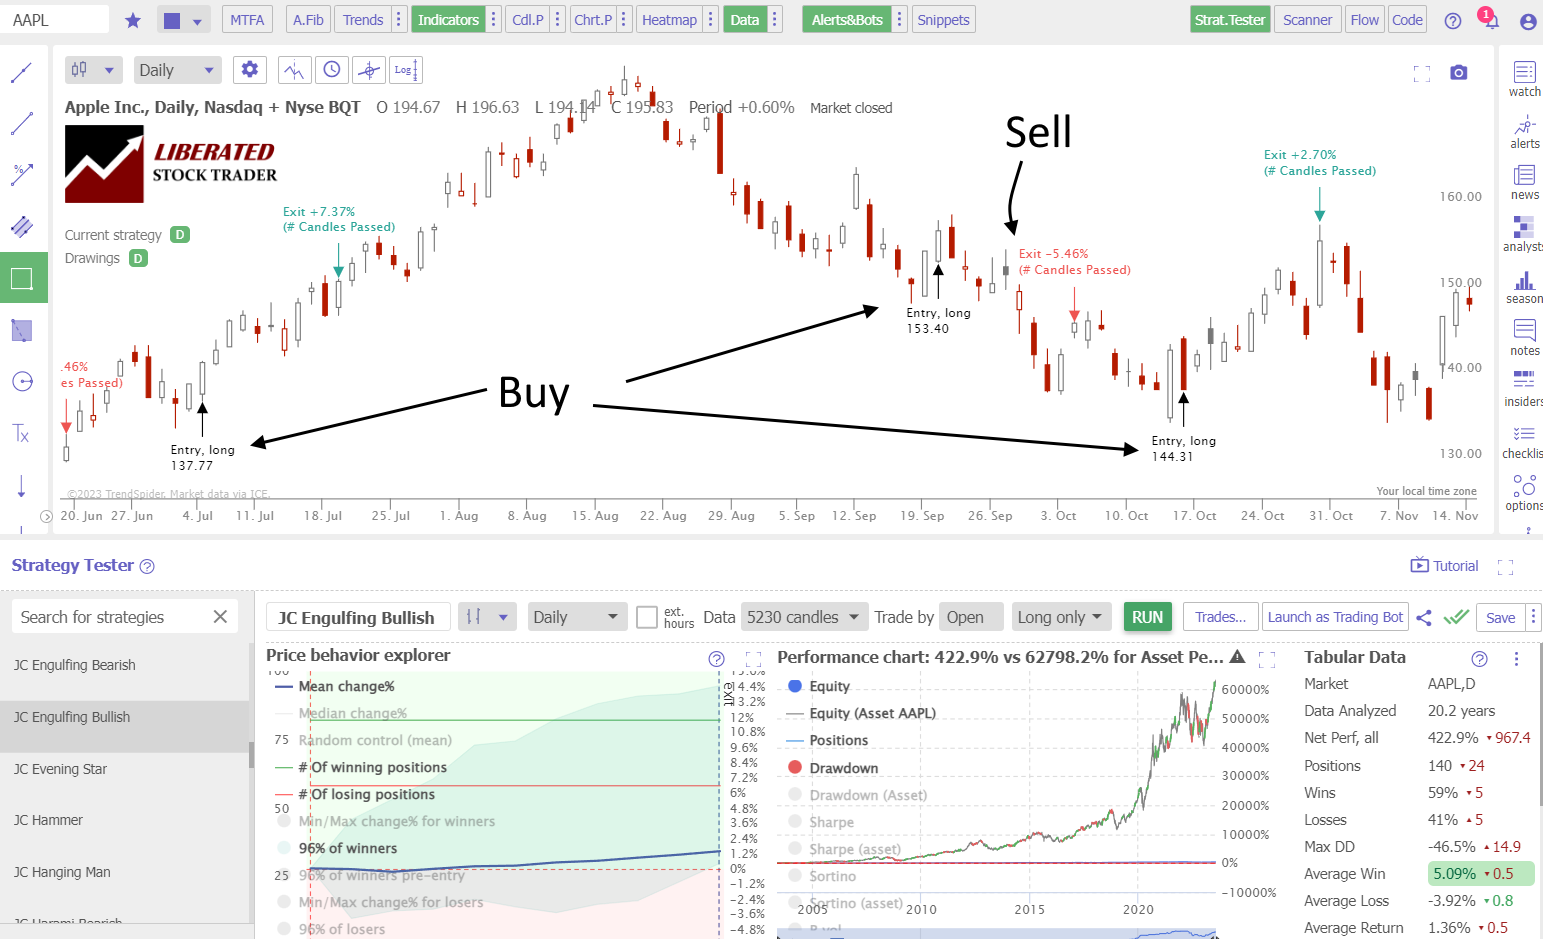
Our backtesting data on Apple Inc. (below) shows three trades in Apple Inc. Each trade was 10 days long, and the results were +7.37%, -5.46% and +2.7%. Here, you can see the Bullish Engulfing candles acted as a continuation and reversal of the prevailing trends.
Thanks to TrendSpider’s strategy tester, we can see Bullish Engulfing’s 59% win rate and profit of 5.09% per winning trade. The average gain across all winning and losing trades was 1.36%, which is good.
This also demonstrates that what asset you trade (Apple Inc.) is just as important as how you trade (chart indicators or patterns). Apple Inc.’s long-term profitability is significantly higher than that of other stocks.
Auto-Trade Candles with TrendSpider
Enhancing a Bullish Engulfing Trading Strategy
If you’re using the Bullish Engulfing trading strategy, it is beneficial to use trustworthy companion indicators such as the Relative Strength Index (RSI), Rate of Change (ROC), VWAP, or Weighted Moving Average. Utilizing these techniques can improve your trading strategy’s overall quality and efficiency. It’s important to test this out for yourself, ideally with the help of TrendSpider.
Our Bullish Engulfing Candle Testing
Using TrendSpider, I tested 30 Dow Jones Industrial stocks over 20 years. This amounted to 3,735 Bullish Engulfing trades and 568 years of data. The Bullish Engulfing candle must be fully formed to enter a trade, and the buy signal must be executed on the next trading day’s open price. Each trade was exited at the open exactly ten days later.
Candle Testing Methodology:
- Pattern: Bullish Engulfing
- 30 DJIA Stocks
- Daily Chart
- Strategy: Buy Long
- Test Period: 2003 to 2023
- Buy at the next open
- Exit after 10 days
- Pattern Recognition performed by TrendSpider
Backtesting the Bullish Engulfing Candle
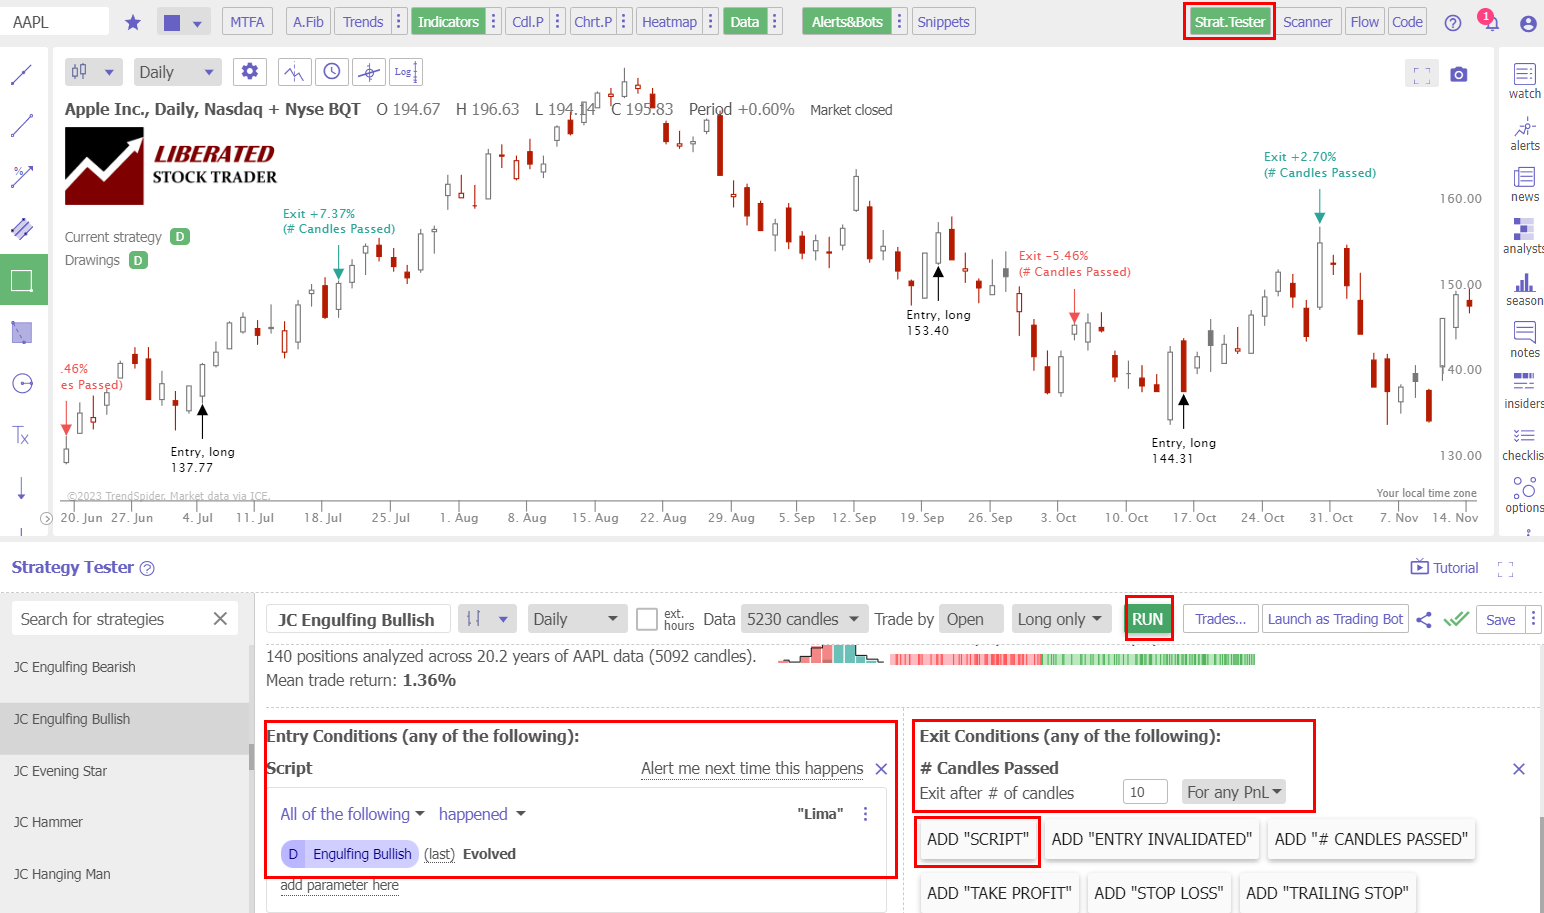
Using TrendSpider for trade identification and execution gives fast and precise results. To evaluate candlestick patterns and strategies independently, follow the instructions below and check out the screenshot for reference.
- Register for TrendSpider.
- Buy Signal: Select Strategy Tester > Entry Condition > Add Parameter > Condition > Candlestick pattern > Bullish Engulfing > Evolved.
- Sell Signal: Add # Candles Passed = 10.
- Click “RUN” to execute the backtest.
Backtesting Done with TrendSpider
Bullish Engulfing Candle Test Results
After conducting 3,735 trades on 568 years of data, we confirm the Bullish Engulfing profit per trade to be 0.46%. A 0.46% win rate means trading a Bullish Engulfing long will net you an average of 0.46% profit per trade if you sell after ten days. Conversely, short-selling a Bullish Engulfing will result in a loss of -0.46% per trade. This proves that this pattern is bullish.
The percentage of Bullish Engulfing winning trades was 55% versus 45% losing trades, significantly lower than the 55.8% average performance across all candlestick types. The Max Drawdown was -40.2%, versus the stock’s drawdown of -59.3%, which shows less volatility than a buy-and-hold strategy.
The average winning trade was 3.5% over ten days, and the average losing trade was -3.3%; this represents a slim profit margin, especially when combined with the 55% successful trades.
The reward-to-risk ratio is 1.06, the 10th highest of the 25 candles we tested. We have seen much higher Reward/Risk ratios in our testing of “The most successful chart patterns.”
Bullish Engulfing Candle Test Results Summary
Ultimately, for every long trade you make after a Bullish Engulfing appears on a daily stock chart, on average, you should make 0.46% after holding for ten days. This result makes the Bullish Engulfing a mediocre candlestick pattern to trade.
One of the best candlesticks for trading is the Inverted Hammer, with a profit per trade of 1.12%.
Additionally, the Bearish Engulfing candle vastly outperforms the Bullish Engulfing pattern. I compare both the Bearish and Bullish Engulfing patterns in the table below.
Performance Data Table: Bullish Engulfing vs. Hammer
Our combined testing of 1,136 years of data shows the Bearish Engulfing pattern vastly outperforms the Bullish Engulfing candle by 26%.
| Test Results | Bearish Engulfing | Bullish Engulfing |
| Data Analyzed (Years) | 568.3 | 568.3 |
| # Trades | 4096 | 3735 |
| Wins | 57.0% | 55.0% |
| Losses | 43.0% | 45.0% |
| Max Drawdown | -39.7% | -40.2% |
| Max Drawdown (Asset) | -59.3% | -59.3% |
| Average Win | 3.7% | 3.5% |
| Average Loss | -3.5% | -3.3% |
| Average Return Per Trade | 0.62% | 0.46% |
| Reward/Risk Ratio | 1.06 | 1.06 |
| Sharpe Ratio | 0.22 | 0.11 |
| Sortino Ratio | 0.70 | 0.54 |
My groundbreaking research into the profitability and success rates of chart patterns and technical indicators is built on the most powerful backtesting platforms available. If you want to design original, profitable trading strategies, our exclusive review of the best backtesting software will help you find the perfect solution to give you a real edge in the markets.

Is a Bullish Engulfing Candle Bullish or Bearish?
Our extensive testing revealed that the Bullish Engulfing pattern is bullish. Our analysis of 3,735 trades shows a 55% tendency toward bullishness and 43% toward bearishness.
Is a Bullish Engulfing a Reversal Pattern?
Our data shows that Bullish Engulfing is not a clear reversal or continuation pattern. Testing confirms Bullish Engulfing candles occur during uptrends and downtrends, but they do not exclusively signal a price reversal; they can also be continuation patterns.
Does the Bullish Engulfing Candle Work?
Yes, the Bullish Engulfing candle works well in trading, producing a 55% success rate. This performance is far from the best; we rank it 13th out of all candles, with a 0.46% average profit after 10 days. If you sell it short, it will average a -0.46% loss.
Is a Bullish Engulfing Candle Accurate?
Yes, a Bullish Engulfing candle is the 13th most accurate candle pattern to trade, placing it in the middle of the pack. It results in 55% of trades winning and 45% losing. The average winning trade is 3.5%, and the losing trade is -3.3%. Using a Bullish Engulfing candle is a slight advantage in trading.
Can the Bullish Engulfing Candle be used for Buy and Sell Signals?
Yes, our data shows that Bullish Engulfing candles can be used for buy and sell signals, but the Inverted Hammer or Bearish Marubozu is a better alternative. These candles have vastly superior reliability and profitability.
Is a Bullish Engulfing Candle Reliable?
Yes, the Bullish Engulfing is reliable. According to 3,735 tested trades, a Bullish Engulfing is 55% reliable for bullish trades. It has a mediocre 0.46% average profit, and the average winning trade was 3.6% over 10 days.
Bullish Engulfing Summary
In conclusion, Bullish Engulfing is a reliable and profitable pattern in Japanese candlestick analysis. Its reasonable accuracy of 55% results in a profit per trade of 0.46%, but it is not close to the best-performing candlestick patterns.
All traders would benefit from investing in a comprehensive trading training course to help them make more informed decisions while managing their risks properly. So why not check out Liberated Stock Trader’s advanced investing course today?
You want to be a successful stock investor but don't know where to start.
Learning stock market investing on your own can be overwhelming. There's so much information out there, and it's hard to know what's true and what's not.

Liberated Stock Trader Pro Investing Course
Our pro investing classes are the perfect way to learn stock investing. You will learn everything you need to know about financial analysis, charts, stock screening, and portfolio building so you can start building wealth today.
★ 16 Hours of Video Lessons + eBook ★
★ Complete Financial Analysis Lessons ★
★ 6 Proven Investing Strategies ★
★ Professional Grade Stock Chart Analysis Classes ★
FAQ
What is the best software for Engulfing candle trading?
TrendSpider is the best software for trading all Japanese candlestick patterns due to its powerful point-and-click backtesting and pattern recognition. TradingView is a great alternative for those trading non-US markets.
Is the Bullish Engulfing candle profitable?
Yes, the Bullish Engulfing is marginally profitable but only ranks 13th most profitable candle pattern. Our testing shows an average return of 0.46% compared to the Inverted Hammer's 1.12%.
What is a Bullish Engulfing candle?
A Bullish Engulfing candle is a two-candle pattern where the first candle is small with a red bearish body, and the second is larger with a green bullish body. This pattern indicates a 55% chance of a price increase in the following 10 days.
What are the strategies for trading the Bullish Engulfing candle?
When trading the Bullish Engulfing candle, wait for the next positive open on higher volume. If the stock continues down after the Bullish Engulfing candle, wait before entering the trade, which might improve your profits.
What software automatically detects Bullish Engulfing Candles?
All testing in this research article has been performed with the superb TrendSpider, which automatically detects all candlesticks, including Engulfing candles. See other alternatives in our Candlestick Pattern Recognition Software Testing.
Is the Bullish Engulfing candle popular?
According to Google search data, the Bullish Engulfing candle is not a popular pattern. Most traders do not know how to trade it based on the data. Traders need to know that this pattern is not particularly profitable.
Is the Bullish Engulfing candle important in trading?
Yes, according to our research, the Bullish Engulfing candle is an important candlestick pattern due to its 0.46% average trade profit and average winning trade of 3.6%.
Is the Bullish Engulfing candle reliable?
Yes, Bullish Engulfing candles reliably predict market direction 55% of the time, making it good for a consistent 0.46% per trade profit. However, the Bearish Engulfing candle is more reliable and profitable than the Bullish Engulfing candle.
What indicators should I use with Bullish Engulfing Candles?
In conjunction with Bullish Engulfing Candles, it is advisable to use indicators such as relative strength index (RSI) and rate of change (ROC). Our research and analysis have proven these indicators successful.