Parabolic stocks captivate the attention of traders and investors alike due to their dramatic price surges within a short timeframe. These rapid increases often resemble a parabolic curve on a chart, hence the term ‘parabolic.’
Parabolic stock price movements can result from strong financial performance, product innovations, or sector-wide euphoria. Traders gravitate towards these stocks as they can provide significant returns quickly but bear considerable risk due to potential volatility reversals.
Successful trading of parabolic stocks requires an astute understanding of market psychology and a well-crafted strategy. Monitoring for stocks hitting new highs, recognizing the signs of a developing parabolic move, and knowing when to exit are critical components of trading this phenomenon.
Key Takeaways
- Parabolic stocks are characterized by rapid price increases, drawing significant trader interest.
- An effective trading strategy is crucial to capitalize on these movements and mitigate risks associated with volatility.
- Real-world examples of parabolic stocks can serve as educational tools for understanding market dynamics and trader psychology.

Understanding Parabolic Stocks
Parabolic stocks are defined by a rapid and steep uptrend in price, increased volume, and limited price pullbacks. These moves are typically short-lived, with prices skyrocketing and quickly reversing course.
Characteristics
Parabolic stocks display a rapid increase in stock price, often driven by a combination of market psychology, sector momentum, and significant news that fuels trader interest. These characteristics manifest as:
- Sharp price increase: Typically, the price moves upward at an accelerating pace, far outstripping the usual daily percentage movements.
- High trading volume: Increased trading volume usually accompanies the price hike, signaling heightened interest and participation from traders.
- Limited pullbacks: During a parabolic run, the stock price rarely experiences significant pullbacks or consolidations, leading to an unsustainable uptrend.
The Phases of a Parabolic Move
A parabolic move can generally be divided into three distinct phases:
- Accumulation: Traders begin to take notice of a stock, and volume gradually increases without a significant impact on the price.
- Run-up (Parabolic Phase): The stock enters an explosive uptrend where price and volume sharply increase, often resulting in a ‘frenzy’ as more traders jump in to capitalize on the move.
- Reversal/Crash: After the extreme uptrend, parabolic stocks are prone to a sudden and sharp reversal or crash, where the price can rapidly descend, sometimes even more quickly than it ascended.
Understanding these phases equips traders with insight into the life cycle of a parabolic stock, enabling them to plan and execute trades around these high-stakes situations with greater confidence.
TradingView 4.8/5⭐ : The Best Trading Platform I’ve Tested in 20+ Years
With lightning-fast charts, powerful pattern recognition, smart screening, backtesting, and a global community of 20+ million traders — it’s a powerful edge in today’s markets.

If you want one platform that gives you an edge, this is it.
Case Studies
Parabolic stock movements represent some of the most extreme price behaviors in the stock market, often coupled with high trading volume. These cases highlight the implications of rapid price moves and the eventual reversals that typically follow.
Historical Parabolic Stock Movements
Historical instances of parabolic runs provide valuable insights into the nature of such stock movements. One prominent example involves companies like GameStop and AMC, which experienced extraordinary gains due to a phenomenon known as a “short squeeze.”

See a GameStop Chart Live on TradingView
GameStop’s stock, for instance, skyrocketed in price over a series of days, generating a considerable uptrend in its valuation. The volume of shares traded during this period surged as the price move became steeper, drawing massive attention from both retail and institutional investors.
See this AMC Chart Live on TradingView
Detailed Analysis of Parabolic Moves
Parabolic moves are characterized by an accelerating uptrend, often preceding a significant reversal or crash. This pattern was observed in the sharp rise and fall of stocks during the Dot-com bubble, where the initial run-up in prices was propelled by speculative trading and high expectations of internet-related businesses.
The subsequent reversal, however, saw many of these stocks plummet, leading to massive losses in the stock market. A detailed analysis of such parabolic moves underscores the importance of risk management strategies and an understanding of market psychology during these volatile periods.
Parabolic Moves in Crypto & Commodities
Parabolic moves are not confined to equities alone; they are also seen in commodities and cryptocurrencies. Each asset class behaves differently under parabolic conditions. For instance, commodities might experience parabolic moves due to geopolitical tensions affecting supply, while cryptocurrencies could surge on regulatory news or technological breakthroughs.
In every case, trading volumes and liquidity levels indicate how long the parabolic trend might last.

See this Bitcoin/USD Chart on TradingView
Factors Influencing Parabolic Moves
Understanding the factors leading to parabolic stock price moves is crucial for traders and investors. These sharp, exponential increases in stock valuation typically occur due to a mix of fundamental triggers, technical indicators, and shifting market sentiment.
Fundamental Triggers
Major news, such as a company’s innovative product launch or strategic partnerships, can spur a sudden increase in demand for the stock. Similarly, a favorable Fed decision or a key endorsement by an influential figure like Warren Buffett can be a catalyst. A significant change in volume traded often accompanies such events, signaling strong investor interest.
Technical Indicators
Analysts often rely on specific technical indicators, such as moving averages, to predict stock performance. A short-term moving average crossing over a long-term one may suggest upward momentum. Additionally, high volume in conjunction with these patterns can confirm a potential parabolic trajectory.
A momentum indicator such as RSI (Relative Strength Index) can also be used to gauge whether a stock is overbought or oversold, which may indicate potential corrections or rebounds.
Market Sentiment
The psychological phenomenon of Fear of Missing Out (FOMO), fueled by social media and discussion forums, can precipitate a rush to buy stocks, further accelerating their ascent. War or geopolitical tensions can also influence the sector/industry trends, resulting in a volatile yet potentially profitable market environment.
The fear and greed index can provide insight into market sentiment and help investors make informed decisions.
Trading Parabolic Stocks
Trading parabolic stocks involves a nuanced blend of technical analysis and market psychology. Investors search for stocks exhibiting extreme upward movements—these positions often reflect a highly optimistic market sentiment, which can sometimes lead to equally swift reversals.
Identifying Potential Parabolic Stocks
Traders typically seek out stocks showing rapid price acceleration over a short period. A parabolic stock usually experiences price moves that deviate from the norm, often influenced by a momentum shift, which can be triggered by factors such as a significant short squeeze.
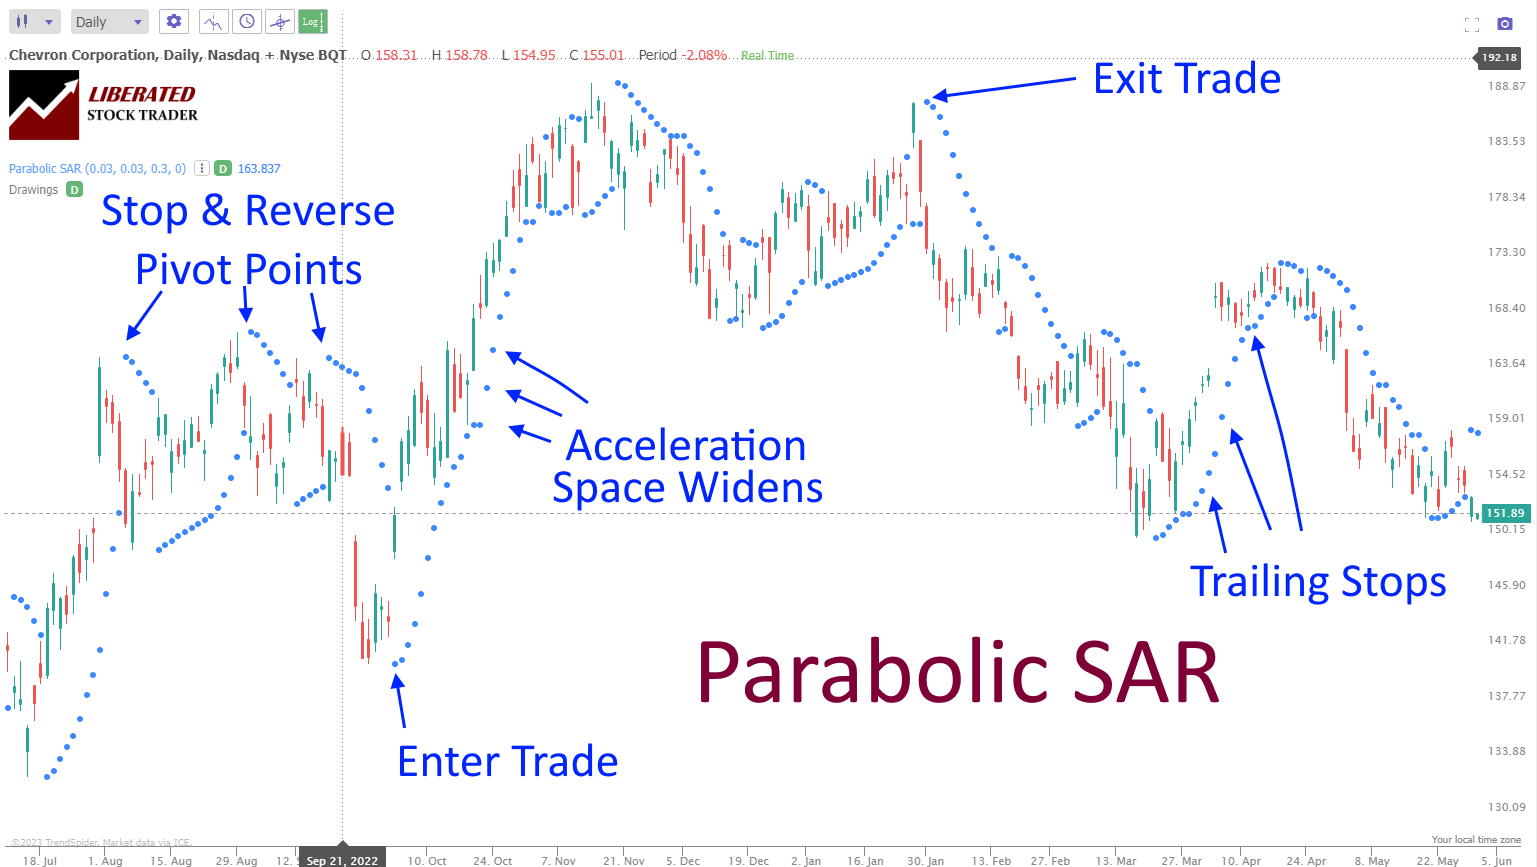
A watchlist becomes an essential tool, allowing traders to monitor various stocks for potential parabolic movement using indicators like Parabolic SAR (Stop and Reverse) to gauge shift points.
By analyzing an index or sector/industry trends, traders can pinpoint sectors with high short interest and a low float, signaling a ripe environment for parabolic action.
7 Parabolic SAR Trading Strategies Tested by LiberatedStockTrader
Assessing Risks and Rewards
While the rewards of trading parabolic stocks can be substantial due to quick and significant price movements, they come with equally high risk. Traders must assess their risk tolerance and be aware of the potential for rapid declines.
Short-sellers who can spot a parabolic move in its latter stages might find a suitable shorting opportunity, but they must be wary of the risks of a continuing squeeze.
Long position traders should consider setting a trailing stop to protect gains, as reversals in parabolic stocks can be abrupt and severe.
Strategies for Trading Parabolic Stocks
The strategy for trading parabolic stocks should be executable, clear, and adaptable to changing market conditions.
Momentum strategies often involve entering a trade after a stock has shown a strong price increase, expecting the increase to continue. Conversely, identifying stocks at risk of a short squeeze may allow traders to anticipate further upside and manage positions accordingly.
It is essential to have a predetermined exit strategy, such as a trailing stop, to preserve capital in the event of a sudden trend reversal.
Video: Parabolic SAR Indicator
Experienced traders pay close attention to market psychology and supply and demand mechanics, employ strategic stop-loss orders, and recognize the distinct behavior of parabolic moves across various asset classes.
Market Psychology
Market psychology plays a critical role in parabolic trends, where the fear of missing out (FOMO) can drive volumes higher as more traders jump into the fray. A trader’s psychology, prone to emotional responses to rapid price changes, often amplifies these moves, pushing stocks into parabolic rises or precipitous falls.
You want to be a successful stock investor but don't know where to start.
Learning stock market investing on your own can be overwhelming. There's so much information out there, and it's hard to know what's true and what's not.

Liberated Stock Trader Pro Investing Course
Our pro investing classes are the perfect way to learn stock investing. You will learn everything you need to know about financial analysis, charts, stock screening, and portfolio building so you can start building wealth today.
★ 16 Hours of Video Lessons + eBook ★
★ Complete Financial Analysis Lessons ★
★ 6 Proven Investing Strategies ★
★ Professional Grade Stock Chart Analysis Classes ★
Supply and Demand Dynamics
Supply and demand imbalances significantly influence stock prices. When demand outpaces supply, it can lead to a sharp increase in stock prices. During these periods, volume analysis becomes pivotal as it can indicate the sustainability of the stock’s rise. Traders watch whether high volume accompanies price jumps or if low volume suggests a potential reversal.
Using Stop-Loss Orders
In the context of parabolic stocks, utilizing trailing stop orders can help traders manage risk. These stop-loss orders adapt to the stock’s price movement, locking in profits by closing the position if the stock reverses by a predefined percentage or dollar amount.
FAQ
What is the definition of a parabolic trend in stocks?
A parabolic trend in the stock market refers to a situation where stock prices increase steeply over a short period, resembling the shape of a parabola. This indicates that a stock is rapidly escalating, often driven by speculative trading.
How does the Parabolic SAR indicator function in trading strategies?
The Parabolic SAR (Stop and Reverse) is a technical analysis tool that helps traders determine the direction of a stock's momentum and when this momentum is likely to change. It places dots on a chart that indicate potential reversals in price movement.
What is a parabolic curve within financial charts?
Within financial charts, a parabolic curve signals a sharp rise in an asset's price over time that accelerates until it reaches a peak. After this peak, the asset's price is often expected to decline sharply.
What implications does a parabolic move have for a stock's future price action?
A parabolic move often precedes a significant price correction or reversal. Investors see such an extreme rally as unsustainable long-term, which might lead to a dramatic sell-off.
What are the risks and benefits of a short position in a parabolic stock move?
Entering a short position during a parabolic stock move is highly risky due to potential losses if the stock continues to climb. However, if the stock's price begins to fall, the benefits include profit from the declining prices.
How can traders assess the success rate of using a Parabolic SAR trading system?
We have conducted research on the success rate of a Parabolic SAR trading system by backtesting it against historical price data to determine how well the signals perform. This process allows for an empirical assessment of its effectiveness.