Every statistic here is built to earn a headline—the kind a journalist can run with, and the kind an investor can use to make smarter decisions when markets get noisy. These numbers put scale, concentration, and market power into plain English: how much of the world the U.S. really dominates, how a single company can rival a major economy, how “a normal 1% day” translates into hundreds of billions, and why a tiny sliver of winners often drives the market’s gains.
No recycled blog stats. No weak citations. Just primary sources, clean calculations, and perspective you can quote with confidence.
If you’re a journalist, you’ll find headline-ready comparisons with links you can verify in minutes. If you’re an investor, you’ll walk away with a sharper mental model of what you’re actually participating in—and why staying diversified and disciplined is less “advice” and more survival logic. If you use a headline or statistic here, we simply ask you to link back to this website.
1. The Stock Market Hit “Planet-Scale” Money
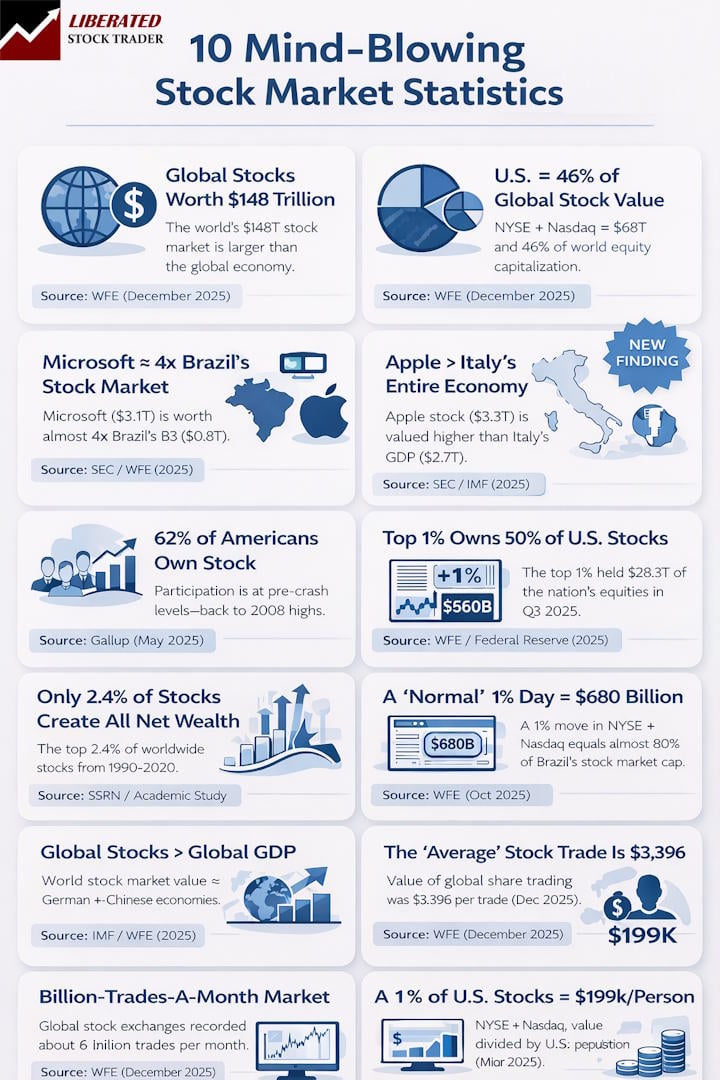
Headline: Global Stock Market Capitalization Reached $148.43 Trillion.
That’s the estimated combined value of listed equities worldwide in the WFE’s latest 2025 dashboard snapshot—bigger than any single country’s economy, and large enough that small percentage moves translate into staggering dollar swings.
Calculation (if applicable): $148,431,549.56 million ÷ 1,000,000 = $148.43T
Primary Source: World Federation of Exchanges (WFE) — Focus Dashboard (Dec 2025).
2. America Owns Nearly Half the World’s Stock Market
Headline: The U.S. Is 45.8% of the Global Equity Market Value.
Add the NYSE and Nasdaq together, and you get nearly $68T—about 45.8% of the global total in the same WFE reporting period. That’s not “half,” but it’s still an extraordinary concentration.
Calculation (if applicable): (NYSE $32.313T + Nasdaq $35.673T) ÷ Global $148.432T = 45.8%
Primary Source: WFE — Focus Market Statistics (Dec 2025) + WFE — Focus Dashboard (Dec 2025).
3. Nasdaq Alone Is Nearly 7× Bigger Than India’s Biggest Exchange
Headline: Nasdaq’s Market Value Was $35.67T vs. India’s BSE at $5.29T (Oct 2025).
One exchange—Nasdaq—was worth about 6.74× India’s BSE by listed equity value, according to the WFE’s Oct 2025 data. That’s the “mega-cap gravity” effect in one line.
Calculation (if applicable): $35.673T ÷ $5.291T = 6.74×
Primary Source: WFE — Focus Market Statistics (Dec 2025).
4. Microsoft Is Worth ~3.7× Brazil’s Entire Stock Market
Headline: Microsoft’s Stock Value (~$3.1T) Was About 3.7× Brazil’s B3 (~$0.85T).
Microsoft’s Form 10-K reports an aggregate market value held by non-affiliates of about $3.1 trillion (as of Dec 31, 2024). Brazil’s B3 market cap in Oct 2025 was about $0.85T—making Microsoft alone roughly 3–4 Brazils (stock-market-sized).
Calculation (if applicable): $3.1T ÷ $0.848T ≈ 3.65×
Primary Source: Microsoft Form 10-K (FY2025) — SEC EDGAR + WFE — Focus Market Statistics (Dec 2025).
5. Apple’s Stock Float Is Bigger Than Italy’s Entire Economy
Headline: Apple’s Non-Affiliate Stock Value Was $3.253T—Around 1.2× Italy’s 2025 GDP.
Apple reports roughly $3.253T in non-affiliate market value (as of Mar 28, 2025). IMF projections put Italy’s 2025 GDP around $2.7T, meaning Apple’s public float (as defined in the filing) is “Italy-sized” and then some.
Calculation (if applicable): $3.253T ÷ $2.7T ≈ 1.20×
Primary Source: Apple Form 10-K (FY2025, as filed) + IMF DataMapper — Italy GDP (WEO Oct 2025).
6. Stocks Are Bigger Than the Global Economy
Headline: Global Equities Were About 1.20× the Size of World GDP.
According to the IMF’s October 2025 outlook, world GDP in 2025 is about $123.58T. The WFE’s global equity value is $148.43T. Different concepts (wealth vs. annual output)—but the scale comparison is still jaw-dropping.
Calculation (if applicable): $148.43T ÷ $123.58T ≈ 1.20×
Primary Source: WFE — Focus Dashboard (Dec 2025) + IMF DataMapper — World GDP (WEO Oct 2025).
7. A Normal “1% Day” in U.S. Stocks Is a $680 Billion Event
Headline: A 1% Move in NYSE+Nasdaq Equals About $680B—Almost 80% of Brazil’s Entire Market Cap.
When people say “the market was up 1%,” they’re often missing what that means in dollars. On the WFE numbers, 1% of NYSE + Nasdaq ≈ $680B—roughly 0.8× the entire Brazilian stock market.
Calculation (if applicable): 1% × ($32.313T + $35.673T) = $679.9B; $679.9B ÷ $848.2B ≈ 0.80×
Primary Source: WFE — Focus Market Statistics (Dec 2025).
8. U.S. Stock Wealth Works Out to ~$199k Per Person
Headline: NYSE+Nasdaq Equal About $198,915 per U.S. Resident (Mid-2025 population).
This is pure perspective math. Combine the NYSE and Nasdaq values, then divide by the U.S. population estimate for Jul 1, 2025. It’s not “your money”—it’s just a scale lens.
Calculation (if applicable): $67.986T ÷ 341,784,857 ≈ $198,915/person
Primary Source: WFE — Focus Market Statistics (Dec 2025) + U.S. Census Bureau — QuickFacts (Population, Jul 1, 2025).
9. The World Traded $20.3 Trillion of Shares in a Single Month
Headline: Global “Value of Share Trading” was $20.31 T in the WFE’s Dec 2025 Dashboard Month.
That’s turnover, not “new money.” But it shows how liquid (and hyperactive) markets are: trillions of dollars in shares changing hands at an industrial scale.
Calculation (if applicable): $20,305,085.48 million ÷ 1,000,000 = $20.31T
Primary Source: WFE — Focus Dashboard (Dec 2025).
10. Markets Execute Roughly 6 Billion Trades per Month
Headline: Global Stock Trading Hit About 5.98 Billion Trades in the Dashboard Month.
The WFE reports “Number of trades” as 5,978,431.63 (‘000)—that’s about 5.98 billion trades for the period shown.
Calculation (if applicable): 5,978,431.63 × 1,000 = 5,978,431,630 trades
Primary Source: WFE — Focus Dashboard (Dec 2025).
11. The “Average” Stock Trade Is About $3,400
Headline: Global Average Trade Size Was Roughly $3,396 (Back-of-Envelope).
Divide the total share trading value by the number of trades in the same dashboard period, and you get a rough average trade size. It’s a blunt statistic (different venues, products, and reporting conventions), but it captures how retail-scale activity can add up to global-scale turnover.
Calculation (if applicable): $20.305T ÷ 5.978B ≈ $3,396 per trade
Primary Source: WFE — Focus Dashboard (Dec 2025).
12. There Are 60,633 Listed Companies Worldwide
Headline: The Public Stock Market Hosted 60,633 Listed Companies.
That’s domestic + foreign listings. It’s a reminder that “the stock market” isn’t just the S&P 500—it’s a vast ecosystem of businesses.
Calculation (if applicable): N/A
Primary Source: WFE — Focus Dashboard (Dec 2025).
13. Options Trading Is a 6.25 Billion-Contract Month
Headline: Exchange-Traded Options Reached 6.25B Contracts in the Dashboard Period.
Derivatives aren’t a side show—they’re a parallel universe of scale. In the WFE dashboard month, options contracts traded were 6,252,678,189.
Calculation (if applicable): N/A
Primary Source: WFE — Focus Dashboard (Dec 2025).
14. Futures Trading Is a 2.38 Billion-Contract Month
Headline: Exchange-Traded Futures Hit 2.38B Contracts in the Dashboard Period.
Same WFE dashboard period: futures contracts traded were 2,383,884,488.
Calculation (if applicable): N/A
Primary Source: WFE — Focus Dashboard (Dec 2025).
15. Americans Own Stock Again—Back at Pre-Crash Levels
Headline: 62% of Americans Report Owning Stock in 2025.
Gallup’s May 5, 2025, update reports that stock ownership is 62%, matching 2024 and sitting near pre-2008-crash levels. This includes direct and indirect ownership (e.g., retirement accounts).
Calculation (if applicable): N/A
Primary Source: Gallup — “What Percentage of Americans Own Stock?” (Updated May 5, 2025).
16. U.S. Households Hold $56.43 Trillion in Stocks (and Stock Funds)
Headline: Households’ “Corporate Equities and Mutual Fund Shares” Reached $56.43T (Q3 2025).
This is the Federal Reserve’s household sector market value level for corporate equities and mutual fund shares—one of the cleanest “how much stock exposure exists” snapshots in public data.
Calculation (if applicable): $56,431,554 million ÷ 1,000,000 = $56.43T
Primary Source: Federal Reserve (via FRED) — BOGZ1LM193064005Q.
17. The Top 1% Owns Half the Stock Exposure
Headline: The Top 1% Held 50.2% of Corporate Equities & Mutual Fund Shares (Q3 2025).
This is the clean inequality headline for U.S. equity exposure: about half sits with the top 1% by wealth.
Calculation (if applicable): N/A
Primary Source: Federal Reserve (via FRED) — WFRBST01122.
18. The Bottom 50% Owns Barely Anything
Headline: The Bottom 50% Held Just 1.1% of Corporate Equities & Mutual Fund Shares (Q3 2025).
That’s not a typo: 1.1%. This is why “average investor” narratives can be wildly misleading—ownership is broad, but concentration is extreme.
Calculation (if applicable): N/A
Primary Source: Federal Reserve (via FRED) — WFRBSB50203.
19. The Top 1% Holds $28.31 Trillion in Stock Exposure
Headline: The Top 1% Owned $28.31T in Corporate Equities & Mutual Fund Shares (Q3 2025).
This is the level (dollar value) counterpart to the “50.2% share” statistic.
Calculation (if applicable): $28,310,382 million ÷ 1,000,000 = $28.31T
Primary Source: Federal Reserve (via FRED) — WFRBLT01014.
20. A Brutal Perspective Stat: $21M vs $9k
Headline: The “Average” Top-1% Household Has About $21M in Stock Exposure vs ~$9k for the Bottom Half (Approx.).
This is constructed from primary data to put inequality on a personal scale. I used: (a) Top 1% equity holdings, (b) total U.S. households, and (c) the bottom-50% equity share applied to total household equity holdings. It’s approximate (percentile groups aren’t literally “random households”), but the magnitude is the story.
Calculation (if applicable):
Top-1% avg ≈ $28.31T ÷ (1% × 134.79M households) ≈ $21.0M/household
Bottom-50% avg ≈ (1.1% × $56.43T) ÷ (50% × 134.79M households) ≈ $9.2k/household
Primary Source: Federal Reserve (via FRED) — WFRBLT01014 + Federal Reserve (via FRED) — BOGZ1LM193064005Q + Federal Reserve (via FRED) — WFRBSB50203 + U.S. Census Bureau (via FRED) — Total Households (TTLHH).
21. Active Managers “Lost” a Majority Vote in 2025 (Again)
Headline: 54% of Actively Managed Large-Cap U.S. Equity Funds Underperformed the S&P 500 (H1 2025).
That’s the headline figure from SPIVA’s mid-year 2025 U.S. scorecard—an official benchmark report that tracks how active funds fare versus indices.
Calculation (if applicable): N/A
Primary Source: S&P Dow Jones Indices — SPIVA® U.S. Mid-Year 2025 (summary page).
22. Recessions Are Short; Expansions Are Long
Headline: Since 1945, U.S. Recessions Averaged 10.3 Months vs Expansions at 64.2 Months.
This is the “don’t panic” historical perspective: downturns hit hard, but historically they’ve been much shorter than the expansions that follow.
Calculation (if applicable): N/A
Primary Source: NBER — U.S. Business Cycle Expansions and Contractions.
23. Sleep Can Make You a Worse Trader (Especially on Earnings Days)
Headline: Sleep-Disrupted Investors Underperformed 3× More on Earnings-Announcement Days.
A 2025 NBER working paper finds that the performance gap for sleep-disrupted investors is three times larger on earnings-announcement days than on non-earnings days—exactly when fast, accurate processing matters.
Calculation (if applicable): N/A
Primary Source: NBER Working Paper 33477 (2025) — “Sleep, Mental Alertness, and Stock Market Trading” (PDF).
24. Even Sunlight Can Nudge Trading Behavior
Headline: Investors on the “Earlier Sunset” Side of a Time-Zone Border Were 4.27% More Likely to Trade Right After Earnings.
A 2024 academic paper reports a 4.27% higher likelihood of trading immediately after earnings announcements for people living on the earlier-sunset side of a time-zone border—suggesting attention and sleep patterns can leak into markets.
Calculation (if applicable): N/A
Primary Source: “Sleep and Retail Investors’ Stock Investment Performance” (2024) — PDF.
25. Only 2.4% of Stocks Created All the Net Wealth
Headline: The Top 2.4% of Global Stocks Accounted for All Net Wealth Creation (1990–2020).
This is the punchline behind index investing: wealth creation is insanely concentrated. In this research, only 2.4% of firms account for the entire net global wealth creation over the sample period.
Calculation (if applicable): N/A
Primary Source: SSRN — “Long-Term Shareholder Returns: Evidence from 64,000 Global Stocks” (PDF)
26. America Owns Half the World’s Wealth
Headline: The U.S. Stock Market Is Now 50.2% of the Entire Global Equity Value.
For the first time in history, the United States accounts for more than half of the world’s total stock market capitalization. At the start of 2025, while nations like China and Germany saw their global shares shrink, U.S. dominance surged to a record high, up from 45% just one year prior.
- Total Global Market Cap: ~$148 Trillion (October 2025).
- U.S. Total Market Cap: ~$74 Trillion.
- Primary Source: World Federation of Exchanges (WFE) / Bloomberg (2025)
27. Nvidia’s AI Crown Eclipses Nations
Headline: Nvidia Becomes the First $4 Trillion Company, Larger than the GDP of Japan.
On Jul 9, 2025, Nvidia shattered the $4 trillion market cap ceiling. To put that in perspective, Nvidia is now valued higher than the entire annual economic output (GDP) of Japan, India, or Germany, effectively making it a “corporate superpower.”
- Market Cap: $4.52 Trillion (Feb 2026).
- Relative Scale: Larger than the 2025 GDP of Japan (~$4.1T).
- Primary Source: Axi Global Market Analysis (2026)
28. The Death of the “Active” Era
Headline: Passive Funds Now Control the Majority of Global Capital.
A massive structural shift was finalized in 2025: for every £1 added to active strategies, over £10 was poured into tracker funds. Between 2022 and 2025, passive funds saw inflows of £56.4 billion, while active managers saw £26.6 billion in outflows.
- Flow Divergence: £89bn added to passives vs. £7.4bn for active over the last decade.
- Sector Impact: Passives outperformed actives in 27 out of 49 major peer groups in 2025.
- Primary Source: Trustnet / Calastone Fund Flow Index (Feb 2026)
29. The “Magnificent Seven” Concentration Crisis
Headline: Seven Tech Stocks Now Represent One-Third of the Entire S&P 500.
The concentration of the U.S. market has reached an “extreme” level. As of February 2026, the Magnificent Seven (Nvidia, Apple, Microsoft, Amazon, Alphabet, Meta, and Tesla) account for 32.6% of the S&P 500 index, up from just 12.5% ten years ago.
- Combined Value: Peak of $22.3 Trillion in late 2025.
- 10-Year Return: 875.5% (Mag 7) vs. 234.9% (S&P 500).
- Primary Source: The Motley Fool / Voronoi (Feb 2026)
30. Gold’s Historic “Triple-Four” Run
Headline: Gold Smashes $4,000/oz After 53 All-Time Highs in a Single Year. 2025 was the “Year of the Bullion.”
Driven by central bank buying and geopolitical de-dollarization, gold prices rose 44% on an annual average basis, setting a record-breaking 53 new all-time highs throughout the year.
- Average Q4 Price: $4,135 per ounce.
- Total Demand: Exceeded 5,000 tonnes for the first time in history.
- Primary Source: World Gold Council: 2025 Full Year Trends
31. Main Street Joins the Market
Headline: U.S. Stock Ownership Hits 62%, the Highest Rate Since the 2008 Crash. American participation in the stock market has returned to pre-Great Recession levels.
Driven by fractional shares and commission-free apps, 62% of U.S. adults now own stock, though wealth remains heavily skewed toward the top 10% of households.
- Demographic Peak: 87% of households earning $100k+ own stock.
- Millennial Shift: 60% of retail activity now comes from Gen Z and Millennials.
- Primary Source: Gallup: Economy and Personal Finance Survey (2025)
32. The 2026 International Rebound
Headline: International Stocks Finally Outpace the S&P 500 in Early 2026.
After a decade of U.S. dominance, the “Rest of the World” is fighting back. In the first two months of 2026, the MSCI World ex-USA Index rose 8.2%, outperforming the flat S&P 500 as investors sought value outside of overpriced U.S. tech.
- Relative Gains: International indexes are currently 6 percentage points ahead of the U.S.
- Growth Drivers: Rate cuts in the Eurozone and Japan’s corporate reforms.
- Primary Source: IndexBox Global Market Report (Feb 2026)
33. Algorithmic Dominance of Trades
Headline: Humans Are the Minority: Algorithms Now Control 75% of Trading Volume.
The “Flash” nature of modern markets is no accident. The algorithmic trading market grew to $21.89 billion in 2025 and is projected to hit $25 billion this year, as AI-driven execution becomes the standard for both retail and institutional players.
- Growth Rate: 14.4% CAGR (2025-2026).
- Retail Adoption: 37% of retail traders now use some form of automated “copy-trading” or AI tool.
- Primary Source: Research and Markets: Global Algorithmic Trading Report (2026)
34. The Rise of the Active ETF
Headline: Active ETFs Saw a Record $580 Billion Inflow in 2025.
While traditional active mutual funds are dying, the “Active ETF” is the new industry darling. Investors are fleeing high-fee mutual funds ($640B in outflows) for the tax-efficient, active-management “wrapper” of ETFs.
- Equity Focus: 32% of all equity ETF flows in 2025 were into active strategies.
- Total Divergence: Active ETFs have attracted $1.2T in cumulative inflows over the last decade.
- Primary Source: State Street Global Advisors (SSGA) 2025 Debate
35. Central Banks Hoard Physical Gold
Headline: Central Bank Gold Purchases Hit 863 Tonnes Amid De-Dollarization Fears.
Global central banks aren’t just holding currency; they are aggressively buying physical gold. While purchases slowed slightly from the 1,000t peak of previous years, the 863t added in 2025 represents a massive strategic pivot away from Western sovereign debt.
- Market Value: These purchases added $555 billion in value to global reserves in 2025.
- U.S. Reserve Share: Gold now makes up 81% of total U.S. foreign-currency reserves.
- Primary Source: World Gold Council (Jan 2026)
36. Mobile Trading is the New Standard
Headline: 75% of All Retail Stock Trades Are Now Executed via Mobile Apps.
The “Desktop Trader” is becoming a relic. As of early 2026, three-quarters of global retail trading volume is generated on mobile devices, with Gen Z trading nearly daily, compared with monthly rebalancing among older generations.
- Growth: Mobile trading app installs rose 28% year over year in 2025.
- Weekly Activity: Half of Gen Z investors trade at least once a week.
- Primary Source: SQ Magazine: Stock Market Participation (2026)
37. Corporate Titans vs. Superpowers
Headline: The World’s Top 100 Companies Are Now More Valuable Than the U.S. and China Combined.
The “Corporate Continent” has arrived. The combined market capitalization of the Global Top 100 reached $42.6 trillion in 2025. If these 100 companies were a nation, their valuation would exceed the combined annual GDP of the world’s two largest economies.
- Top 100 Valuation: $42.6 Trillion.
- U.S. + China GDP: ~$48 Trillion (Estimated for 2025).
- Primary Source: PwC Global Top 100 / IMF World Economic Outlook (2025)
38. S&P 500 Dividend Comeback
Headline: S&P 500 Dividend Returns Reach 1.49% in 2025 as Growth Slows.
After years of focusing solely on price appreciation, dividends are once again starting to matter. In 2025, while the S&P 500 saw a 16.39% price return, dividends contributed an additional 1.49% to the total return, a signal of maturing tech giants.
- Total Return (2025): 17.88%.
- Dividend Yield: Trending upward as companies like Meta and Alphabet initiated payouts.
- Primary Source: Slickcharts: S&P 500 Total Returns by Year
39. The AI Infrastructure Credit Boom
Headline: AI Financing Set to Drive $3 Trillion in Data Center Debt Through 2027.
The AI revolution isn’t just about stocks; it’s about debt. As of 2026, less than 20% of the projected $3 trillion in AI-related capital expenditure has been deployed, leading to a massive surge in corporate bond issuance.
- M&A Growth: Projected to grow 32% in 2025 and 20% in 2026.
- Tech Debt: High-yield corporate bonds in the tech sector are currently outperforming investment-grade bonds.
- Primary Source: Morgan Stanley Investment Outlook 2026
40. The “Cost of Cash” in the 2025 Rally
Headline: Staying in Cash Costs Investors 15% in Potential Returns During 2025.
While many investors feared a recession, the “Everything Rally” of 2025 punished those on the sidelines. Money market funds returned roughly 2.5%, while the average equity-balanced portfolio returned over 17%.
- Opportunity Cost: A $100,000 portfolio in cash missed out on ~$15,300 in gains.
- Resilience: The S&P 500 total return was 17.88% for the year.
- Primary Source: J.P. Morgan Asset Management: 2025 Year-End Review
41. You have a 32% chance of selecting a stock that will beat the S&P 500.
According to my research, of the 4,000 major US stocks, only 1,299 beat the S&P 500 index from January 2021 to January 2022. The average increase of these stocks was 38.4%. This means you have a 32% chance of selecting a stock that will beat the market.
Source: LiberatedStockTrader, StockRover, TradingView Data
42. The S&P 500 goes up 55% and down 45% of the time.
My research shows that the S&P 500 increased 55% of the time over the last ten years, by an average of 0.2% per day, and the longest uninterrupted uptrend was eight days.
Source: LiberatedStockTrader Pro
43. The best month to buy stocks is April.
The best month to buy stocks is April, as the S&P500 has increased an average of 2.4% in 15 of the last 20 years. October and November are also good months to buy stocks, rising by 1.17% and 1.08%, respectively, and rising 75% of the time.
Source: The Best Month to Buy Stocks – 40 Years of Analysis
TradingView 4.8/5⭐ : The Best Trading Platform I’ve Tested in 20+ Years
With lightning-fast charts, powerful pattern recognition, smart screening, backtesting, and a global community of 20+ million traders — it’s a powerful edge in today’s markets.

If you want one platform that gives you an edge, this is it.
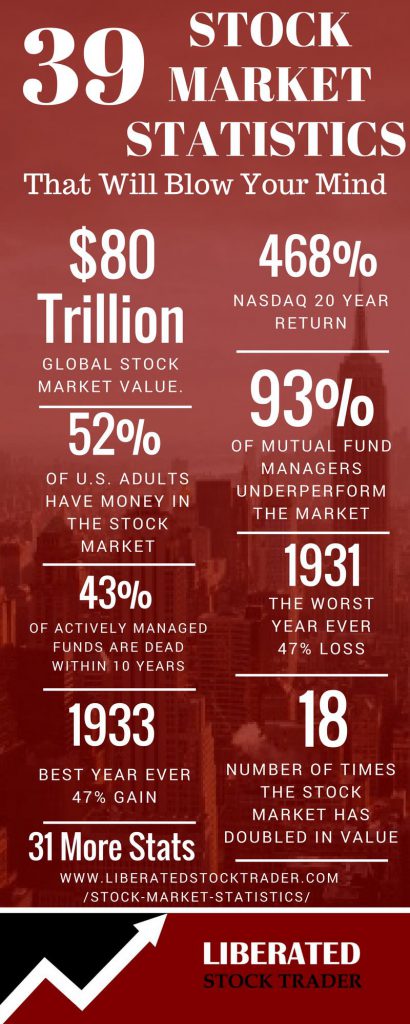
44. 60% of highly paid fund managers fail to beat the S&P 500 benchmark.
Over the last ten years, 82.23% of active fund managers have failed to beat the market index, and in any single year, 60% failed to outperform the S&P 500.
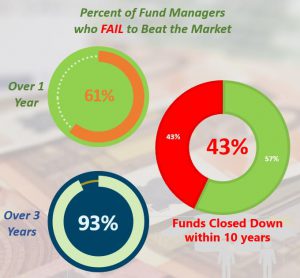
Here, we examine the performance of actively managed funds (Mutual Funds). Fund managers are excellent at making profits for themselves but not so good at making profits for their clients. Over any one year, 60.49% of fund managers failed to beat the market index.
45. Over 100 years, we have had an economic recession every five years
The fear of boom-and-bust cycles is always there for anyone with money in the market. However, for the long-term investor, recessions and crashes can be weathered by staying invested. Let’s take a look at history.
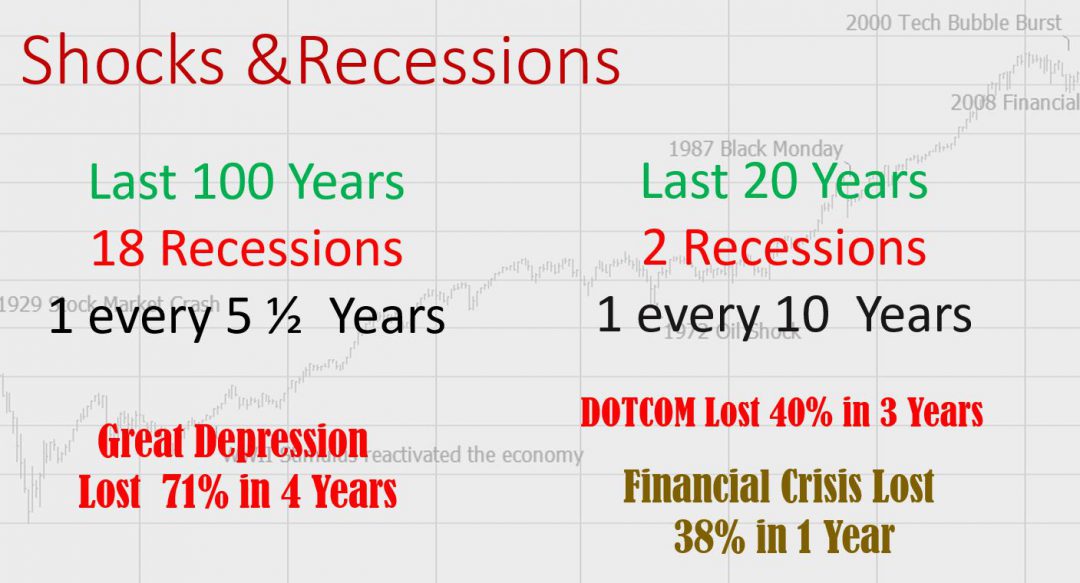
In the past 100 years, we have had 18 economic recessions, averaging one every 5.5 years, which aligns roughly with the business cycle of 4 years.
In the last 24 years (1998 to 2022), we have had three stock market crashes, in 2000, 2008, and 2020, averaging one every eight years.
Source: LiberatedStockTrader Stock Market Crashes
46. The 2000 Dotcom Crash wiped out 40% of the stock market’s value.
The 2000 Dotcom Recession wiped out 40% of the S&P 500’s value over three years, while the Financial Crisis of 2008-2009 wiped out 38% of market value in a single year.
Source: LiberatedStockTrader Stock Market Crashes
The 1929 Great Depression wiped out 71% of the stock market’s value.
Comparatively, the Great Depression wiped out 71% over four years, and the 1974 Shock took out 32% in two years.

Stock Market Yearly Returns – The Best and the Worst
It was the best of times; it was the worst of times. Investing in a low-cost stock market index-tracking fund is one of the simplest and lowest-risk ways to expose yourself to the dynamic wealth creation of the USA or any other major developed economy.
As only 39% of the world’s population is considered free, this limits our choice of safe country indices in which to invest. The U.S., UK, Europe, and Canada are still solid bets.
For this analysis of the best and worst years, we will use the S&P500, the broad U.S. bellwether index, as a solid basis.
Source: LiberatedStockTrader Stock Market Crashes
47. 1933 was the best year in the stock market ever, gaining 46%
The Best Stock Market Years [of the last 90 Years]
First, we will look back fondly at the rip-roaring years of joy. Coming off the back of the great depression, we have 1933 with a joyous 46.59%
Following 1953’s 6.62%, 1954 saw a 45.02% gain.
Again, another great depression rebound rally we have in 1935 with 41.37%
After the 14.31% loss in 1957, we saw a 38.06% loss in 1958. 1927’s pre-depression madness and leverage produced a 37.88% increase.
Finally, the Reagan and Thatcher years yielded Clinton and Blair, which produced 1995’s 34.11% jump. In fact, from 1995 to 1999, we had one of the best Bull Markets ever, yielding an average annual return of 26.3%.
Source: LiberatedStockTrader Stock Market Crashes
Right to Reuse this Research.
Dear Media, Reporters, and Bloggers: if you would like to share this research with your audience, all we ask is that you include a link to this page as the source. For Further Information, please contact us here. Thank You
One data I failed to find anywhere I looked- What is the percentage (by volume, or total assets) of index funds vs Actively managed funds in the overall market…
Could you elaborate on that if you have the data??
Hi Erik, that is indeed a difficult question. The only research we can refer to is a Moody’s report featured on Reuters. https://www.reuters.com/article/us-funds-passive/index-funds-to-surpass-active-fund-assets-in-u-s-by-2024-moodys-idUSKBN15H1PN it suggests that by 2024 Index Tracking Funds will be worth more that Actively Managed Funds.
I hope this helps.
I think the stats about each generation and the likelihood of having an investment account is as expected. The younger the generation the less likely they are to have an investment account. This is probably because they’ve got less disposable income.
This is great research, I had no clue that so many fund managers fail to beat the market, I must think about managing my own investments. I guess it really pays to be invested for long time in market.
Thanks for the facts. I have now retired and am living primarily off the distributions from our closed-end stock funds. Unearned income is king! For any of you thinking about your retirement out there, investing for the long term is the way to go. It’s not glamorous, it does involve sacrifice, but it is the surest way to build a nest egg. Don’t try to get rich quickly; get rich slowly.
Words coming from a true wise investor, thanks Christopher.