A Doji candlestick chart pattern indicates a battle between buyers and sellers, ending in equilibrium. The Doji marks a potential trend reversal.
Is the Doji pattern profitable or accurate? I tested the Doji candle on 8,029 trades spanning 548 years of data, and my results suggest its profitability is marginal.
My research will help you understand Doji candle patterns and, most importantly, test the reality to see if the Doji is reliable, accurate, and worth using for traders.
RESEARCH SUMMARY
- The Doji candle is an unreliable and risky trade with a low accuracy rate of 55.6%.
- The Doji pattern does not predict market direction with certainty.
- A small profit per trade and a low Sharpe ratio of 0.40 are typical outcomes when using the Doji candle pattern.
- This evidence suggests that the Doji pattern should not be used as a primary trading strategy.
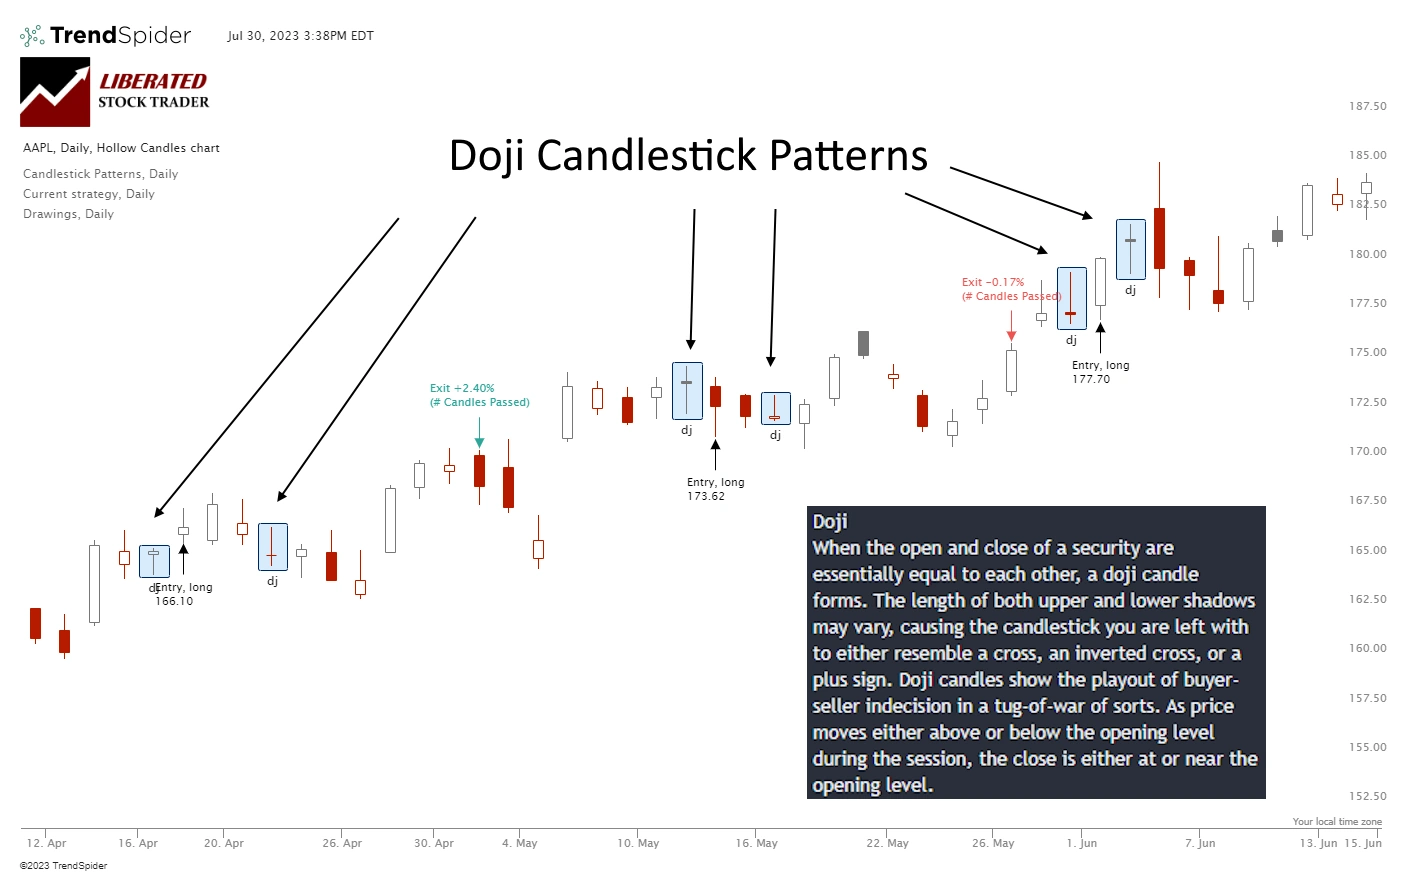
What Is a Doji Candle?
A Doji Candle is a distinctive pattern in candlestick charting used in technical analysis. Its hallmark is that it has virtually the same opening and closing price, giving it a skinny line or “cross” appearance. This pattern indicates a balance of forces, suggesting that a change in the market direction might be imminent.
What Does a Doji Candle Mean?
The Doji candlestick pattern, a popular signal in technical analysis, is believed to indicate that the market has reached a significant turning point. It suggests a delicate balance between buyers and sellers, making it challenging to predict the prevailing direction. This equilibrium could potentially trigger either a reversal of the current trend or a period of consolidation in the short term as market participants reassess their strategies and sentiment.
TrendSpider 4.8/5⭐: My Pick for AI-Power & Auto-Trading
I’ve used TrendSpider for 7 years for my research and testing. It auto-detects trendlines, patterns, and candlesticks, backtests ideas, and lets you use AI to create unique strategies and launch trading bots—with no code.

Types of Doji
There are four primary types of Doji Candles: Standard, Long-legged, Dragonfly, and Gravestone. The standard Doji looks like a cross, whereas the Long-legged Doji, also known as a “Rickshaw Man,” has longer wicks, indicating significant price movement within the period but a close near the opening price. The Dragonfly Doji displays a session wherein the opening and closing prices are at the high of the day, and the Gravestone Doji is its mirror image, with open and close prices at the low of the day.
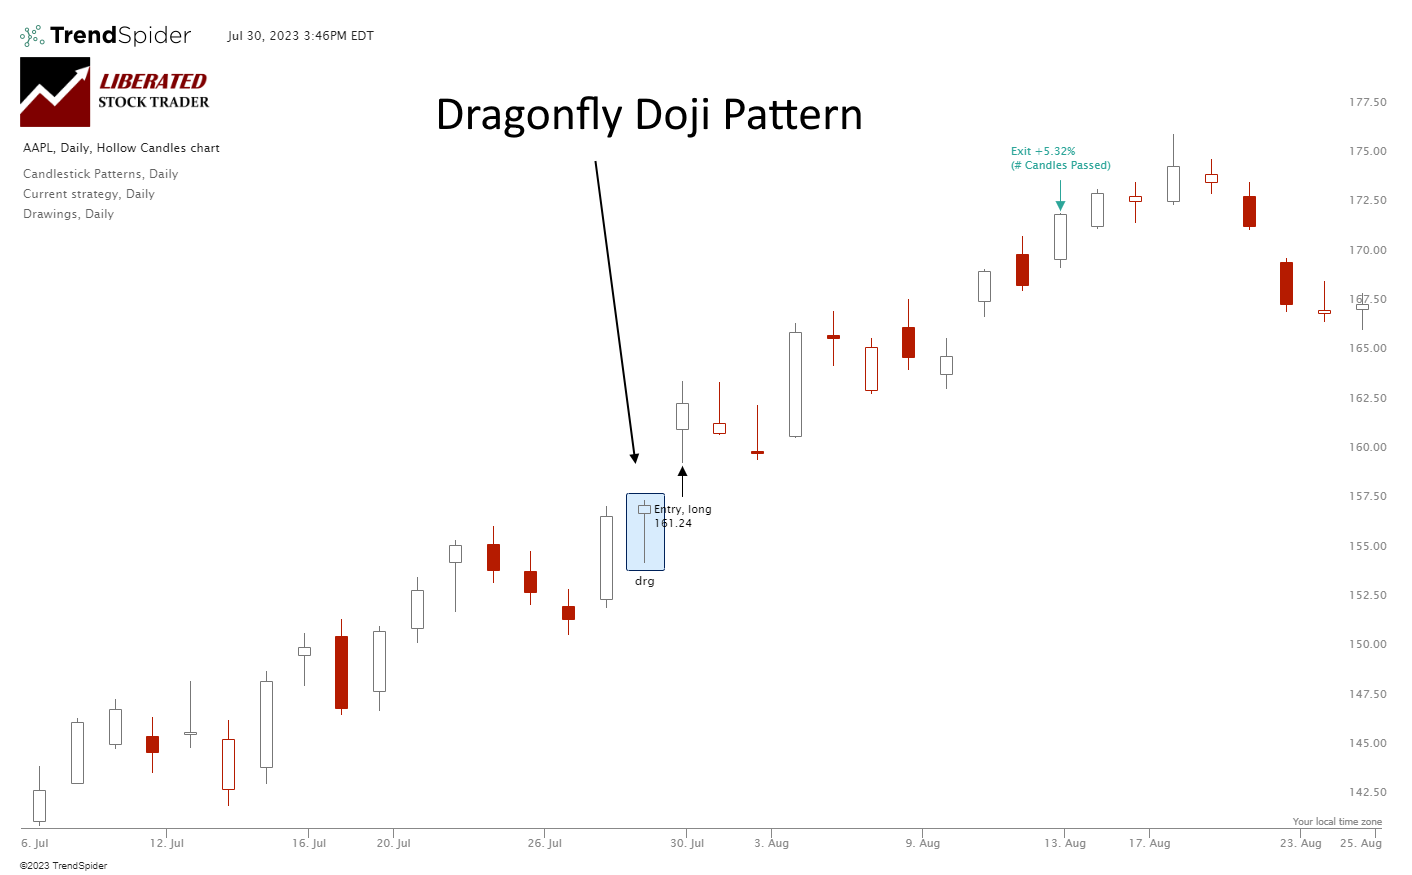
The Dragonfly Doji
The Dragonfly Doji represents a session in which the opening and closing prices are at the same, or very close to, the high of the day, with a long wick underneath representing the day’s low. This indicates that significant selling pressure pushed prices lower during the period, but buyers fought back to push prices to a high for the day.
Try Charting & Pattern Recognition with TrendSpider
This type of candle can sometimes indicate strong bullish sentiment and a potential trend reversal. Conversely, it could also signify a temporary pause in momentum and a possible period of consolidation. Traders will need to consider other market factors and technical indicators to get an accurate interpretation of what this candle implies.
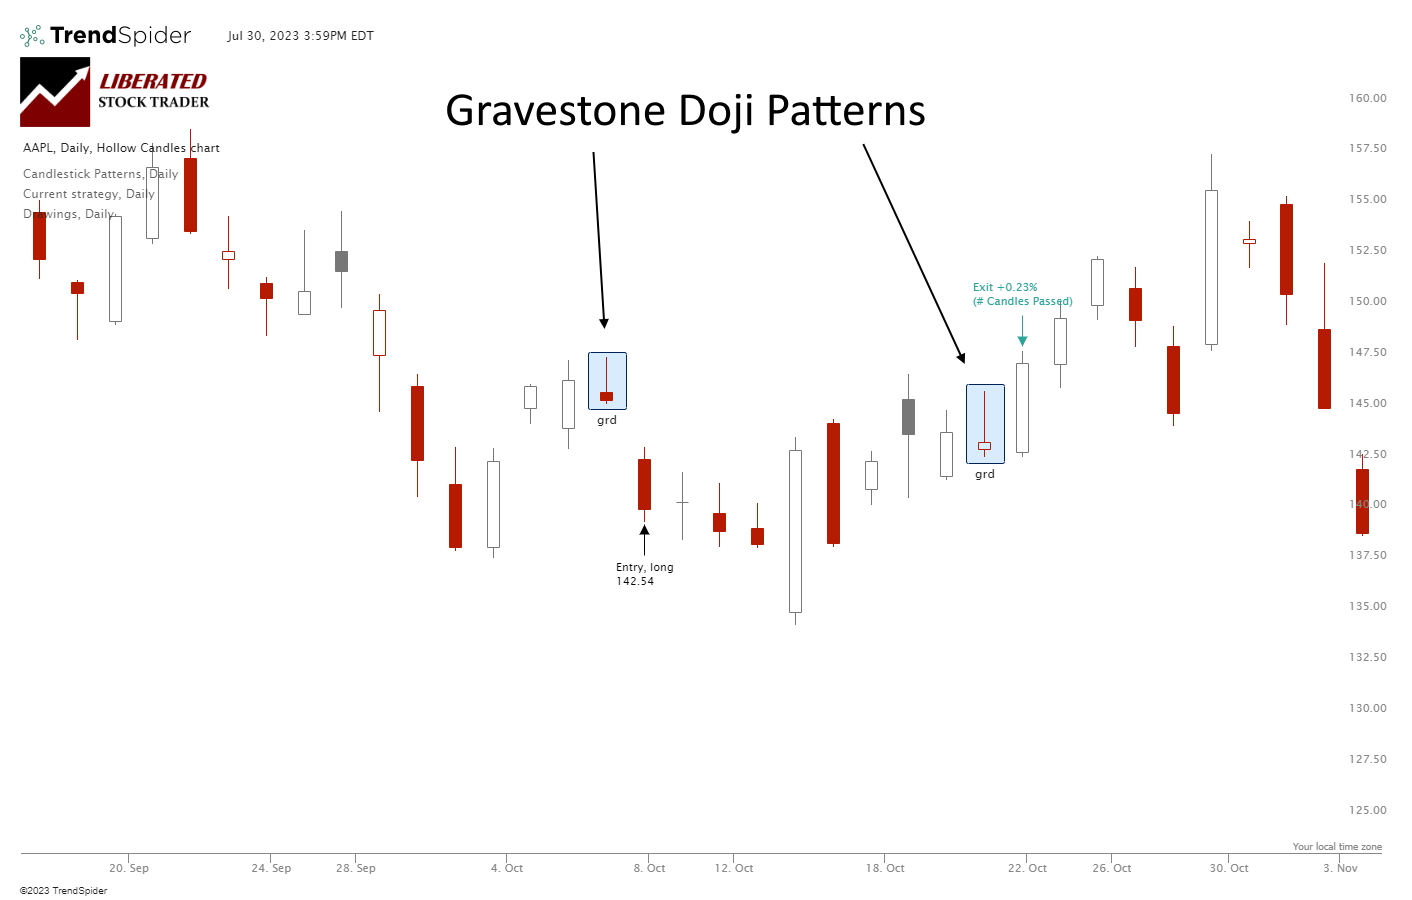
Gravestone Doji
The Gravestone Doji is formed when a session’s open, low, and close are similar. The candle resembles a gravestone, with a long high wick. This signifies that buyers could not advance prices beyond a certain point during the period and that sellers could drive prices back down to near where they opened.
Candle Pattern Recognition with TrendSpider
This type of candle can indicate a bearish sentiment and a potential trend reversal. Stronger confirmation would be required to determine if this is true, but it can be a useful signal to look out for.
Long-legged Doji
The Long-legged Doji (or Rickshaw Man) is formed when the open and close are well within the high and low of the session but with a long upper and lower shadow. This suggests an indecisive market where neither buyers nor sellers could gain control throughout the session; instead, prices moved in both directions as traders tested out levels of support or resistance. This type of Doji can indicate a potential trend reversal and should be closely monitored for confirmation.
Doji Candle Formations
Doji candles indicate market indecision, which could signal potential trend reversals or continuation, depending on the recent price action. Investors should always monitor these formations for confirmation before taking any positions in the market.
The Doji Candle does not tell us much, but its position within the broader market trend is mildly indicative. A Doji appearing after a prolonged uptrend can signal a bearish (downward) reversal. Conversely, following a sustained downtrend, a Doji can indicate a bullish (upward) reversal.
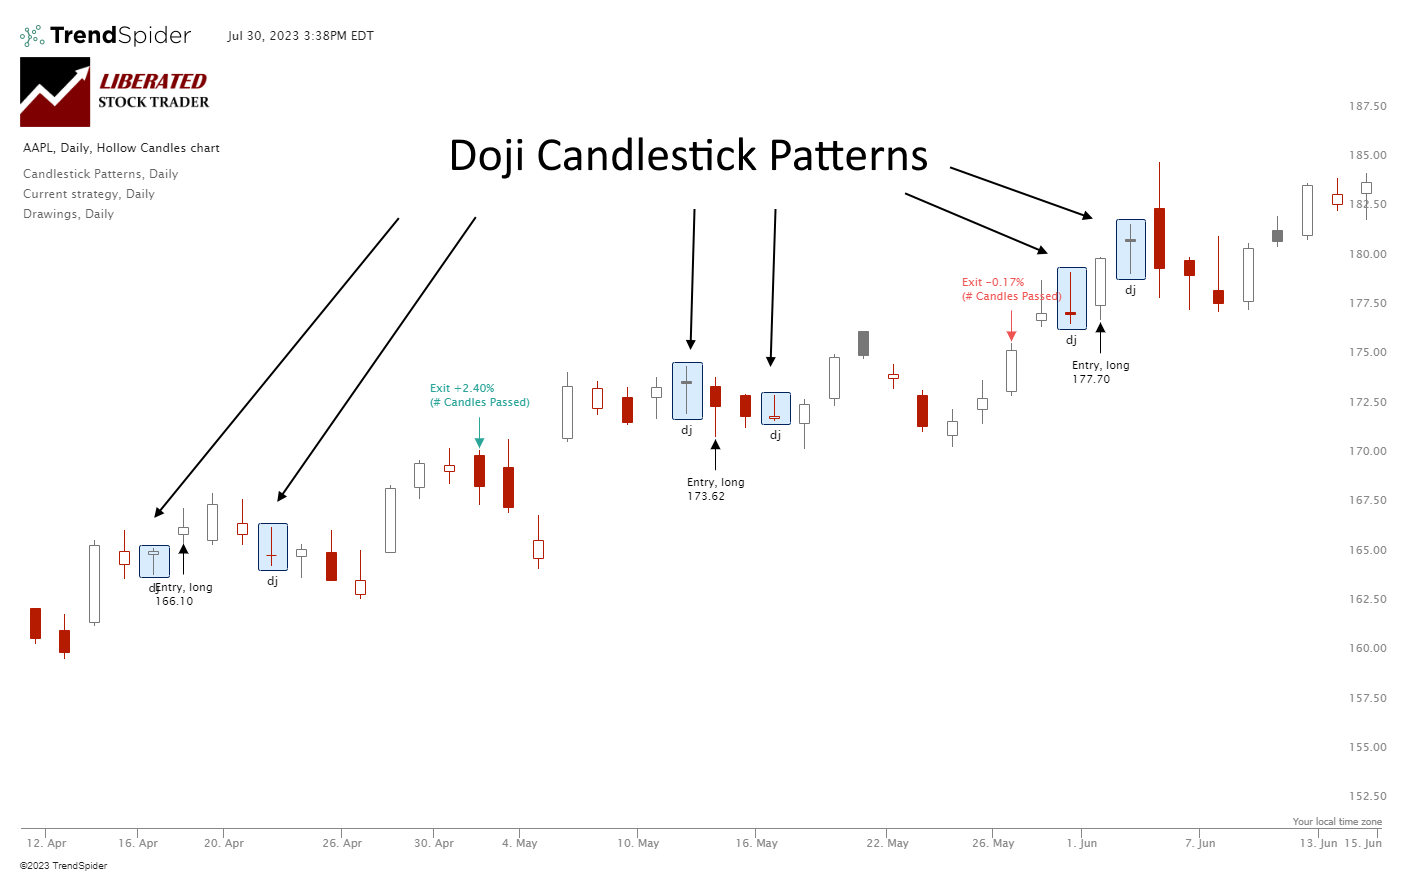
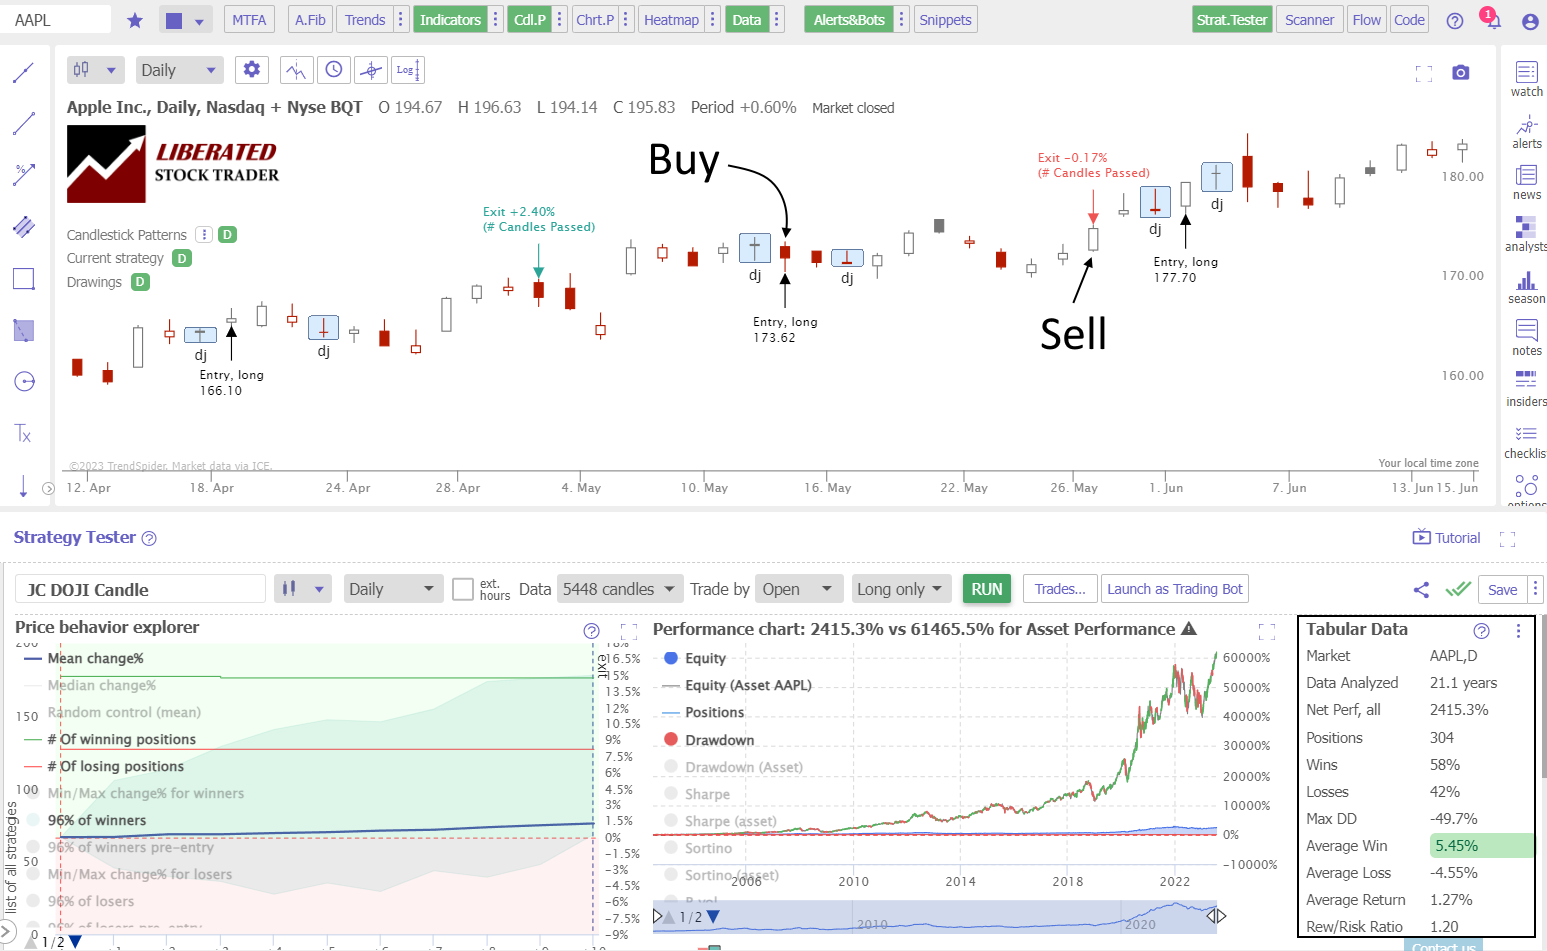
Example: Doji Candles Chart
This detailed chart shows the three Doji candles on an Apple Inc. chart. From left to right, they are the Dragonfly, Long-Legged, Long-Legged, Gravestone, Gravestone, and Rickshaw Man.
How to Trade a Doji Candle?
Trading Doji candles can be very tricky since they provide little information on their own. When trading a Doji candle, the first step is to observe the overall market trend. If it’s in an uptrend, you should look for a bearish reversal; if it’s in a downtrend, then look for a bullish reversal. Once you’ve identified the trend, you should confirm it by looking at other indicators like moving averages or support and resistance levels.
Auto-Trade Candles with TrendSpider
After confirmation of the current trend, enter the trade and consider a stop loss to limit risk. When trading a Doji candle, it’s important to use confirmations in the form of reliable candle patterns, such as an Inverted Hammer or a Bearish Marubozu. Furthermore, indicators such as the Relative Strength Index (RSI) Rate of Change (ROC) or Volume can be used to determine if the trend is likely to reverse or continue.
My Doji Candle Testing
Using TrendSpider, I tested 30 Dow Jones Industrial stocks over 20 years. This amounted to 8029 Doji candle trades and 548 years of data. The Doji candle must be fully formed to enter a trade, and the buy signal must be executed on the next trading day’s open price. Each trade was exited at the open exactly ten days later.
Candle Testing Methodology:
- Pattern: All Doji Candles
- 30 DJIA Stocks
- Daily Chart
- Strategy: Buy Long
- Test Period: 2003 to 2023
- Buy at the next open
- Exit after 10 days
- Pattern Recognition performed by TrendSpider
Backtesting the Doji
Using the award-winning TrendSpider to automatically identify and execute these trades was fast and accurate. To test candlestick patterns and strategies for yourself, please follow these instructions and see the screenshot below for guidance.
- Register for TrendSpider.
- Buy Signal: Select Strategy Tester > Entry Condition > Add Parameter > Condition > Candlestick pattern > Doji > Evolved.
- Sell Signal: Add # Candles Passed = 10.
- Click “RUN” to execute the backtest.
See the image below for the exact configuration.
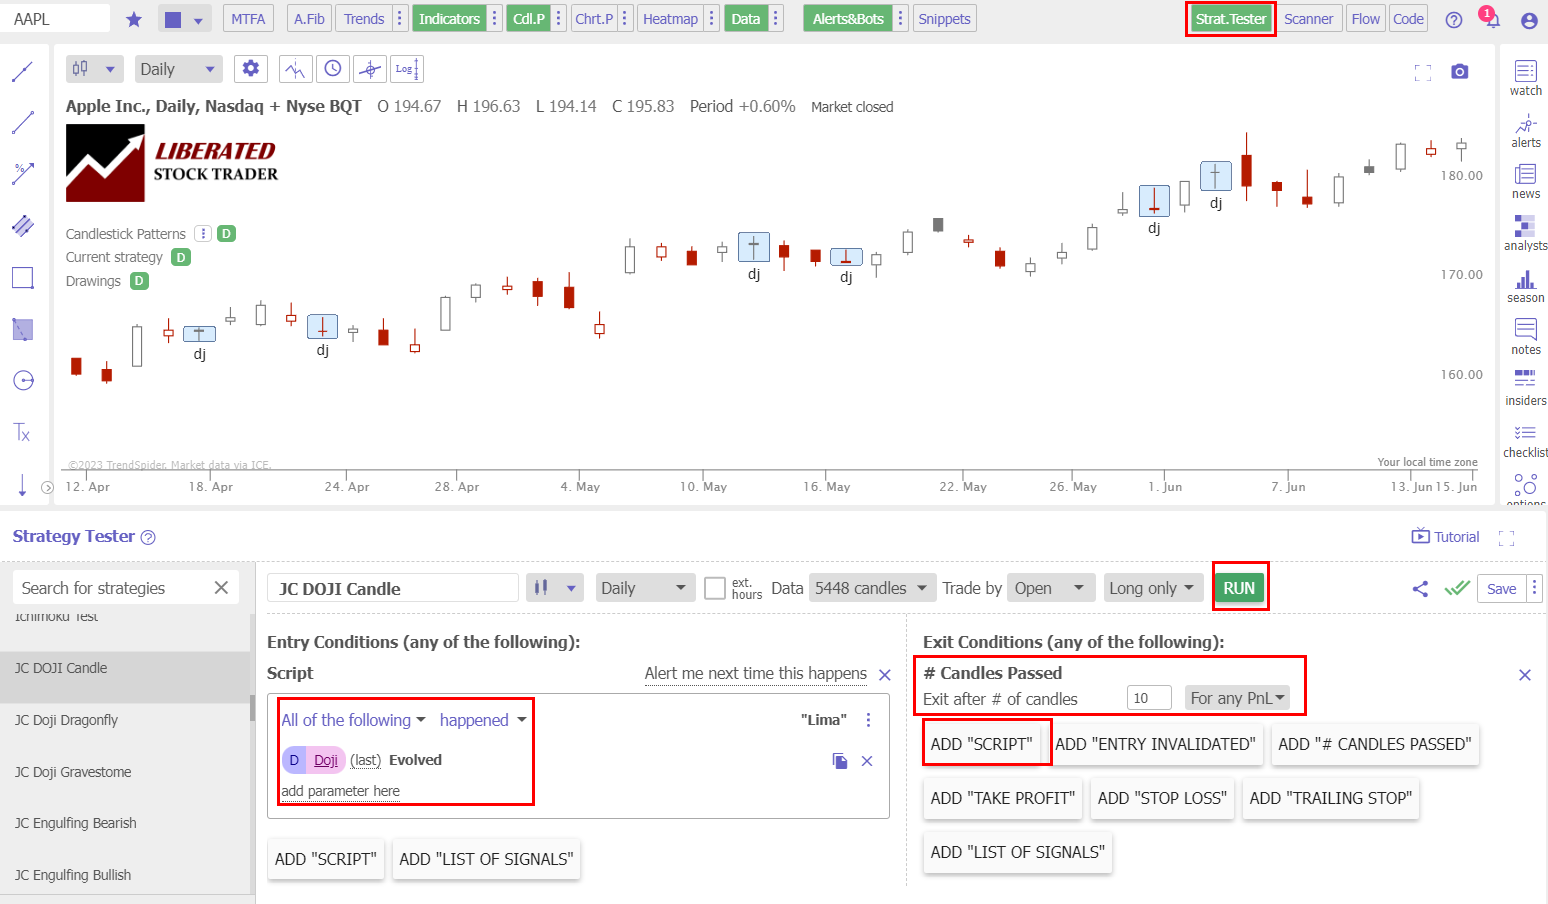
Backtesting Done with TrendSpider
Doji Test Results
After conducting 8029 trades, on 548 years of data, we confirm the Win Rate to be 0.52% per trade. The 0.52% win rate means that trading a Doji candle long will net you an average of 0.52% profit per trade if you sell after ten days. Conversely, short-selling a Doji candle, you should expect to lose 0.52% per trade.
The percentage of winning trades was 55.6% versus 44.4% losing trades; this is about average for the performance across all candlestick types. The Max Drawdown was -47.5%, versus the stocks drawdown of -59.2%, which shows less volatility than a buy-and-hold strategy.
The average winning trade was 3.7% over ten days, but the average losing trade was -3.5%; this represents an incredibly thin profit margin. The reward-to-risk ratio is 1.07, significantly less than many of our backtested and proven chart patterns.
The Sharpe ratio, a measure of risk, is 0.4; a good investment should be higher than 1.0; thus, the Doji candle is considered a risky trade. The Sortino ratio of 0.91 is less than ideal as the target should be 2.0, so again a risky trade.
Doji Candle Test Results Summary
Ultimately, for every long trade you make after a Doji appears on a daily stock chart, on average, you should make 0.52% per trade after holding for ten days. While this is a positive result, this is the average of all candlestick pattern trades we made. The best candlestick for trading is the Inverted Hammer, with a win rate of 0.97%.
Table: Doji Candle Performance Data
| Test Results | Doji Candle |
| Data Analyzed (Years) | 548.7 |
| # Trades | 8029 |
| Wins | 55.6% |
| Losses | 44.4% |
| Max Drawdown | -47.5% |
| Max Drawdown (Asset) | -59.2% |
| Average Win | 3.7% |
| Average Loss | -3.5% |
| Average Return Per Trade | 0.51% |
| Reward/Risk Ratio | 1.07 |
| Sharpe Ratio | 0.40 |
| Sortino Ratio | 0.91 |
Does the Doji Candle Work?
Yes, the Doji candle does work in trading, but not like most traders think. The evidence of 8,032 trades suggests that the Doji is not a significant indicator of trend changes or reversals. The average win rate for a Doji candle long trade is 0.52%. If you sell a Doji short, it will average a 0.52% loss.
Is a Doji Candle Accurate?
A Doji candle is an inaccurate pattern to trade; it results in 55.6% of trades winning and 44.4% of trades losing, plus the average winning trade is 3.7% and losing trade is -3.5%. I believe the Doji candle is only profitable on long trades because of the inherent upward bias of the stock market. Shorting Dojis results in an average 0.52% loss.
Can the Doji Candle be used for Buy and Sell Signals?
Yes, the Doji can be used as a buy & sell signal, but I do not recommend it. Its accuracy is far from perfect and should not be relied upon as the sole indicator for making trades. In 8,032 trades, the Doji candle buy signal was accurate only 55.6% of the time.
Is a Doji Candle Bullish or Bearish?
Our test results show that a Doji candle is not bullish or bearish; it simply indicates an equilibrium between buyers and sellers. In any ten days following a Doji, the market moves up 55% and down 45%; this move is due to the market’s positive bias, not due to any predictive quality of the Doji candle.
Is a Doji Candle Reliable?
No, according to 8,032 tested trades, a Doji candle is unreliable. The Doji has a low accuracy rate of 55.6%, resulting in a razor-thin 0.51% profit per trade. Factoring in a very low Sharpe ratio of 0.40 indicates this is an unreliable and risky trade.
Therefore, I would not recommend using the Doji pattern for trading.
Is a Doji Candle a Reversal Pattern?
No, the Doji candle is not a reliable reversal pattern. The results from 8,032 tested trades show that the Doji does not conclusively indicate a market reversal. The Doji has a low accuracy rate of 55.6%, meaning it fails to predict market direction over 44% of the time.
Summary
In conclusion, the Doji candle is an unreliable and risky trade. It has a low accuracy rate of just 55.6%, resulting in a small profit per trade and a low Sharpe ratio of 0.40. Additionally, it does not conclusively indicate market reversals.
The evidence recommends against using the Doji pattern for trading. All traders would benefit from investing in a comprehensive trading training course to help them make more informed decisions while managing their risks properly. So why not check out Liberated Stock Trader’s advanced investing course today?
You want to be a successful stock investor but don't know where to start.
Learning stock market investing on your own can be overwhelming. There's so much information out there, and it's hard to know what's true and what's not.

Liberated Stock Trader Pro Investing Course
Our pro investing classes are the perfect way to learn stock investing. You will learn everything you need to know about financial analysis, charts, stock screening, and portfolio building so you can start building wealth today.
★ 16 Hours of Video Lessons + eBook ★
★ Complete Financial Analysis Lessons ★
★ 6 Proven Investing Strategies ★
★ Professional Grade Stock Chart Analysis Classes ★
FAQ
What is the best software for candlestick trading?
TrendSpider is the best software for trading candlestick patterns because of its integrated candle backtesting and pattern recognition. If you value a large community of traders sharing ideas and strategies, then TradingView is a perfect alternative.
What is a Doji candle?
A Doji candle is a candlestick pattern that signifies market indecision. It occurs when the open and close of the candle are of roughly equal magnitude, typically within 10% of each other. According to our tests, the Doji should be avoided for trading as it is not predictive.
How can I recognize a Doji candle?
A typical Doji candle will have an open and close price nearly equal. If you're looking for this pattern on your charts, it's recognizable by its single or multiple long shadows with little to no body.
What software can recognize candle patterns?
The leading chart pattern recognition software for candlesticks is TradingView, TrendSpider, and Finviz. See how they compare in our best pattern recognition software comparison review.
Why is the Doji candle so popular?
The Doji candle is popular because its name and distinctive shape are easy to remember and identify for traders. According to our testing, the facts are that the Doji are not popular because they are effective, reliable, or highly profitable.
Why is the Doji candle important in trading?
The Doji candle is important in trading because traders believe it is significant. The results of our testing confirm it is an unimportant pattern with little predictive integrity and should be avoided.
Is the Doji Candle reliable?
No, the accuracy rate of using the Doji Candle for predicting market direction is only 55.6%, so it isn't reliable enough for consistent profits. Additionally, its low Sharpe ratio of 0.40 suggests it isn't worth using as a primary indicator for making trade decisions.
What other indicators should I use with a Doji Candle?
To make more informed trading decisions, consider using other technical indicators such as volume, relative strength index (RSI), moving averages, and rate of change (ROC) with Dojis. This will help corroborate market movements based on proven indicators.
What strategies I should use when trading with Dojis?
Yes, one strategy involves waiting for confirmation before entering into any trade after a doji appears on the chart. This means waiting until another candlestick forms following the initial Doji to confirm any trend change has occurred before executing any trades.