The Hammer candlestick is a popular chart pattern that suggests bullish sentiment after a day of trading volatility. The Hammer is easily recognizable and occurs frequently on charts, but is it profitable or reliable?
To discover the facts, I backtested 2,219 Hammer trades on 549 years of trading data spanning bull and bear markets. My results are shocking.
According to my 2,219 tested trades, a Hammer is extremely unreliable and unprofitable. It has a low % accuracy rate of 52.1%, resulting in a razor-thin 0.18% profit per trade. Factoring in a very low Sharpe ratio of -0.05 indicates this is an unreliable and risky trade.
RESEARCH SUMMARY
- My results suggest that the Hammer pattern should not be used in any trading strategy.
- The Hammer is an unreliable and risky pattern with a low accuracy rate of 52.1%, which is hardly better than flipping a coin.
- The Hammer pattern does not reliably predict market direction.
- A small profit per trade of 0.18% and a low Sharpe ratio of -0.05 suggest that trading the Hammer is highly risky.
What Is a Hammer Candle?
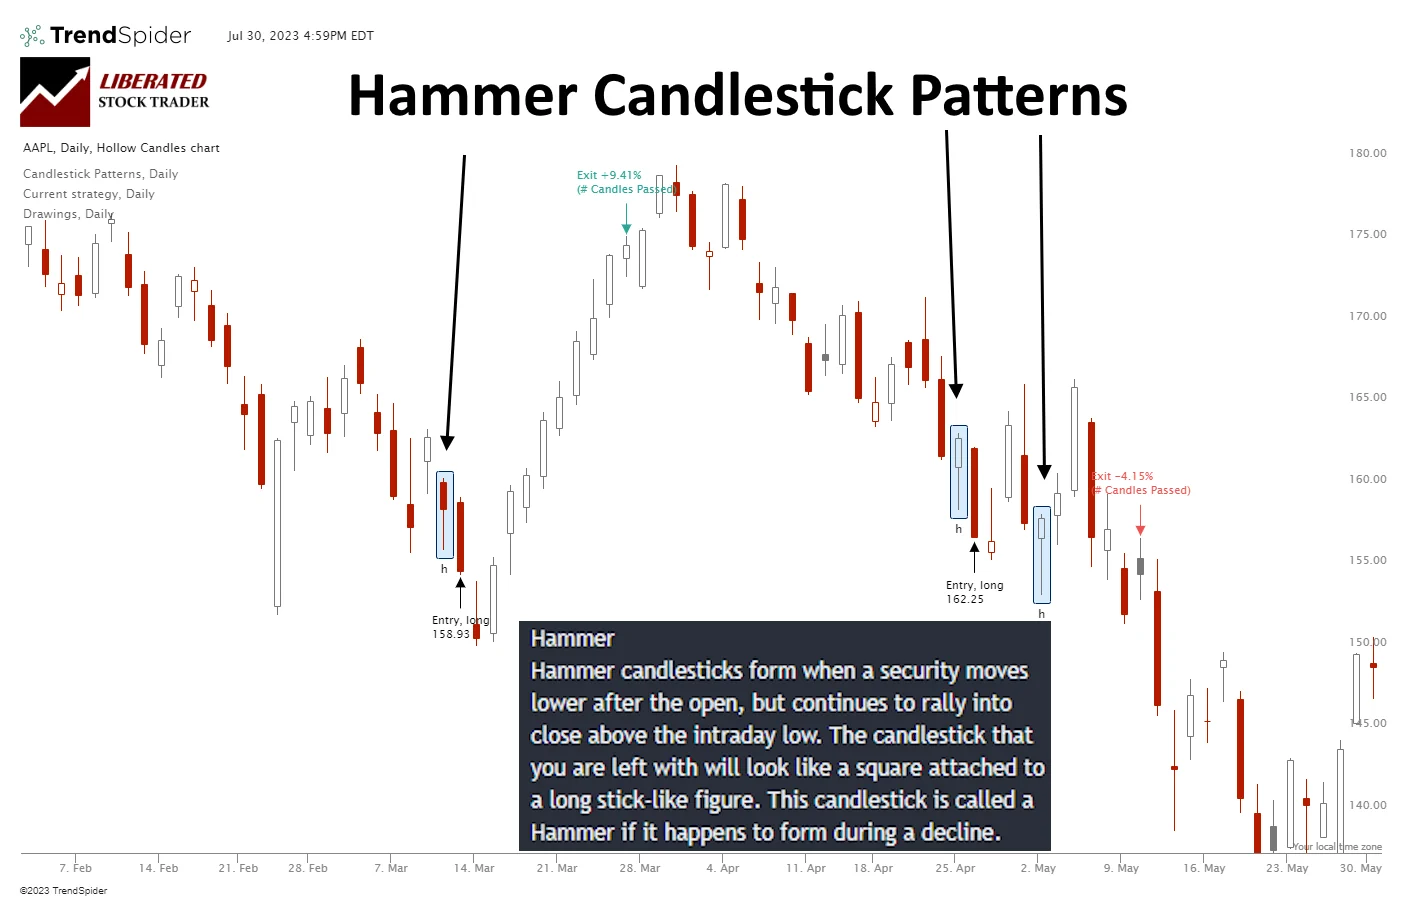
A Hammer candle is a popular pattern in technical chart analysis. It is characterized by a small body and a long lower wick, resembling a hammer, hence its name. The hammer candle typically appears at the end of a downtrend, indicating a potential reversal in price movement.
Traders interpret this pattern as a signal of bullish sentiment, where the market is attempting to reject lower prices, evidenced by the long lower wick. However, the confirmation of a trend reversal is usually obtained from the candles succeeding the hammer candle.
What Does a Hammer Candle Mean?
When a Hammer candle occurs, it represents a potential turning point in the market. Traders see it as a signal that the market could soon be reversing from a downtrend to an uptrend. This candlestick pattern is supposedly an indication that the selling pressure at the opening of the trading period has been overcome by buying pressure, pushing the price back up and closing near the opening level.
Traders believe this signifies buyers gaining momentum against sellers, heralding a potential bullish trend. But are they correct in their assumption? Our decades of research suggest this theory is completely wrong.
Types of Hammer Candle
There are two types of Hammer candles: the Hammer and the Inverted Hammer. While the Hammer is a low probability trade and one of the poorest performing candlestick patterns we have tested, the Inverted Hammer is the opposite. The Inverted Hammer looks like an upside-down Hammer and is the most profitable of all candle patterns.
The Inverted Hammer typically manifests at the bottom of a downtrend, hinting at a potential shift in the price trajectory. It signals a bullish sentiment, denoting that the market is trying to push prices higher, as indicated by the extended upper wick. However, the sellers regain control by the close of the trading period, pushing the price down to close near the opening level, thus creating a small body at the bottom.
TrendSpider 4.8/5⭐: My Pick for AI-Power & Auto-Trading
I’ve used TrendSpider for 7 years for my research and testing. It auto-detects trendlines, patterns, and candlesticks, backtests ideas, and lets you use AI to create unique strategies and launch trading bots—with no code.

Save 38% on TrendSpider
Our Top Rated 4.72 ⭐ Trading Tool
✅ Leader in AI Trading & Chart Pattern Recognition
✅ Scanning & Auto-Trading
Deal Ends In:
Hammer Candles in Charts
A Hammer Candle occurs when the opening, high, and close prices are roughly the same, and there’s a significantly lower wick at least twice the size of the small body. The candle’s body can be either bearish (red) or bullish (green), but the bullish variant is considered more significant.
In the context of a downtrend, the market opens, and sellers push the prices down significantly, which is reflected by the long lower wick. However, buyers step in by the end of the trading period and push the price back up to near where it opened, creating the small body at the top of the candle.
Candle Pattern Recognition with TrendSpider
The Hammer candle supposedly indicates bullish sentiment and a potential trend reversal, but our testing proves this theory wrong.
The Psychology of the Hammer
The psychology behind the Hammer pattern is that sellers initially have the upper hand, driving prices down. However, the buyers eventually step in and rally, driving the price back up to the opening level. This shift in momentum indicates that the selling pressure is being exhausted, and a potential reversal might be on the horizon. The Hammer Candle, therefore, represents a tug-of-war that ends with the buyers gaining ground, potentially signaling the beginning of a bullish trend.
But is the Hammer really a bullish pattern? Our research goes against popular opinion based on data.
Is a Hammer a Bullish Reversal Pattern?
No, according to our testing, the Hammer is not a bullish reversal pattern. The results from 2,219 tested trades show that the Hammer does not conclusively indicate any future price move. The Hammer’s low 52.1% accuracy rate means it fails to predict market direction 48.9% of the time.
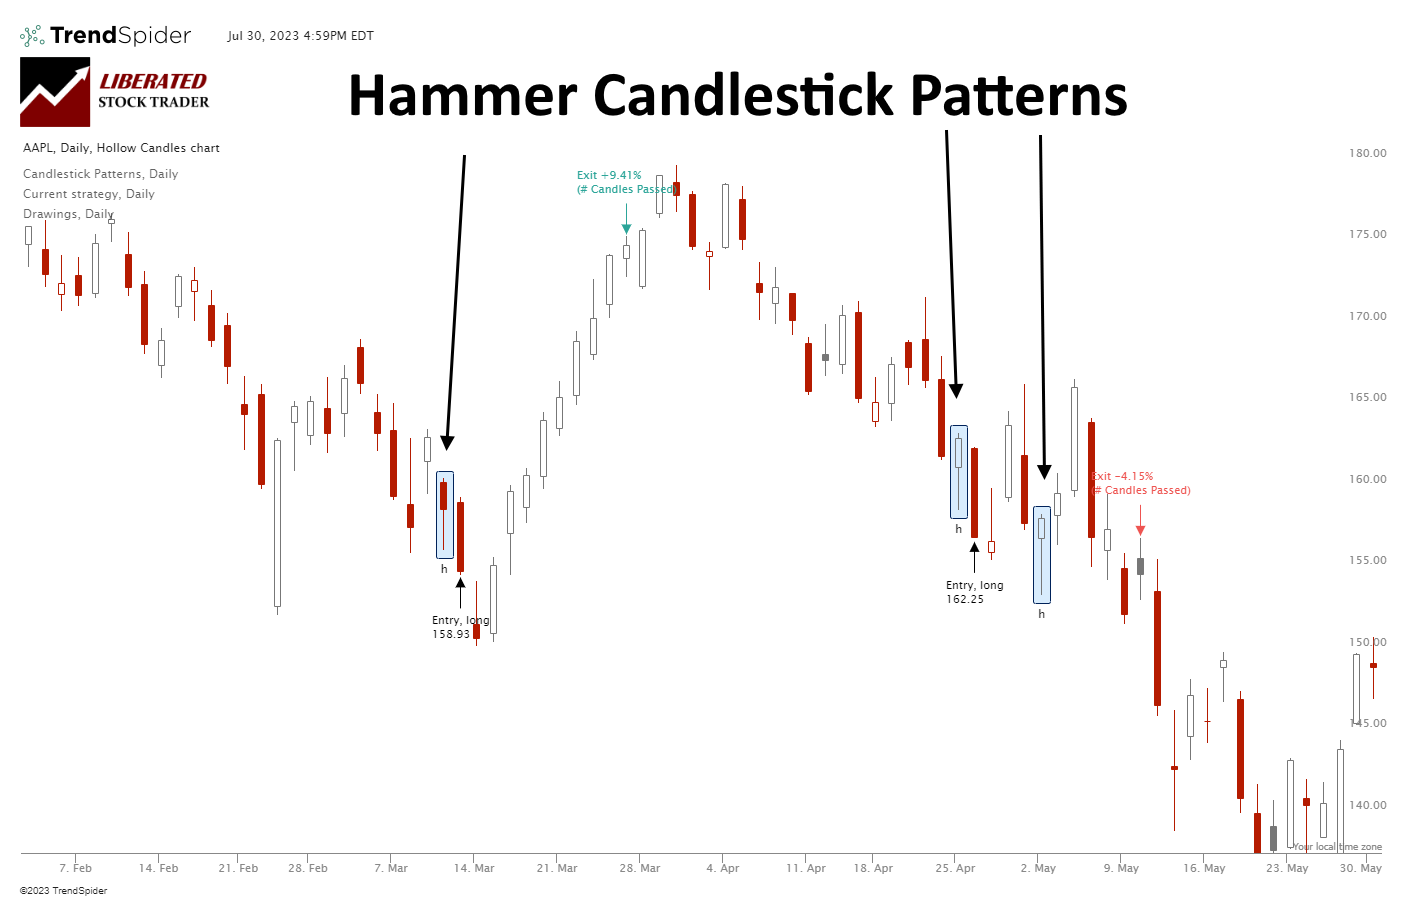
As you can see in the chart above, the Hammers occur during uptrends and downtrends, but they rarely signal a price reversal. This unreliability is reflected in our testing, which indicates that Hammers are not indicative of any future price move.
Trading a Hammer Candle
Trading Hammers is not recommended as they do not offer reliable predictive information. While the Hammer signifies a bullish end to the trading day, this does not guarantee the next day will be positive. However, there are some cases where this pattern with a very long body can be traded for profit after a strong downtrend. But I advise checking this hypothesis with your own backtesting before trading this pattern.
Our backtesting data (see the screenshot below) shows a winning and losing trade on Apple Inc. The winner made a 9.41% profit in 10 days. The losing trade lost -4.15%. In fact, trading Apple stock for over 20 years, the Hammer worked well with a 58% win rate and an average return of 1.01% per trade.
But is this because the Hammer was predictive or because Apple Inc. is in a continual uptrend? The evidence across all stocks suggests the latter.
Auto-Trade Candles with TrendSpider
When engaging in Hammer trading, it is crucial to employ confirmations through reliable candle patterns, such as Inverted Hammer or Bearish Marubozu. Additionally, reliable indicators like the Relative Strength Index (RSI), Rate of Change (ROC), or Volume can aid in assessing the likelihood of a trend reversal or continuation. By optimizing your approach with these techniques, you can enhance both the quality and effectiveness of your trading strategy.
My Hammer Candle Testing
Using TrendSpider, I tested 30 Dow Jones Industrial stocks over a 20-year span. This amounted to 2,219 Hammer trades and 549 years of data. The Hammer must be fully formed to enter a trade, and the buy signal must be executed on the next trading day’s open price. Each trade was exited at the open exactly ten days later.
Candle Testing Methodology:
- Pattern: Hammer
- 30 DJIA Stocks
- Daily Chart
- Strategy: Buy Long
- Test Period: 2003 to 2023
- Buy at the next open
- Exit after ten days
- Pattern Recognition performed by TrendSpider
Backtesting the Hammer
Using TrendSpider for trade identification and execution gives fast and precise results. To evaluate candlestick patterns and strategies independently, follow the instructions below and check out the screenshot for reference.
- Register for TrendSpider.
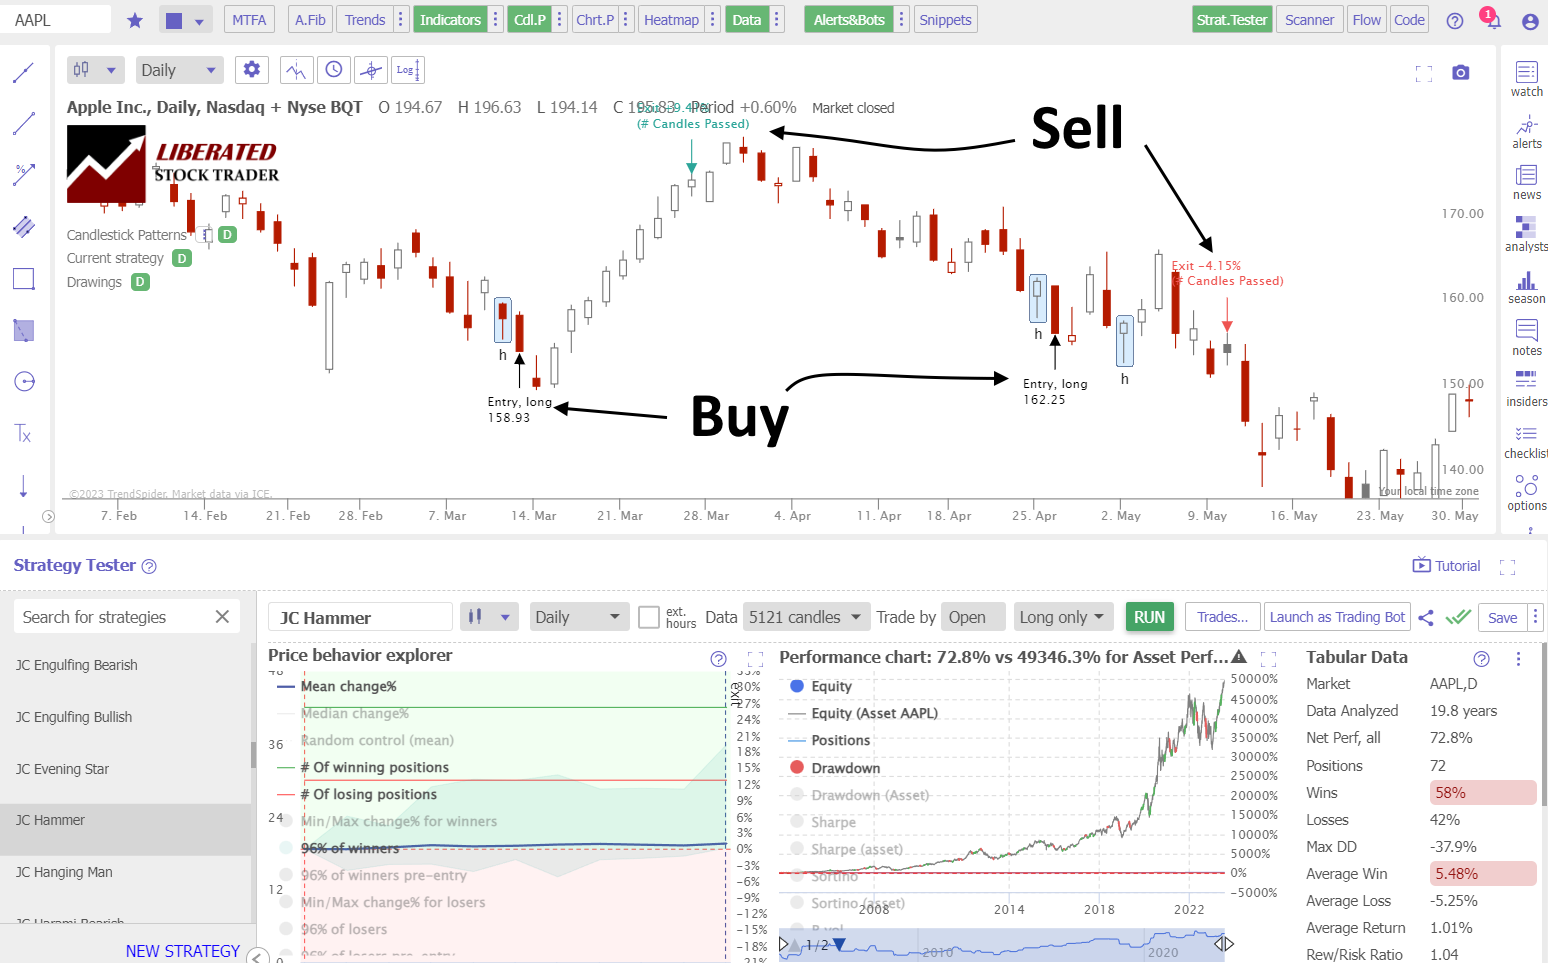
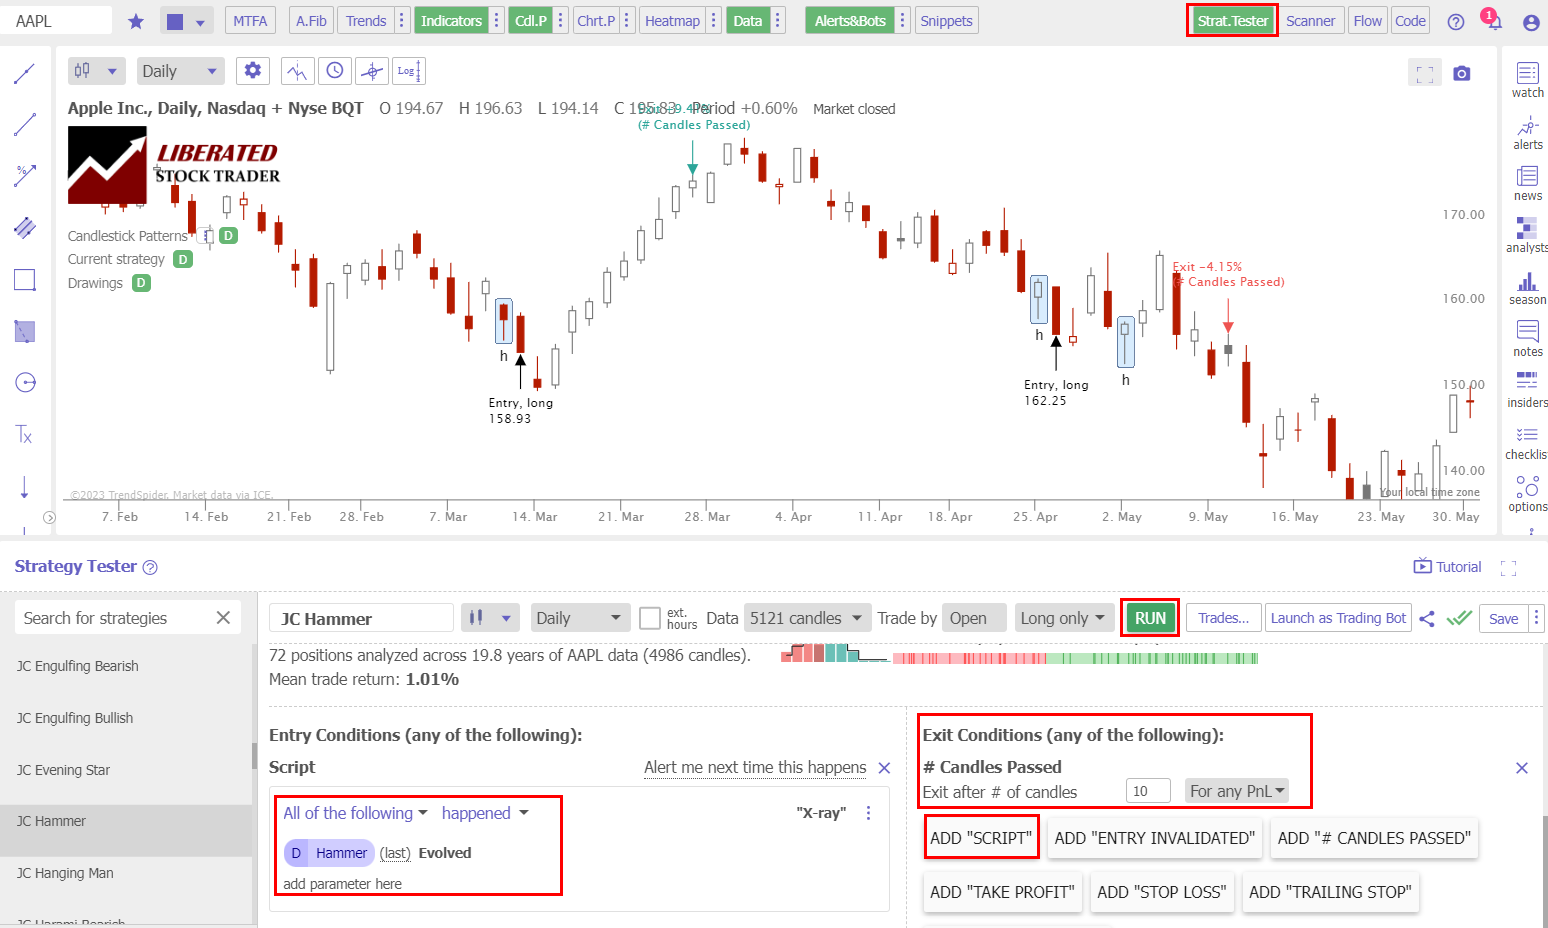
- Buy Signal: Select Strategy Tester > Entry Condition > Add Parameter > Condition > Candlestick pattern > Hammer > Evolved.
- Sell Signal: Add # Candles Passed = 10.
- Click “RUN” to execute the backtest.
Backtesting Done with TrendSpider
Test Results
After conducting 2,219 trades on 575 years of data, we confirm the Hammer profit per trade to be 0.18%. A 0.18% win rate means that trading a Hammer long will net you an average of 0.18% profit per trade if you sell after ten days. Conversely, short-selling a Hammer, you should expect to lose 0.18% per trade.
The percentage of Hammer winning trades was 52.1% versus 47.9% losing trades, slightly lower than the 55.8% average performance across all candlestick types. The Max Drawdown was -36.2%, versus the stock’s drawdown of -58.2%, which shows less volatility than a buy-and-hold strategy.
The average winning trade was 3.6% over ten days, but the average losing trade was also -3.6%; this represents an incredibly thin profit margin that should not be traded. The reward-to-risk ratio is 1.01, significantly less than many of our backtested and proven chart patterns.
The Sharpe ratio, a measure of risk, is -0.05; a good investment should be higher than 1.0; thus, the Hammer is considered the most risky candle trade of all. The Sortino ratio of 0.25 is also incredibly poor as the target should be 2, so again, it is a very risky trade.
Test Results Summary
Ultimately, for every long trade you make after a Hammer appears on a daily stock chart, on average, you should make 0.18% after holding for ten days. This terrible result makes the Hammer one of the worst candlestick pattern trades.
Conversely, the best candlestick for trading is the Inverted Hammer, with a profit per trade of 0.97%, nearly 5 times better than the Hammer candle.
Table: Hammer vs. Inverted Hammer Candle Performance Data
| Hammer Test Results | Inverted Hammer | Hammer |
| Data Analyzed (Years) | 491 | 549 |
| # Trades | 1664 | 2219 |
| Wins | 60.3% | 52.1% |
| Losses | 39.8% | 47.9% |
| Max Drawdown | -21.6% | -36.2% |
| Max Drawdown (Asset) | -45.9% | -58.2% |
| Average Win | 3.9% | 3.6% |
| Average Loss | -3.5% | -3.6% |
| Average Return Per Trade | 0.97% | 0.18% |
| Reward/Risk Ratio | 1.30 | 1.01 |
| Sharpe Ratio | 0.19 | -0.05 |
| Sortino Ratio | 0.51 | 0.25 |
My groundbreaking research into the profitability and success rates of chart patterns and technical indicators is built on the most powerful backtesting platforms available. If you want to design original, profitable trading strategies, our exclusive review of the best backtesting software will help you find the perfect solution to give you a real edge in the markets.

Does the Hammer Candle Work?
No, the Hammer does not work in trading, producing a 52.1% success rate. The average profit per trade for a Hammer is small, only 0.18% after ten days. If you sell it short, it will average a 0.18% loss. Such small wins will be erased by slippage and trading costs.
Is a Hammer Candle Accurate?
No, a Hammer is one of the most inaccurate patterns to trade; it results in 52.1% of trades winning and 47.9% of trades losing, plus the average winning trade is 3.6% and losing trade is -3.6%. Using a Hammer is no better than flipping a coin.
Can the Hammer Candle be used for Buy and Sell Signals?
No, our data shows the Hammer should never be used for buy and sell signals. Its accuracy is incredibly poor and should not be relied upon. In 2,219 trades, the Hammer buy signal was only 52.1% accurate and yielded just 0.18% profit.
Is a Hammer Candle Bullish or Bearish?
The evidence of 2,219 trades suggests that the Hammer is not significantly bearish or bullish. Our test results show that a Hammer is 52.1% bullish and 47.9% bearish. In any ten days following a Hammer, the market moved up 52% and down 48%; this move is due to the market’s positive bias, not due to any predictive quality of the Hammer.
Is a Hammer Candle Reliable?
According to my 2,219 tested trades, a Hammer is extremely unreliable and unprofitable. It has a low % accuracy rate of 52.1%, resulting in a razor-thin 0.18% profit per trade. Factoring in a very low Sharpe ratio of -0.05 indicates this is an unreliable and risky trade.
Therefore, I would not recommend using the Hammer pattern for trading.
Summary
In conclusion, the Hammer is one of the most unreliable and risky trades in technical analysis. It has a low accuracy of 52.1%, resulting in a small profit per trade of 0.18%. It does not conclusively demonstrate any predictive qualities.
The Hammer is unprofitable for long trades lasting ten days and is not recommended for trading due to the narrow margins. Additionally, slippage and fees will wipe out any profits gained.
All traders would benefit from investing in a comprehensive trading training course to help them make more informed decisions while managing their risks properly. So why not check out Liberated Stock Trader’s advanced investing course today?
You want to be a successful stock investor but don't know where to start.
Learning stock market investing on your own can be overwhelming. There's so much information out there, and it's hard to know what's true and what's not.

Liberated Stock Trader Pro Investing Course
Our pro investing classes are the perfect way to learn stock investing. You will learn everything you need to know about financial analysis, charts, stock screening, and portfolio building so you can start building wealth today.
★ 16 Hours of Video Lessons + eBook ★
★ Complete Financial Analysis Lessons ★
★ 6 Proven Investing Strategies ★
★ Professional Grade Stock Chart Analysis Classes ★
FAQ
What is a Hammer Candle?
The Hammer is a Japanese candlestick pattern representing a potential bullish market turning point. Traders believe the market could soon reverse from a downtrend to an uptrend. But these popular beliefs are not borne out by our data-based research.
What is the best platform for Hammer candle chart trading?
TrendSpider is the best software for trading candlestick patterns due to its integrated candle backtesting and pattern recognition. If you value a large global community of traders sharing ideas and strategies, then TradingView is a great alternative.
How can I recognize a Hammer Candle?
To identify a Hammer, look for a small square body at the top of the candle, which can be either red or green. Next, observe the presence of a long lower wick, at least twice the size of the body, resembling a hammer's handle.
What software automatically detects candle patterns?
TrendSpider, TradingView, and Finviz are pioneering candlestick pattern recognition software. See how they compare in our best pattern recognition software comparison review.
Why is the Hammer candle popular?
The Hammer candle is popular among traders because its distinctive shape and characteristics make it easy to spot on a price chart, even for novice traders. However, our data suggest many traders lose out when trading this pattern as it has no predictive qualities.
Is the Hammer Candle reliable?
No, the Hammer candle's reliability for predicting market direction is only 52%, making it incredibly poor for consistent profits. Conversely, according to our data, the Inverted Hammer pattern is the most reliable candle pattern, with a 60% win rate and 1% profit per trade.
Why is the Hammer candle important in trading?
The Hammer's significance is because traders tend to attribute importance to it. However, our testing shows it is an insignificant pattern with no predictive integrity, rendering it advisable to steer clear of it.
What indicators should I use with a Hammer Candle?
It is advisable to use indicators such as relative strength index (RSI), moving averages, and rate of change (ROC) in conjunction with Hammer patterns. Our deep research and analysis have proven these indicators successful.
What strategy should I use when trading Hammers?
The best strategy to use when trading a Hammer is to avoid it at all costs. Due to its low predictive quality, the Hammer should never be used in trading.