The Wall Street Cheat Sheet considers the psychological aspects of market cycles. It visualizes the range of emotions traders and investors experience at various stages of an investment cycle.
Our free interactive Wall Street Cheat Sheet helps you get ahead of the game by navigating the emotional highs and lows that investors face during market cycles.
The Wall Street Cheat Sheet embodies sentiment troughs and peaks, from overwhelming fear to exuberant greed, and is often utilized to gauge investor behavior within these cycles.
By analyzing these emotional responses to market fluctuations, the Cheat Sheet provides a simplified perspective on the complex mechanisms of the financial markets.
Key Takeaways
- The Wall Street Cheat Sheet encapsulates the range of emotions investors experience during market cycles.
- Patterns in investor sentiment are a critical aspect of understanding and navigating the markets.
- Recognizing emotional cycles can inform risk assessment and trading strategies.
Understanding the implications of the Cheat Sheet helps investors and traders navigate the markets more effectively. It reminds us of the recurrent nature of market sentiment, highlighting that investor psychology tends to repeat itself in a cyclical pattern.
Recognizing these patterns can help traders anticipate market movements and improve their decision-making processes. Although it’s not a fail-proof guide to predicting market trends, the Wall Street Cheat Sheet is a tool that can provide insightful context to market indicators and behavior when combined with other strategies and risk assessments.
Understanding Market Cycles
Our free interactive Wall Street Cheat Sheet helps you get ahead of the game by navigating the emotional highs and lows that investors face during market cycles. Each phase reflects a collective sentiment that can influence financial markets and, subsequently, stock price movements.
Market cycles represent the recurring fluctuations observed in financial markets and can be identified through changes in stock prices. Factors such as economic indicators, corporate performance, and investor sentiment drive these cycles.
Phases of the Wall Street Cheat Sheet
The Wall Street Cheat Sheet encapsulates the typical emotional journey of investors through the different stages of a market cycle:
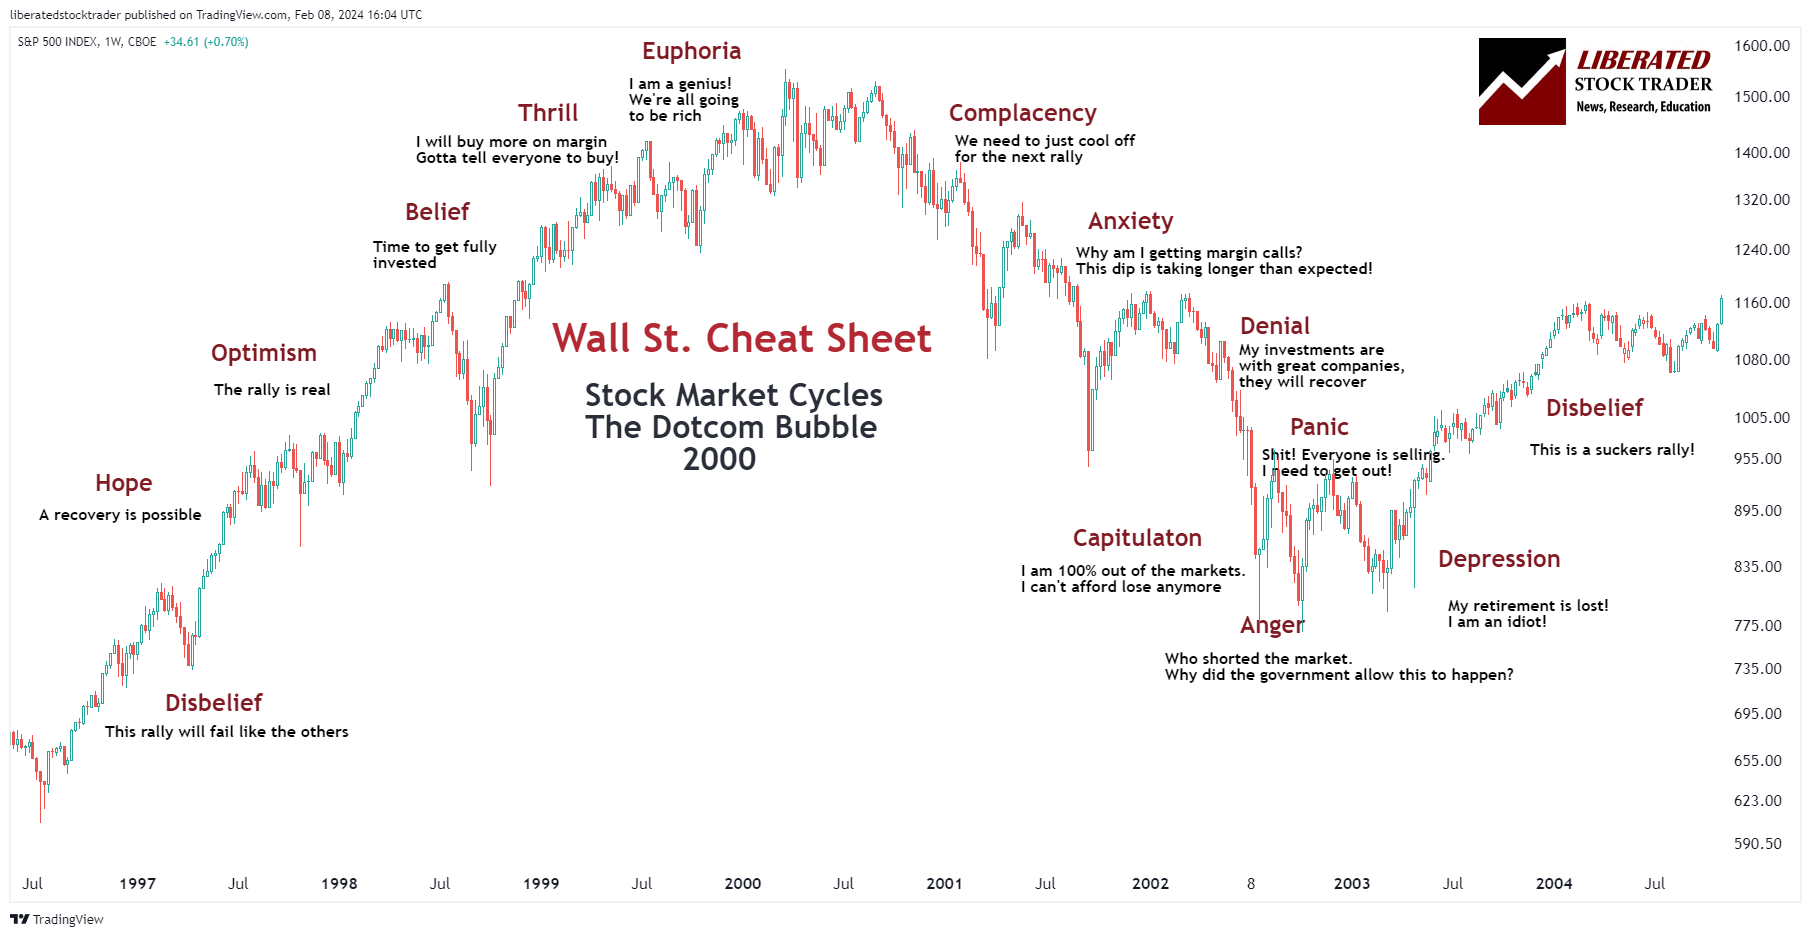
- Disbelief: Skepticism after the last crash prevails even as the market may begin recovery, with many wary of another downturn.
- Hope: A period when optimism starts to grow, and investment decisions are made with the anticipation of future gains.
- Optimism: The phase where confidence builds, often leading to increased investments.
- Belief: This stage marks a commitment to the bullish trend, with many investors convinced of their strategy.
- Thrill: Investors experience a high, often accompanied by a sense of triumph.
- Euphoria: The cycle’s peak, where maximum financial risk is present but overlooked due to extreme optimism.
- Complacency: After reaching peaks, the sense of euphoria shifts to a state of denial once the market begins to turn.
- Anxiety: As market correction sets in, anxiety starts to replace complacency.
- Denial: Investors hold onto hope that the market will bounce back quickly, failing to acknowledge changing trends.
- Fear: Acknowledgment of losses sets in, and panic may ensue.
- Desperation: A feeling of helplessness might prevail, with investors looking for a way out.
- Panic: Rapid selling occurs, trying to exit positions to avoid further losses.
- Capitulation: Investors give up any previous optimism, often selling at a loss.
- Anger: The reality of financial impact hits, and investors question their decisions.
- Depression: Coming to terms with the financial hit and reflecting on the decisions made.
- Disbelief: Back to the beginning of the cycle. Can we still believe it?
Psychology and Emotional Investing
Human emotions heavily influence investor behavior, which can lead to irrational decisions. Emotions like greed, fear, and ego can drive investors to deviate from logical investment strategies, potentially leading to loss due to emotional investing.
Analyzing Trends and Patterns
Recognizing patterns and trends is pivotal to understanding market cycles. By analyzing historical data and market behavior, traders can better predict bullish or bearish movements and make informed investment decisions that align with sentiment and trends rather than fleeting emotions.
Trading Strategies and Investor Behavior
Emotional dynamics profoundly influence the intersection of trading strategies and investor behavior, which can dictate the success or failure of trades. A structured approach to understanding and managing emotions is crucial for making rational decisions, especially in turbulent markets.
Emotion Management in Trading
Managing emotions is a vital component of a trader’s toolkit. Proficient traders have honed the skill of detaching emotions from decision-making and maintaining composure regardless of market conditions. Implementing strategies such as setting strict trading rules, employing stop-loss orders, and maintaining a disciplined trading schedule are effective ways to combat emotional trading.
Impact of Fear and Greed
Fear and greed are powerful emotions that can distort a trader’s rationality and lead to impulsive actions. Fear can result in the rapid selling of assets to curtail losses during market downturns, while greed can drive investors to take excessive risks to pursue higher returns. Recognizing these emotional states is pivotal for traders to modulate their behavior and adhere to a balanced investment approach.
From Disbelief to Euphoria: Navigating Between Emotions
The trading journey often involves navigating through a spectrum of emotions, from disbelief in the early stages of a market recovery to euphoria at the peak of a market cycle. Savvy investors spot opportunities by assessing market sentiment and weighing it against factual data, avoiding the herd mentality that often characterizes both market extremes. The transition from hope to optimism and, eventually, euphoria can provide insight into market timing. Still, it requires a disciplined commitment to risk assessment and a keen understanding of market signals.
Try Our Live Wall Street Cheat Sheet
Risk Assessment and Market Indicators
Risk assessment in investing involves evaluating factors affecting asset prices and market conditions. Market indicators are essential in this process, providing insights into current and future market behavior.
Identifying Market Sentiment
Market sentiment reflects investors’ overall attitude toward the market at a given time. It can be bullish, indicating expectations of rising prices, or bearish, suggesting anticipation of a decline. Additionally, uncertain sentiment signals a lack of clear direction in the market. Tools like the Wall Street Cheat Sheet can help investors recognize the prevailing sentiment and make informed decisions.
TradingView 4.8/5⭐ : The Best Trading Platform I’ve Tested in 20+ Years
With lightning-fast charts, powerful pattern recognition, smart screening, backtesting, and a global community of 20+ million traders — it’s a powerful edge in today’s markets.

If you want one platform that gives you an edge, this is it.
Utilizing Technical and Fundamental Analysis
Investors employ technical analysis to examine historical price movements and identify patterns that may indicate future trends. This approach largely focuses on charts and statistical figures. On the other hand, fundamental analysis considers economic factors, including a company’s financial health, industry conditions, and broader economic indicators, to judge a security’s intrinsic value.
Price Movements and Market Phases
Price movements in the markets typically follow certain phases that reflect the collective actions of investors. The accumulation phase often occurs when savvy investors begin buying or investing in a security despite a prevailing bearish sentiment. An uptick in price may indicate a shift towards a more bullish market phase, including the distribution phase, where investors may take profits following significant gains.
Applied Case Studies
Case studies utilizing the Wall Street Cheat Sheet reveal its practical application in different financial realms, essentially highlighting its importance in understanding market psychology across various asset classes.
Cryptocurrency Market Cycles
Cryptocurrency market cycles often mirror the emotional stages outlined in the Wall Street Cheat Sheet. A clear instance is Bitcoin’s ascent to nearly $20,000 in December 2017, followed by a rapid downfall, demonstrating the textbook progression from Euphoria to Despair. This pattern reasserted itself as Bitcoin surged to new highs in late 2020, reflecting the recurring nature of investor sentiment in the cryptocurrency markets.
Stock Market Examples
The Wall Street Cheat Sheet also indicates investor behavior in the stock market. For example, Tesla, Inc. (TSLA) has experienced several cycles of rapid growth followed by corrections in alignment with the cyclical patterns of the Cheat Sheet. Analyses indicate that key emotional phases, such as Optimism, Anxiety, and subsequent stages, are observable within TSLA’s stock price movements, akin to the broader stock market behavior.
FAQ
Can I see a live chart of the Wall Street Cheat Sheet?
Yes, I have created a chart on TradingView where you can see the Wall Street Cheat Sheet live.
What are the phases of a market cycle according to the Wall Street cheat sheet?
The market cycle is typically broken down into several key phases, including disbelief, hope, optimism, thrill, and euphoria at the cycle's peak, followed by complacency, anxiety, denial, panic, and finally, capitulation, anger, and depression at the bottom.
How can the psychology of a market cycle guide investment decisions?
Understanding the psychology behind each phase of the market cycle can assist investors in making more informed decisions by recognizing the emotional state of the market, thus helping to avoid the pitfalls of emotional investing.
How can traders apply the principles of the Wall Street cheat sheet?
Traders might apply these principles by identifying current market trends, gauging investor sentiment, and aligning their strategies with the market cycle phases.
What is the Wall Street cheat sheet?
The Wall Street cheat sheet represents the typical emotions and phases that occur during a market cycle. It provides a visual guide to help investors understand the psychology behind market movements.
How can the Wall Street cheat sheet guide investment decisions?
By referring to the Wall Street cheat sheet, investors can gain insights into the current emotional state of the market and use this information to make more informed investment decisions. It helps them avoid getting caught up in the irrational exuberance or panic that often accompanies different market cycle phases.
Are the phases of the market cycle always the same?
While the Wall Street cheat sheet provides a general framework for understanding market cycles, it's important to note that the timing and intensity of each phase can vary. Various factors influence market cycles, including economic conditions, investor sentiment, and geopolitical events.
Can the Wall Street cheat sheet predict market movements?
No, the Wall Street cheat sheet doesn't provide a crystal ball for predicting exact market movements. Instead, it serves as a tool to help investors gauge the market's overall sentiment and emotional state. It can assist in identifying potential turning points and making more informed investment decisions, but it should be used in conjunction with other analysis and research methods.