The Santa Claus Rally refers to a phenomenon in the stock market characterized by an increase in stock prices during the last weeks of December through the first two trading days in January.
Based on our data analysis, the Santa Rally phenomenon is indeed observable. Our findings indicate average stock price rises of 1.74% in October, 2.40% in November, and 0.56% in December. Weekly analysis reveals that week 52 exhibits the highest strength, with 68% of instances showcasing an average increase of 0.86%.
Investors have observed the Santa Rally for years, leading many to speculate about the catalyst behind the seasonal upswing. Theories suggest various factors contributing to this end-of-year rally, including tax considerations, holiday optimism, and institutional investors settling their books before the new year.
Market watchers often anticipate this annual occurrence. Still, it remains a topic of debate as to whether it’s a reliable pattern or a market anomaly driven by specific circumstances.
Key Takeaways
- The Santa Claus Rally describes a temporary upswing in stock prices often seen at the end of December.
- Contributing factors include holiday cheer, tax strategy, and year-end investment adjustments.
- While historical data shows a trend, the rally is not a guaranteed market pattern and carries risks.

The phenomenon isn’t guaranteed, and while investing during this period may capitalize on potential gains, it also introduces unique risks. Market trends and indicators play a significant role in the rally’s occurrence, and investors should consider them alongside broader economic signals when making decisions.
What is the Santa Claus Rally?
The Santa Claus Rally refers to a phenomenon in the stock market where there is a tendency for stock prices to rise in the last week of December through the first two trading days in January. Investors often anticipate this rally, as it has been historically associated with a boost in market optimism.
Characteristics of the Santa Claus Rally:
- Timing: Typically observed in late December and early January.
- Duration: Generally lasts for about 1.5 weeks.
- Market Impact: This can result in higher-than-average stock returns.
Potential Causes:
- Increased Buying Activity: Many investors may engage in year-end buying to prepare for the upcoming year.
- Tax Considerations: Investors may adjust their portfolios for tax-related purposes before the year ends.
- Holiday Mood: Optimism during the holiday season may produce more positive market sentiment.
Research into the Santa Claus Rally suggests that the effect is not uniform across all stocks and may vary by firm size. It has been posited that both small and large firm stocks tend to perform better during the rally period, although the reasons remain a subject of analysis.
While the Santa Claus Rally is not guaranteed, and past performance does not indicate future results, traders and investors watch it with interest.
Is the Santa Rally Real?
Yes, according to our data, the Santa Rally is a real occurrence. Our evidence shows mean stock price increases in October +1.74%, November +2.40%, and December +0.56%. Weekly evidence shows week 52 is the strongest, with 68% increasing an average of 0.86%.
Defining the Santa Claus Rally
The Santa Claus Rally refers to the stock market’s tendency to experience gains during the last week of December into the first two trading days of January. This phenomenon is observed in various financial markets worldwide, with the primary focus often on the American stock market.
Characteristics of the Santa Claus Rally:
- Timing: Typically occurs during the final week of December through the beginning of January.
- Duration: Usually lasts for seven trading days.
- Market Impact: Historically, this has led to higher-than-average stock returns.
Economists and analysts propose several reasons for this seasonal effect:
- Holiday optimism among investors.
- Reduced trading volume due to the holiday season can amplify market movements.
- Portfolio adjustments and tax considerations as the year ends.
However, it’s important to note that the Santa Claus Rally is not guaranteed, and market performance during this period is subject to the same uncertainties affecting stock prices throughout the year.
Empirical Evidence:
Studies examining the Santa Claus Rally have employed methodologies such as regression analysis to explore its existence and impact on different firm sizes. The results support the rally’s occurrence but remind investors that each year’s results may vary due to economic conditions, investor sentiment, and geopolitical events.
The Santa Claus Rally refers to the tendency for stock prices to rise in the final week of December through the first two trading days in January. This period often enjoys an average return that outperforms the market’s general trend.
Academic Research
Scholars have scrutinized the Santa Claus Rally to understand its causes and implications. Academic studies suggest that the phenomenon may be linked to factors such as tax considerations, investor psychology, and holiday cheer.
In their research, Washer, Nippani, and Johnson discovered that returns tend to be higher during this period. They further observed that this effect is significantly more pronounced for small-firm portfolios than large capitalization portfolios. Additionally, the authors present compelling evidence suggesting that the last trading day in December and the first two trading days in January have substantial influence, particularly on small stock portfolios.
Evidence Through the Years
Historical data on the Santa Claus Rally illustrates a pattern of positive performance during the festive period. For example, statistical analysis may show that stock prices have risen more frequently than not from late December into January, supporting the rally’s average return characteristic. Yet, this is not a guarantee every year, and investors are cautioned against relying solely on these seasonal trends without considering broader market conditions.
Our Research into the Santa Rally
Using up-to-date seasonality charting with TrendSpider, we can look back decades into the performance of the S&P 500 to see if the data shows the reality of the Santa Rally.
Live Interactive Monthly Seasonality Data
The chart below provides evidence of the Santa Claus Rally in the S&P 500 over 31 years. The chart shows monthly stock market seasonality, specifically from late December to January.
Try Seasonality Charts with TrendSpider
Our analysis suggests that the Santa Rally is real but also demonstrates that investors should not rely on this seasonal trend alone when making investment decisions. Considering broader market conditions before jumping into any investment decisions is important. With TrendSpider’s
Santa Rally Monthly Data Table
| Santa Rally | # Stocks +% Change | Mean % Change |
| Jan | 57% | 0.64% |
| Feb | 55% | -0.10% |
| Mar | 61% | 0.87% |
| Apr | 77% | 1.95% |
| May | 71% | 0.82% |
| Jun | 52% | -0.22% |
| Jul | 61% | -1.44% |
| Aug | 61% | -0.16% |
| Sep | 48% | -1.13% |
| Oct | 65% | 1.74% |
| Nov | 77% | 2.40% |
| Dec | 68% | 0.56% |
According to the data table, there is evidence of the Santa Claus Rally in the S&P 500. The table displays the percentage change in the number of stocks during different months of the year.
From the table, we can observe that October through January consistently show positive results. In October, the percentage change was 1.74%; in November, it was 2.40%; and in December, it was 0.56%. These positive results indicate increased market performance during the Santa Rally period.
The data indicates a recurring pattern of positive performance during this time frame. Statistical analysis suggests that stock prices have risen more often than not during this period, supporting the notion of the Santa Claus Rally.
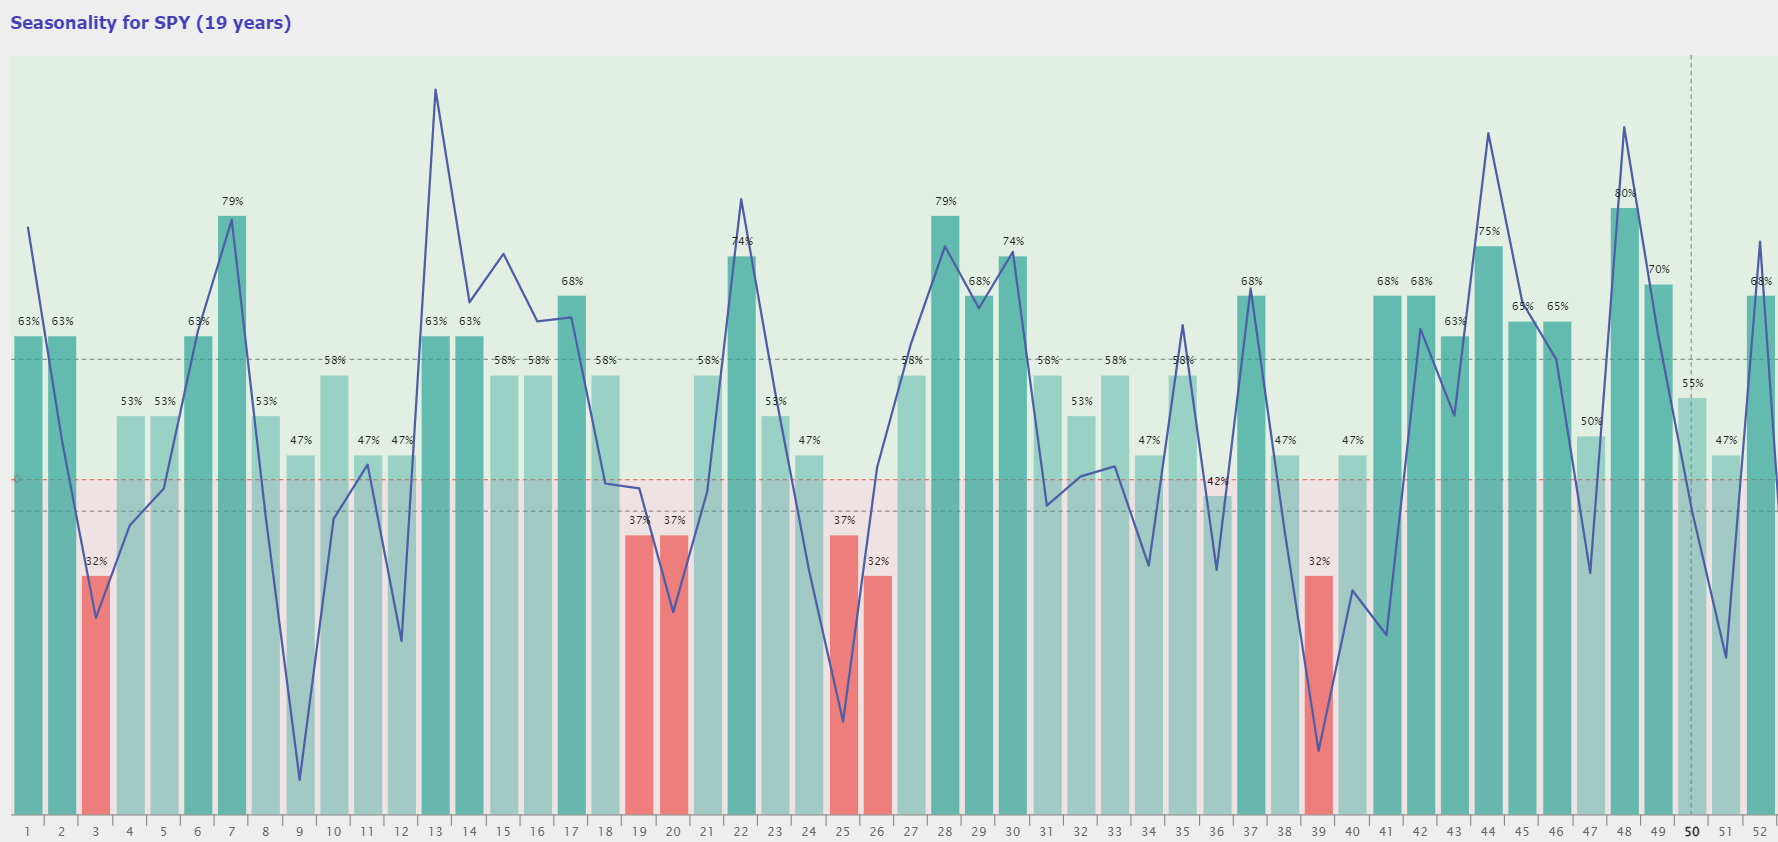
Weekly Seasonality Data
The chart below illustrates the weekly seasonality data of stock market rallies in the S&P 500 over 19 years. From the data, it is evident that there is a recurring pattern of positive performance during this time frame.
Try Seasonality Charts with TrendSpider
The table below showcases the performance of stocks during the Santa Claus Rally in the S&P 500 over 19 years. It displays the weekly percentage change in stock prices and the mean percentage change. Upon reviewing the data, several positive results are worth noting.
Santa Rally Weekly Data Table
| Santa Rally | # Stocks +% Change | Mean % Change |
| Week 47 | 50% | -0.34% |
| Week 48 | 80% | 1.27% |
| Week 49 | 70% | 0.52% |
| Week 50 | 55% | -0.12% |
| Week 51 | 47% | -0.65% |
| Week 52 | 68% | 0.86% |
| Week 1 | 63% | 0.91% |
| Week 2 | 63% | 0.14% |
| Week 3 | 32% | -0.50% |
Weeks 48, 49, and 52 stand out as they exhibit increases of 1.27%, 0.52%, and 0.86% respectively. These findings indicate a positive trend during these particular weeks, reflecting the potential for favorable stock market performance during the Santa Claus Rally.
Statistical analysis suggests that stock prices have more often risen than fallen during this period.
To summarize the data, it showcases the occurrence of the Santa Claus Rally on a weekly chart. This reinforces the notion that the stock market tends to experience positive performance during the holiday season.
Factors Contributing to the Santa Rally
The Santa Claus Rally refers to the tendency for stock markets to experience gains during the end-of-year holiday season. This phenomenon is typically observed in the final week of December and January’s first two trading days. Various factors contribute to this seasonal trend, from psychological patterns affecting investor behavior to strategic financial moves by institutions.
Psychological Factors and Investor Sentiment
Investor sentiment during the holiday season can be buoyed by increased optimism and holiday cheer, which often translates into more bullish behavior in the stock markets. The festive mood encourages investors to participate more actively, resulting in a general uptick in stock prices. The psychology of market participants plays a crucial role, as the collective mood tends to be more positive.
End-of-Year Financial Strategies
Tax-loss harvesting is employed by individual and institutional investors selling securities that have incurred losses to offset capital gains tax liability. This activity usually increases market liquidity, as investors might reinvest in other securities, contributing to the rally. Additionally, the dispersal of holiday bonuses might increase investment capital, as recipients may choose to invest their extra earnings in the market.
Institutional Investor Activity
The actions of institutional investors can significantly influence market performance. During the end of the year, these investors may adjust portfolios for regulatory reporting purposes or for window dressing, where they buy high-performing stocks to improve the year-end appearance of their portfolio. This reshuffling can inject momentum into the stock market, helping drive the rally. It is also a period where institutional activity can help stabilize market volatility, reinforcing the gains typically seen.
January Effect and January Barometer
The January Effect refers to a pattern where stock prices increase more frequently in January than in other months, a phenomenon often attributed to tax-related selling and investment strategies. Investors watch this closely, as it could signal how the market will perform for the remainder of the year. The January Barometer builds on this premise, positing that the performance of the S&P 500 in January sets the tone for its performance throughout the year.
Market Volume and Liquidity
Market volume and liquidity are critical indicators of market trends. A higher volume of trades generally indicates a stronger interest in the traded stocks, which can drive up prices. Liquidity refers to how easily stocks can be bought or sold in the market without affecting the asset’s price. These metrics provide insight into the strength of the market and the potential for a sustained rally.
Role of Financial Analysts and Commentators
Financial analysts and market commentators can significantly impact investor sentiment and behavior. Their analyses, reports, and forecasts can lead to changes in market dynamics by influencing the decisions of a wide spectrum of investors. Market participants often look to these experts for cues on future market movements and validation of current market trends.
Risks and Considerations
When investors consider engaging in a Santa Rally, which typically describes the stock market’s tendency to experience gains in the last five trading days of December and the first two of January, they should weigh certain risks and considerations:
- Market Volatility: Despite historical occurrences, relying on a Santa Rally can be risky due to inherent market volatility. Unexpected macroeconomic news or geopolitical events during the holiday season could influence market performance.
- Portfolio Diversification: Investors may be tempted to adjust their portfolios to capitalize on a potential rally. However, maintaining diversification helps mitigate risk if the rally does not materialize.
Key Elements for Investors:
- Momentum Investing: The risk-mitigating effect of ESG on momentum portfolios suggests that such strategies may offer some protection. Yet, they may also result in sacrificed returns during strong rallies.
- Retail Investor Behavior: Retail investors’ impact, especially in concerted actions—as observed in stock rallies—can be unpredictable. Influential trade figures and social media can sway markets unexpectedly.
- Growth Stocks vs. Value Stocks: Growth stocks may be associated with higher risk than value stocks. A Santa Rally primarily benefitting one type over another could affect investors differently.
- Short Positions: Traders with short positions may experience exacerbated losses during a Santa Rally due to the short squeeze phenomenon, in which stock prices rise, and shorts are covered.
Investors should approach a Santa Rally cautiously, not presuming that historical patterns ensure future outcomes. They should adhere to sound investment principles such as thorough analysis and prudent risk management.
FAQ
This section aims to clarify common inquiries about the Santa Claus Rally and its implications for the stock and cryptocurrency markets, supported by research findings.
What is the Santa Claus Rally in stocks?
The Santa Claus Rally refers to the tendency for the stock market to experience a surge in stock prices during the last week of December and into the new year. Historically, this period has been associated with increased investor optimism.
Can we expect to see a Santa Claus Rally this year?
Predicting market movements with certainty is challenging. However, if historical patterns hold, an uptick in stock prices could be observed during the holiday period.
Does the Santa Claus Rally affect cryptocurrencies?
No, my research shows USD vs Bitcoin tends to rally in Weeks 1 to 4 in January with a +8% mean change per week. Cryptocurrencies do not follow stock market trends.
Which stocks historically perform best during the Santa Claus Rally?
Typically, consumer discretionary stocks tend to perform well during the Santa Claus Rally, possibly because of increased holiday spending. However, performance can vary by sector and year.
What empirical evidence supports the Santa Claus Rally?
Some studies suggest that the rally may be more than folklore, showing a pattern of statistically significant stock market gains during the end-of-year period in question.
How is the Santa Claus Rally different from the January Effect?
The January Effect is the observed increase in stock prices during January, theorized to be due to tax-related selling and buying. In contrast, the Santa Claus Rally specifically refers to the late-December market uptick and does not necessarily encompass January's trading behavior.