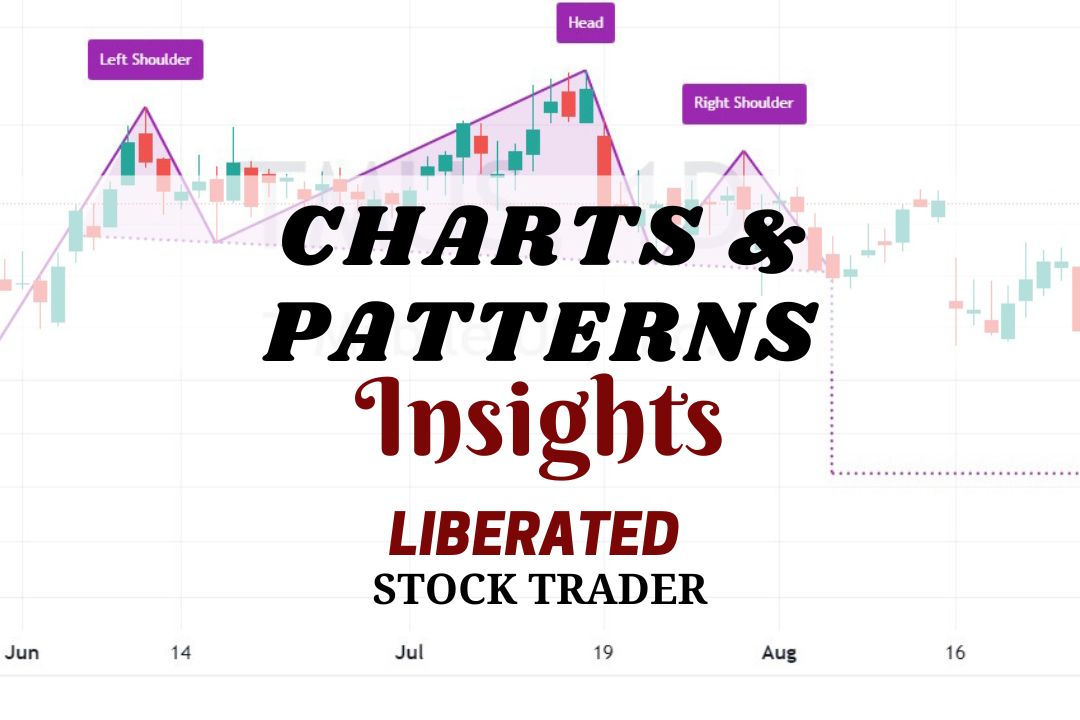
A head and shoulders (H&S) occurs when the price peaks on three separate occasions, with two peaks forming the “shoulders” and the central peak forming the head.
The head-and-shoulders pattern is the most accurate technical analysis bearish reversal pattern.
A H&S pattern signals a downside probability of 81% and an average price drop of 16%.
Find out how to detect and use this chart pattern to improve your trading.
Key Takeaways
- The head and shoulder pattern has an established success rate of 81%.
- It is easy to recognize and signals a potential price reversal.
- It allows traders to pinpoint optimal trade exits or short-selling opportunities.
- An iconic chart pattern widely recognized and utilized by traders for decades.
What is the Head and Shoulders Pattern?
The head and shoulders pattern is a bearish reversal pattern. It has three distinctive parts: the left shoulder, head, and right shoulder.
The left shoulder forms when the stock price rises to a new high, followed by a pullback. The head develops when the stock creates another new high before retreating again. Finally, the right shoulder is when the stock forms another new high close to the level of the first shoulder before dropping back.
The head-and-shoulders pattern is complete once the price breaks through the “neckline,” which connects the two shoulders. This break signals a downtrend of either short or long duration.
Once this pattern has been formed, it can also be used in trend trading and as a support line for the stock.
Get TradingView Head & Shoulders Chart Pattern Recognition
What Does It Tell You?
The head and shoulders pattern is a technical analysis tool to identify potential reversals in the stock market. Since it involves two highs, followed by a low, then another high, it can be used to predict an impending reversal of an uptrend. After the neckline has been breached, traders may short-sell or buy put options to profit from the trend reversal. By trading in this manner, traders can potentially profit even in a bear market.
It’s important to note that although the head and shoulders pattern accurately indicates potential reversals, it does not guarantee success.
How Reliable Is a Head and Shoulders Pattern?
Detailed research shows that the head and shoulders top pattern is extremely reliable, with an 81% success rate and an average price move of -16% during a bull market.
The head-and-shoulders top has been used for decades as a reliable indicator of potential reversals. The pattern is highly reliable because it requires three tests of the same resistance and a break of the neckline before it can be considered valid. This increases the signal’s accuracy and improves its reliability.
It is also important to note that head-and-shoulders patterns can form in both bullish and bearish markets. This can provide traders with a great way to enter or exit positions based on the market’s direction.
Despite its accuracy, it is important to note that no technical indicator is 100% reliable. While a head and shoulders pattern may be accurate, the key to success with this pattern is understanding when to take profits and when to cut losses.
Head and Shoulders Pattern Accuracy
The head and shoulders top occurring during a bull market can have a success rate of 81%, with an average target price of -16%.
| Chart Pattern | Success Rate | Average Price Change |
| Head & Shoulders Top | 81% | -16% |
Pros
- A proven 81% success rate.
- Quickly identifies potential reversals.
- Allows traders to identify when they should exit a trade or short-sell.
- An easily recognizable chart pattern that has been used for decades by traders.
- It can be automatically detected by TradingView and Finviz
Cons
- It should only be used on daily and weekly charts.
- It can be difficult to identify in real-time.
- In a bull market, the price declines only 16%.
The head and shoulders chart pattern defines a reversal of a stock price trend. It occurs in a price uptrend and has three price peaks: the left shoulder, the head, and the right shoulder. The head is higher than the shoulders, and the pattern is confirmed when the price breaks down through the neckline.
Identifying Head and Shoulders Patterns
To identify a head and shoulder pattern, look for three distinct price peaks at the top of an uptrend. The second peak should be higher than the others.
Generally, the pattern should be visible on intraday, daily, and weekly charts. After identifying the three peaks, investors can look for a confirmation of a trend reversal by watching for a breakout either above the upper resistance line or below the lower support line. If the security price breaks out below the support line, it could signal that the security has completed its reversal.
In contrast, a break above the resistance line could signal a resumption of the uptrend. Confirmation of this stock chart pattern should not be relied upon until prices have moved beyond these levels.
My thorough testing awarded TradingView a stellar 4.8 stars!
With powerful stock chart analysis, pattern recognition, screening, backtesting, and a 20+ million user community, it’s a game-changer for traders.

Whether you're trading in the US or internationally, TradingView is my top pick for its unmatched features and ease of use.
Explore TradingView – Your Gateway to Smarter Trading!
Automated Identification of Head & Shoulders Patterns
You can automatically identify head and shoulder patterns using TradingView. Go to TradingView and click Indicators > Technicals > Patterns. Next, select Head and Shoulders Chart Pattern. Now, a chart with a head and shoulders pattern will be clearly marked.
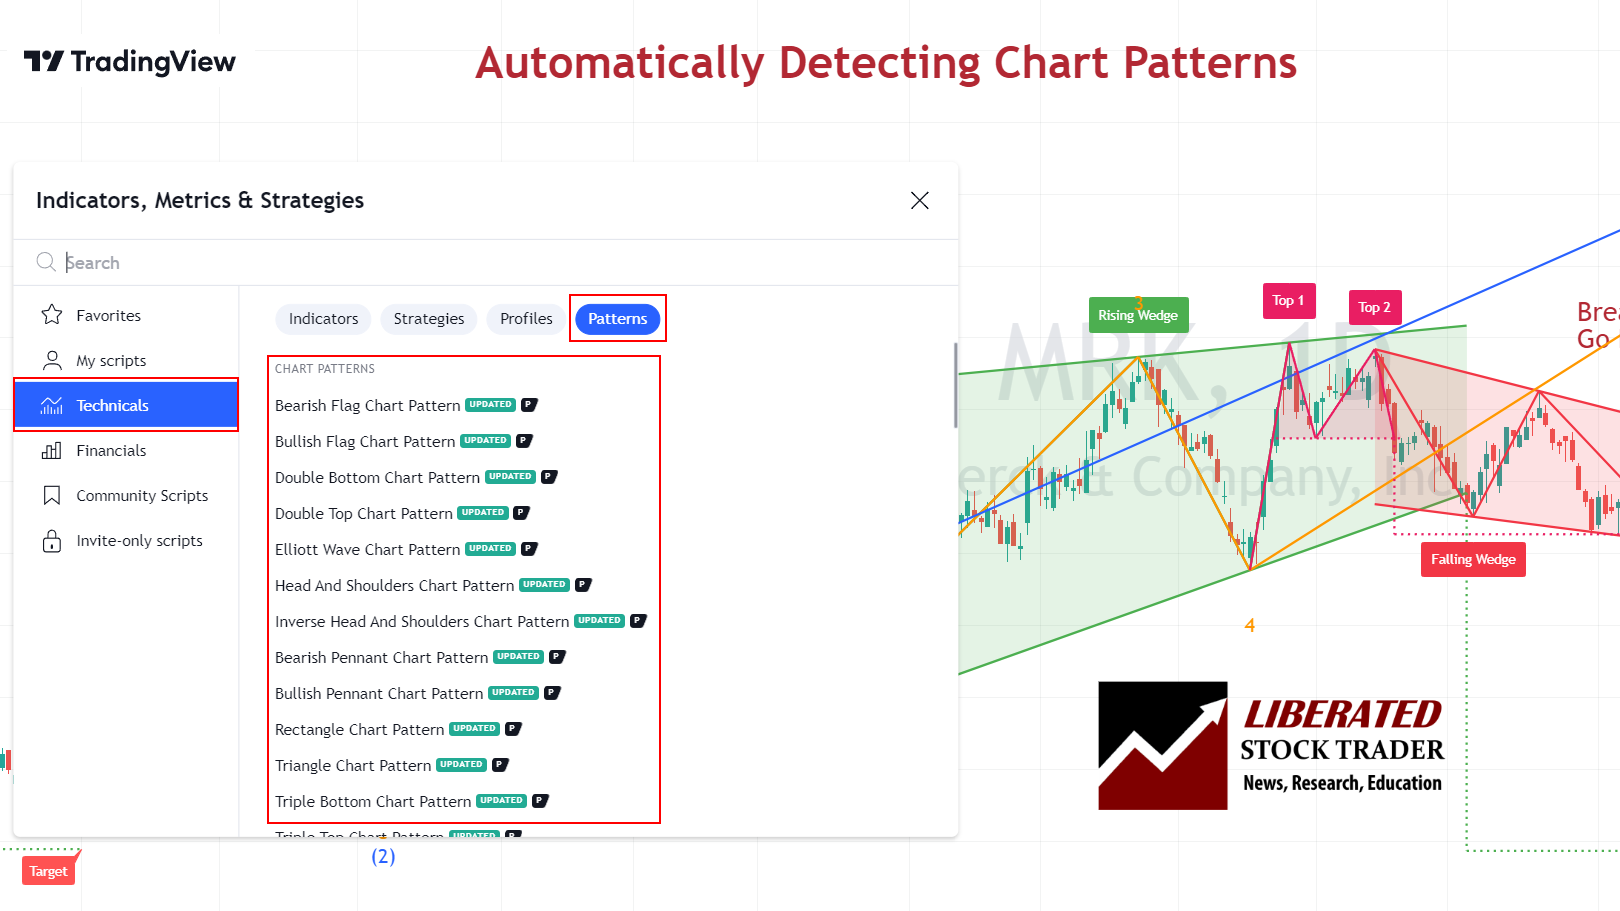
How to enable automated chart pattern recognition:
- Go to TradingView
- Click Indicators > Technicals > Patterns
- Select Head and Shoulders Chart Pattern
- A chart with a head and shoulders pattern will be clearly marked.
TradingView will now automatically plot the head and shoulders pattern and add a price target.
Head & Shoulders Stock Chart
Get TradingView Head & Shoulders Chart Pattern Recognition
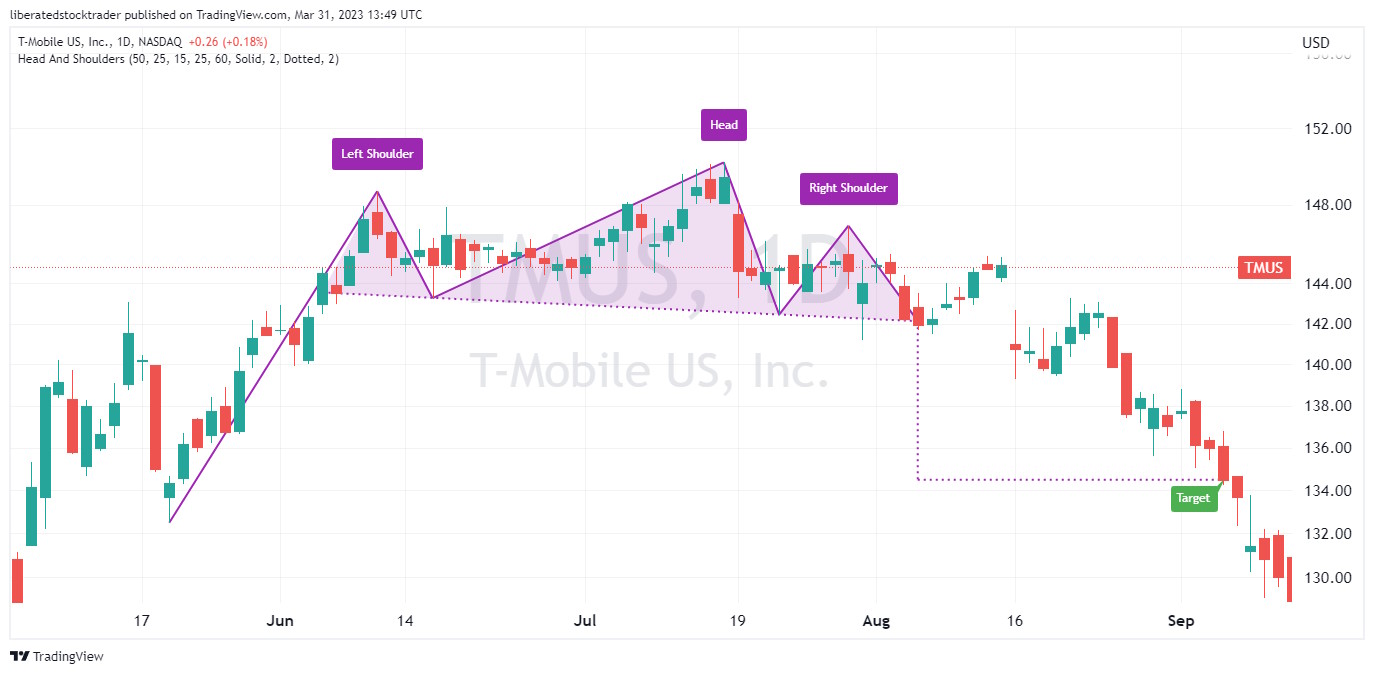
The three main elements of the head and shoulders stock pattern are shown in the chart above.
- The price movement has two shoulders.
- It has a high point, the head, in between the shoulders.
- The volume should confirm the pattern.
The Head & Shoulders Chart Explained
- The left shoulder has to be formed on increasing volume; this means you have heavy bullish buying into the stock price move.
- The head is formed on decreasing volume. This is important because a rally would continue if the head were built on increasing volume.
- The right shoulder represents a failed rally initially on increasing volume. This means the stock is trying to rally but fails despite the increased volume; the stock price starts to fall on decreased volume.
- The neckline. Using a trendline, connect the low from both sides of the head through the outer price lines. Then, you see the distinct pattern above the neckline.
- The left shoulder is formed on increasing volume. This is to be expected.
- In forming the head, we see a significant decrease in volume.
- In the right shoulder, we also see decreasing volume.
What Does It Mean?
The head-and-shoulders pattern represents supply and demand. We see a surge upwards on increased trading volume in the left shoulder, which indicates a bullish bias, meaning more buyers and fewer sellers at this price.
Next, we see another surge upwards at the head, but this time on decreased volume. The decreased volume is critical, as fewer market participants are interested in buying the stock and even fewer in selling it at this price.
As the price declines, it is time for a new rally; however, there are now more sellers than buyers. The sellers sell, and because there are fewer buyers, they sell at a lower price. So, there is less volume and lower prices.
This indicates that the market will experience a trend reversal from an uptrend to a downtrend.
The above conditions of the head-and-shoulders pattern here are consistent with textbook descriptions. For a reference, see John J Murphy’s classic book Technical Analysis of the Financial Markets.
The head and shoulders pattern is said to be confirmed on a neckline break; this is about to occur in the chart above. Therefore, once the neckline is broken, the price declines.
Can a Head and Shoulders Top Turn Bullish?
Yes, a head and shoulders top can turn bullish in the right circumstances. A Head and Shoulders Top has a 19% chance of turning bullish during a bull market. If the security’s price breaks above the resistance line of the pattern, then this may indicate that a new uptrend is forming. The key to success with this reversal pattern is timing; traders need to enter or exit their positions at the right time.
The Inverse Head and Shoulders Pattern
An inverse head and shoulder pattern is a chart formation that signals that a security’s price may be headed higher. It’s the opposite of the Head and Shoulders Top pattern. When this pattern appears, it can indicate that an uptrend could be forming. To confirm this reversal, traders should watch for the security to break above the neckline—the price level that the left shoulder, head, and right shoulder form. Once this occurs, traders should consider entering long positions in anticipation of a potential trend reversal.
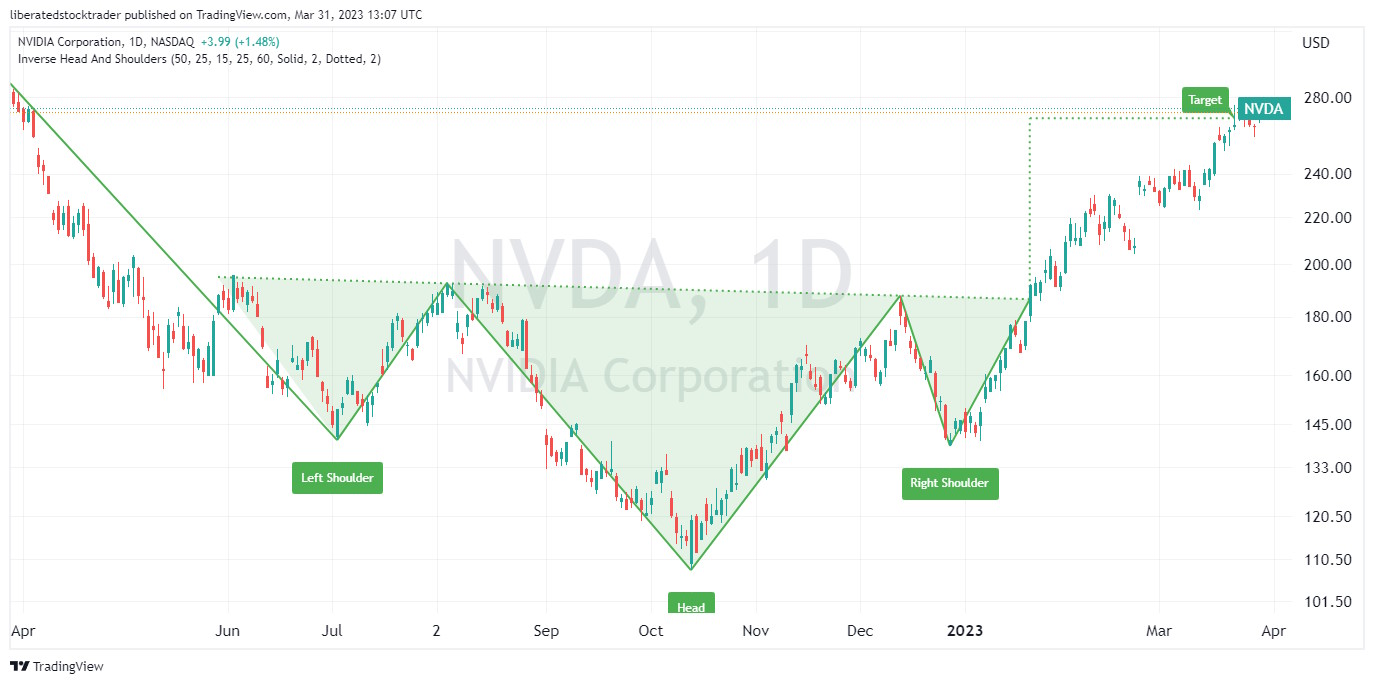
The inverse head and shoulders pattern predicts a stock price bottom rather than a top.
Summary
Investors should watch for head and shoulders patterns during their analysis, as it can be used to maximize profits or minimize losses. Additionally, understanding this pattern helps traders identify potential buying opportunities and spot potential risks in advance.
FAQ
What Is the Opposite of a Head and Shoulders Top Pattern?
The opposite of the head and shoulders top pattern is the inverse head and shoulder pattern, also known as the head and shoulders bottom. This pattern occurs during a downtrend and indicates a possible trend reversal.
Is a head and shoulders pattern bullish?
A head and shoulders pattern at the top of an uptrend is not bullish but bearish. 81 percent of the time, a head and shoulders top is a reversal pattern, meaning the price is expected to reverse and decline.
What happens after the head and shoulders pattern completes?
When a head and shoulders pattern completes, the price will break through the neckline, and the trend reverses 80 percent of the time. Be vigilant and observe the direction of the price breakout.
How reliable is a head and shoulders pattern?
The head and shoulders pattern is among the most reliable chart indicators, with success rates varying from 81 percent for head and shoulder tops to 89 percent for head and shoulders bottoms.
How to identify head and shoulders patterns?
Head and shoulders patterns can be identified automatically with TradingView or FinViz. Alternatively, you can manually identify the head and shoulders by looking for three peaks, with the second being the highest.
How to measure head and shoulders pattern?
TradingView can automatically measure a head and shoulders pattern to set a price target. Alternatively, to measure a head and shoulders pattern manually, use an arithmetic chart and plot the distance between the neckline and the middle peak. This distance will be the future price target which you should annotate on the chart.
How to trade a head and shoulders pattern?
When trading a head and shoulders pattern, it's important to wait for the price to break through the neckline before entering a short position. Alternatively, you can use options strategies such as selling puts or calls at the predicted target price. Setting a stop order slightly above the neckline is also advisable in case of false signals.
Are head and shoulders patterns bullish or bearish?
Head and shoulders patterns are both bullish and bearish. A head and shoulders bottom is bullish, and a head and shoulders top is bearish. 80 percent of the time, a head and shoulders pattern indicates a trend reversal, so if the trend is bullish (up), you can expect it to change to bearish (down).
