Our 60 years of research show that the stock market maxim “Sell in May and go away” is misleading and detrimental to investing performance.
The 60-year average return of June, July, and August outweighs any losses incurred during bad years.
Let’s explore this topic with data.

What Does Sell in May and Go Away Mean?
“Sell in May and go away” means that the summer months from May to September supposedly see much lower stock market returns than the winter months from October to April. Based on the data, this is a simple yet incorrect maxim.
Now that we understand what “Sell in May and go away” means, let’s look at the data.
Should You “Sell in May and Go Away”?
No, you should not “Sell in May and go away.” Based on our research, every year is different; you cannot dissolve your portfolio of stocks and ETFs because there is an outdated stock market maxim. Very few people follow this advice because the market would crash every year in May if they did.
The best time to buy stocks is at the start of March because January and February are usually negative months.
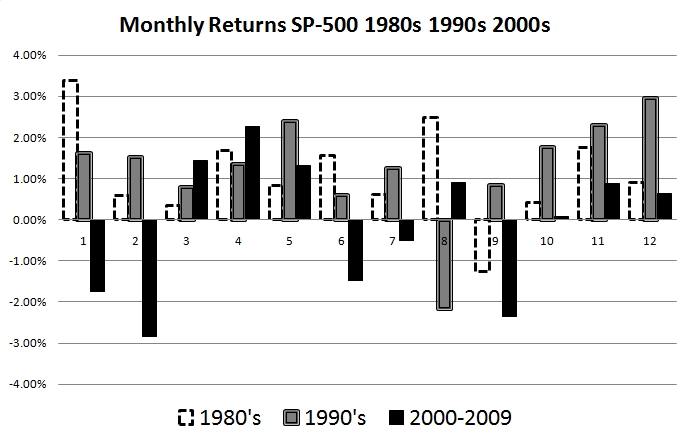
60 Years of Sell in May and Go Away Research
“We see that over the last 60 years, the best months to be in the market were January, March, April, July, October, November, and December, those months having each attained an average of 0.5% or greater gain.
This is an average, and there are years when these months will bring negative returns.
- An excerpt from the Liberated Stock Trader PRO Books and Training Course.
Sell in May and Go Away Chart: 30 Years of Data
Sell in May and Go Away Analysis: 2000 to 2020
The data shows that over the last twenty years, April has been the best-performing month on the S&P 500 index, with a 2.4% average gain. Additionally, June, July, August, and September suffered an average loss of 0.6%. If you Sell in May and Go Away, you will want to buy again at the start of October because October and November record an average of 1.12% gains.
| Month | Average of % Change |
| Jan | -0.28% |
| Feb | -0.65% |
| Mar | 0.83% |
| Apr | 2.40% |
| May | 0.30% |
| Jun | -0.50% |
| Jul | 0.90% |
| Aug | -0.28% |
| Sep | -0.83% |
| Oct | 1.17% |
| Nov | 1.08% |
| Dec | 0.50% |
| Average | 0.39% |
The table reveals that April is the best-performing month on the S&P 500 index, with an average gain of 2.4%, while June through September recorded average losses of 0.6% and 0.8%. Meanwhile, October and November performed much better than other months, with 1.17% and 1.08% gains, respectively. Overall, the market gain averages at 0.39%.
You want to be a successful stock investor but don't know where to start.
Learning stock market investing on your own can be overwhelming. There's so much information out there, and it's hard to know what's true and what's not.

Liberated Stock Trader Pro Investing Course
Our pro investing classes are the perfect way to learn stock investing. You will learn everything you need to know about financial analysis, charts, stock screening, and portfolio building so you can start building wealth today.
★ 16 Hours of Video Lessons + eBook ★
★ Complete Financial Analysis Lessons ★
★ 6 Proven Investing Strategies ★
★ Professional Grade Stock Chart Analysis Classes ★
40 Years of Analysis: Sell in May and Go Away
Over the last 40 years, from 1982 to 2022, the best months to buy stock have been April +1.97%, October +1.13%, November +1.55% & December +1.22%
| Month | Average of % Change |
| Jan | 1.07% |
| Feb | 0.20% |
| Mar | 0.70% |
| Apr | 1.97% |
| May | 0.96% |
| Jun | 0.28% |
| Jul | 0.91% |
| Aug | -0.08% |
| Sep | -0.52% |
| Oct | 1.13% |
| Nov | 1.55% |
| Dec | 1.22% |
The table above summarizes the S&P 500’s performance over the last 40 years. It shows that April is the best-performing month, with an average gain of 1.97%, while August and September record average losses of 0.08% and 0.52%. October and November performed much better, with 1.13% and 1.55% gains, respectively.
6-Year Analysis of Sell in May and Go Away
Over the last 6 years to September 2023, the average stock market gains have been +7.93%, +8.09%, +10.68%, +2.37%, -12.47%, and +6.74%. This averages a 3.89% gain per year from May to September. So you would not want to sell in May and go away! (See Chart Below)
Chart: Sell in May and Go Away

Perform Powerful Chart Analysis in TradingView
The Best Months to Sell Stocks
If you are considering selling stocks, the best time to do so would be toward the end of July. August and September are typically the worst months for stock market declines, with September averaging a 0.52% loss over the last 40 years.
Many Stock Market Maxims Are Misleading
Selling in May and going away is one of many misleading stock market maxims. While it may have been true historically for a short period, the markets can be unpredictable and are always changing. It is always best to do your research when making major investing decisions and not rely on stock market proverbs.
Summary
The S&P 500 has seen its best performance in April, with an average gain of 1.97%, while August and September are the worst months for stock market declines, averaging losses of 0.08% and 0.52%. October and November have been much better for investors, with respective gains of 1.13% and 1.55%. Investors looking to maximize their returns should consider selling stocks towards the end of July, as it marks the start of the worst two months for stock market performance.
Knowing when to buy and sell can be key to successful investing, and understanding the average trends throughout the year can help investors make more informed decisions.
The single best month to buy stock over the last 40 years and in every decade has been April.
According to our 40 years of data, from 1980 to 2020, the best month to sell is September.
Are you interested in the best days of the week to trade? Are you interested in the four-year business cycle and when the worst and best years to invest are? In the Liberated Stock Trader Book, I show an 86% probability that the four-year business cycle is real and when it will strike next.