Swing trading balances the risk of day trading and the slow accumulation of wealth in long-term investing. It allows investors to capture quick profits while still holding onto their stock positions for longer, reducing risk and giving them more flexibility in the market.
The five important swing trading strategies are trend following, support and resistance, breakouts, momentum, and reversals. Automating the identification, testing, and execution of these strategies is the key to successful swing trading.
Swing traders look for stocks within an established range and move quickly between highs and lows. This strategy requires patience, discipline, and careful analysis of chart patterns and fundamentals to make successful trades.
Learn the five core swing trading strategies and supercharge your investing profits.

What is Swing Trading?
Swing Trading is a style of trading that takes advantage of short-term price movements in the market. It looks for stocks or other securities with strong momentum and then attempts to capture gains from the trend by holding them for a few days or weeks.
Swing trading requires less capital than traditional investing and less time commitment, making it an attractive option for those looking to enter the stock market but don’t have much money or time. Swing trading also allows traders to capitalize on short-term price movements and potentially make larger profits than traditional buy-and-hold strategies.
However, swing trading can be risky as it involves predicting short-term market behavior, which is difficult and prone to mistakes.
How to Swing Trade?
Swing traders need to keep up with real-time market news and make quick decisions to take advantage of opportunities. They should also be aware of technical indicators such as moving averages, support and resistance levels, momentum oscillators, etc., which can help them identify potential trading setups.
To start swing trading, it is important to set realistic goals and use a sound risk management strategy. Traders should also have a plan for every trade and stick to it, including stop-loss orders to limit potential losses. Additionally, traders can look at the volume of their trades and the market context when determining whether or not to enter a position.
Finally, swing traders may consider using other strategies, such as options, to give them greater flexibility in managing their positions. Options can be used as hedges and for more aggressive strategies, allowing traders to tailor their trades according to their individual goals and risk tolerance. Ultimately, by studying the fundamentals of swing trading and doing sufficient research, traders should be able to make informed decisions to help them succeed in the markets.
TradingView 4.8/5⭐ : The Best Trading Platform I’ve Tested in 20+ Years
With lightning-fast charts, powerful pattern recognition, smart screening, backtesting, and a global community of 20+ million traders — it’s a powerful edge in today’s markets.

If you want one platform that gives you an edge, this is it.
What is Swing Trading vs. Day Trading?
The difference between swing and day trading is the time positions are held. Day traders typically open and close positions within a single trading day, while swing traders may hold onto their positions for days, weeks, or even months.
This means swing traders must be especially diligent in researching their trades and monitoring the markets to ensure that their positions remain profitable over time. Swing traders also need to pay attention to the
Swing trading is a mid-term investing strategy focusing on short-term market trends. Swing traders generally hold their trades for several days or weeks to capture gains in stock prices or other financial instruments. This type of trading may involve holding multiple positions open simultaneously and may require frequent adjustments to account for changing market conditions.
On the other hand, day trading is a short-term strategy that involves buying and selling securities within the same day. Day traders generally use technical analysis to make trades and may close out their positions at the end of each trading day. While day traders often look for small gains in stock prices or other financial instruments over a single day
1. Trend Following Strategy
Trend following is the simplest swing trading strategy. It involves buying stocks in an uptrend and selling them in a downtrend. Traders should review historical price charts to identify the start of a trend and look for indicators that confirm it.
Understanding how to identify trend lines to implement a trend-following swing trading strategy would be best.
How to identify trends in a swing trading strategy
You can identify chart trendlines by hand; however, an automated trend line tool such as TrendSpider can make it easier and more precise. Automated trend lines will draw a line on the price chart that connects higher highs or lower lows based on user-defined parameters, which makes them useful for swing traders.
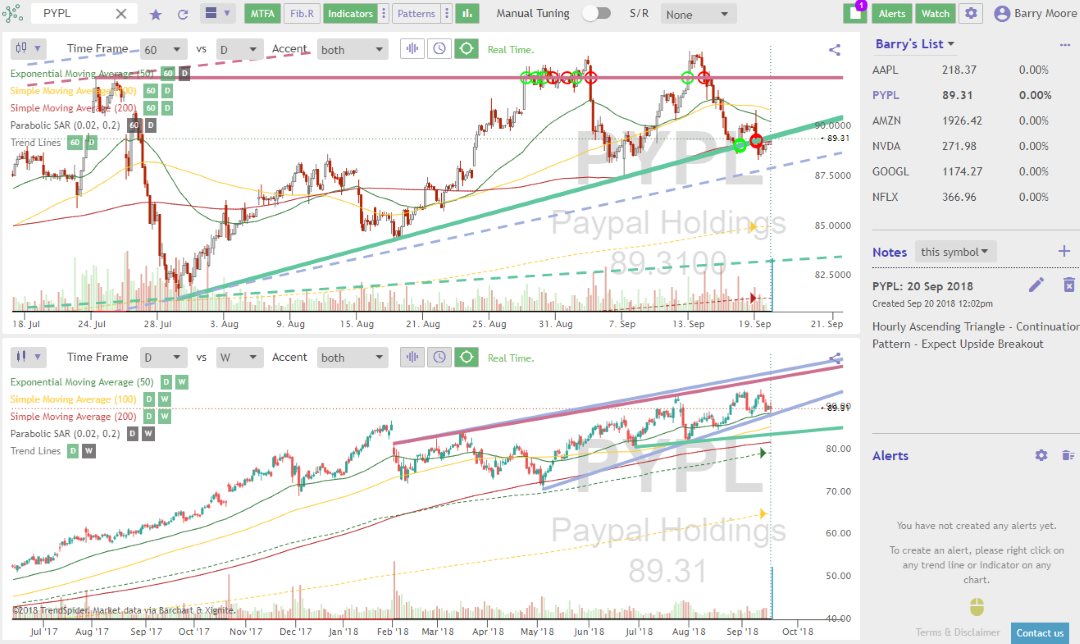
Let TrendSpider Draw Trendline For You Automatically
How to draw swing trading chart trendlines
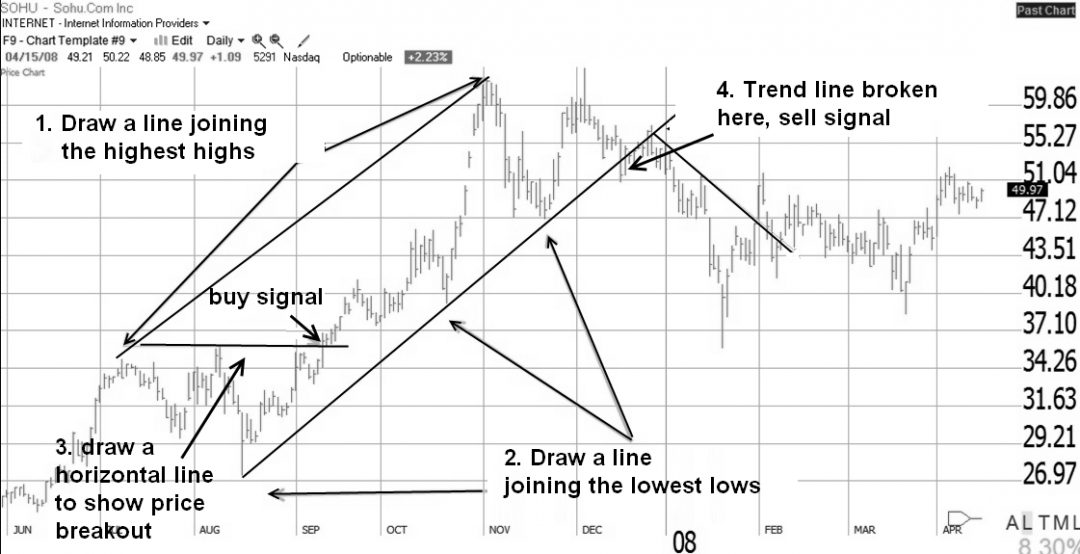
Manual chart trendlines can be drawn using support and resistance levels. Support and resistance levels are areas on a price chart where the price of an asset may have difficulty breaking through or find it easy to reject, respectively. These levels can help traders identify emerging trends or confirm existing ones.
When drawing a trendline, connect at least two highs or lows on the chart and ensure the line is not too steep. If there are more than 2 points, you should connect them with a straight line. This will help to identify trends more easily as they develop.
When drawing trendlines manually, it can be difficult to determine if the lines truly indicate a trend or just random fluctuations in the price. However, several indicators are available that can help traders identify whether or not a trend is present. Moving averages, for example, can smooth out short-term fluctuations and make it easier to spot trends as they develop. Similarly, momentum indicators like the RSI (Relative Strength Index) may also be useful in identifying developing trends.
2. Support and Resistance Strategy
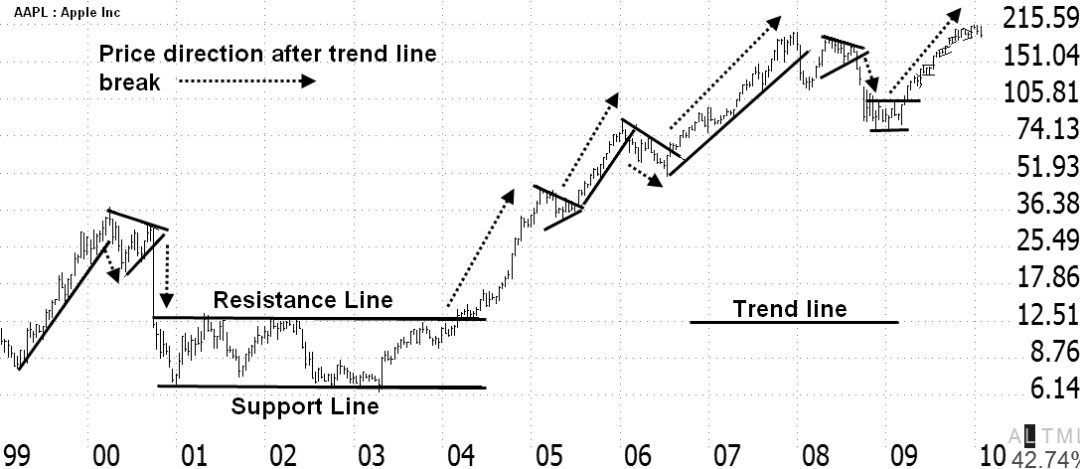
Support and resistance are important strategies swing traders use to determine when to enter or exit positions and monitor support and resistance levels. Support levels are points at which demand increases and prices stop falling, while resistance levels are points at which supply increases and prices stop rising. By monitoring these levels, traders can more accurately decide when to open or close trades. Typically, traders look for a break through either the support or resistance level as a signal to enter into a trade.
How to swing trade a support and resistance strategy
To draw a support line on a stock chart, you must first identify at least two lows in the stock chart. These are points at which the price has gone down and bounced back up in an almost equal amount of time. Once these two lows have been identified, draw a line connecting them and extend it to the right side of the chart.
Let TrendSpider Identify Support & Resistance For You
Look for at least two highs on the chart to identify a swing trading resistance line. These are points where the price has risen and then fallen back down again in an equal amount of time. Draw a line connecting these two highs and extend it to the right side of the chart.
By using both trendlines, traders can better understand how prices react when they approach support or resistance levels.
Once a swing trader has identified the support and resistance lines on the chart, a trader can start watching for potential trading opportunities, buying at support and selling at the resistance level.
3. Breakout Strategy
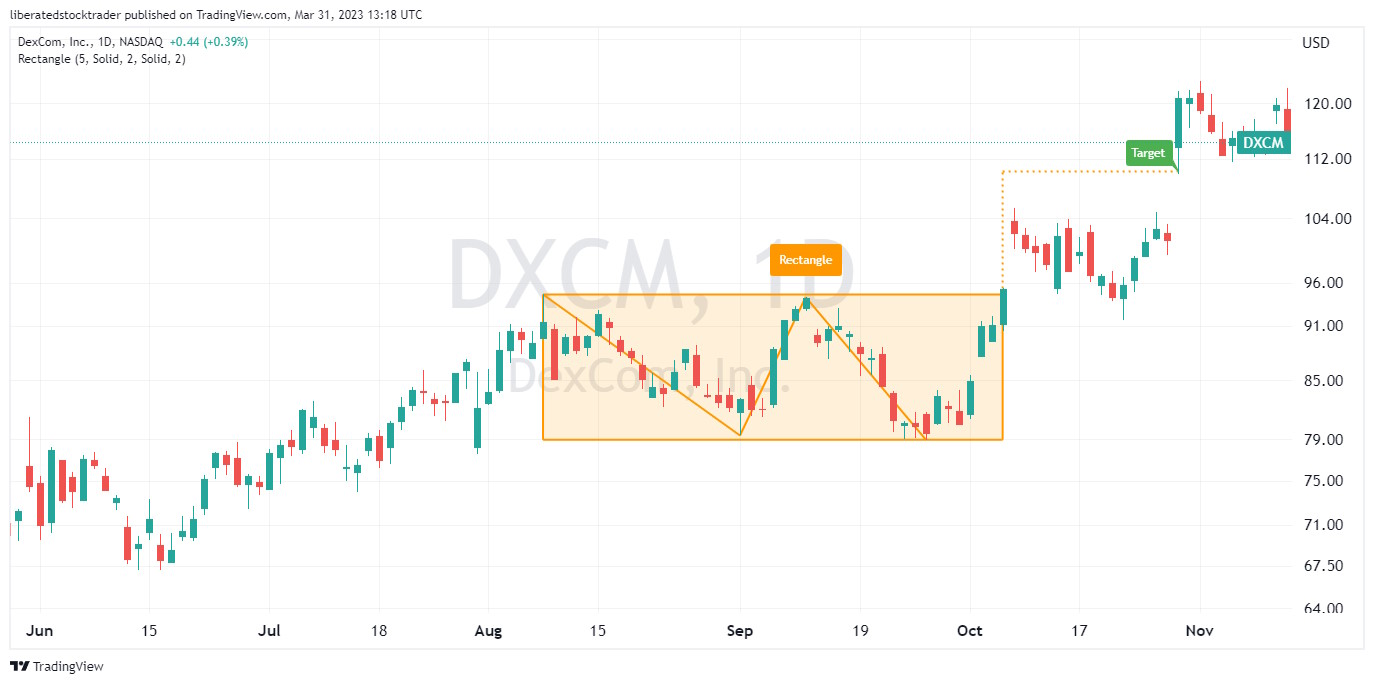
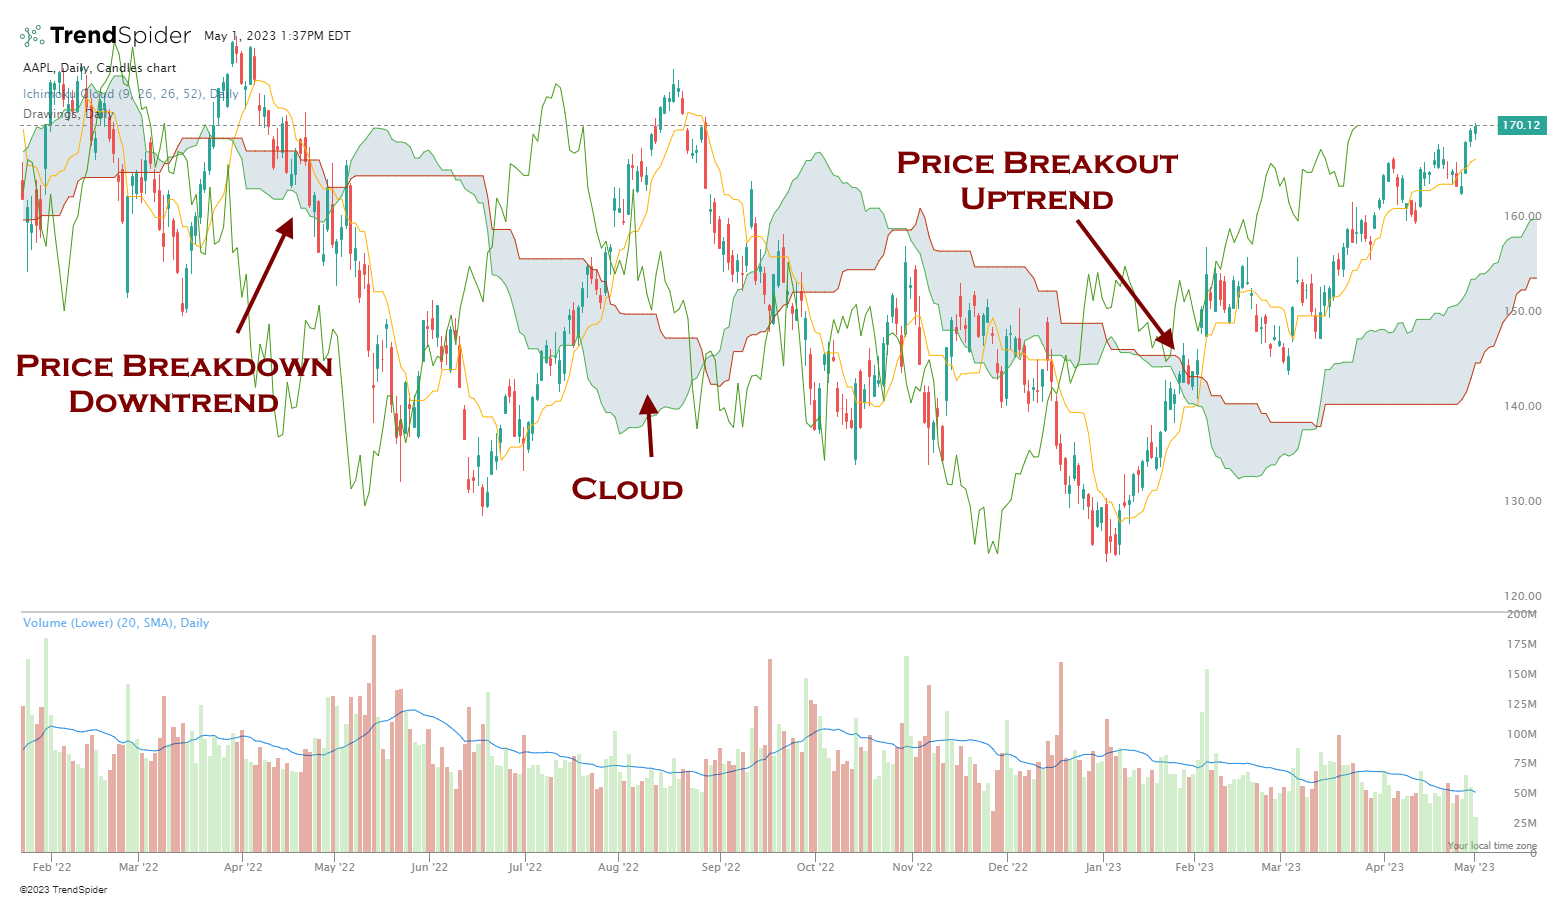
Swing trading breakouts occur when prices break out of ranges, either above resistance or below support, signaling a potential upward or downward move. To capitalize on breakouts, traders watch for signs of a breakout, such as increasing volume or tightening ranges, before entering a position.
In addition, traders can also watch for the prices to break out of their consolidation patterns and start moving in a particular direction. Once this occurs, traders can determine if the move is likely to continue and enter into a position accordingly.
How to swing trade a breakout strategy
A popular tool for swing trading breakout patterns is the Ichimoku Cloud. The Ichimoku Cloud is a technical indicator comprising several components forming an overall market picture. These components are the Tenkan-Sen, Kijun-Sen, Senkou Span A, and Senkou Span B. Together, these components help identify potential market trends and indicate when a breakout may occur.
TrendSpider Enables Automated Swing Trading Strategy Backtesting
4. Momentum Trading Strategy
Momentum trading involves taking advantage of strong momentum in the market by buying stocks with rapid price appreciation and short-selling stocks with rapid price depreciation. To succeed with this strategy, traders need to understand technical analysis tools such as moving averages and stochastic oscillators that help identify momentum signals early on.
Swing trading momentum involves spotting short-term trends in the market and riding them for some time. Traders should look for stocks with an established trend and clear support and resistance levels. When the stock reaches a support level, traders can buy the stock, hoping to make a profit when the price rises again. Similarly, traders can sell short when it reaches a resistance level in anticipation of a similar decline on the other side. This strategy relies heavily on technical analysis tools such as moving averages, stochastic oscillators, and money flow to identify potential entry and exit levels.
How to swing trade a momentum strategy
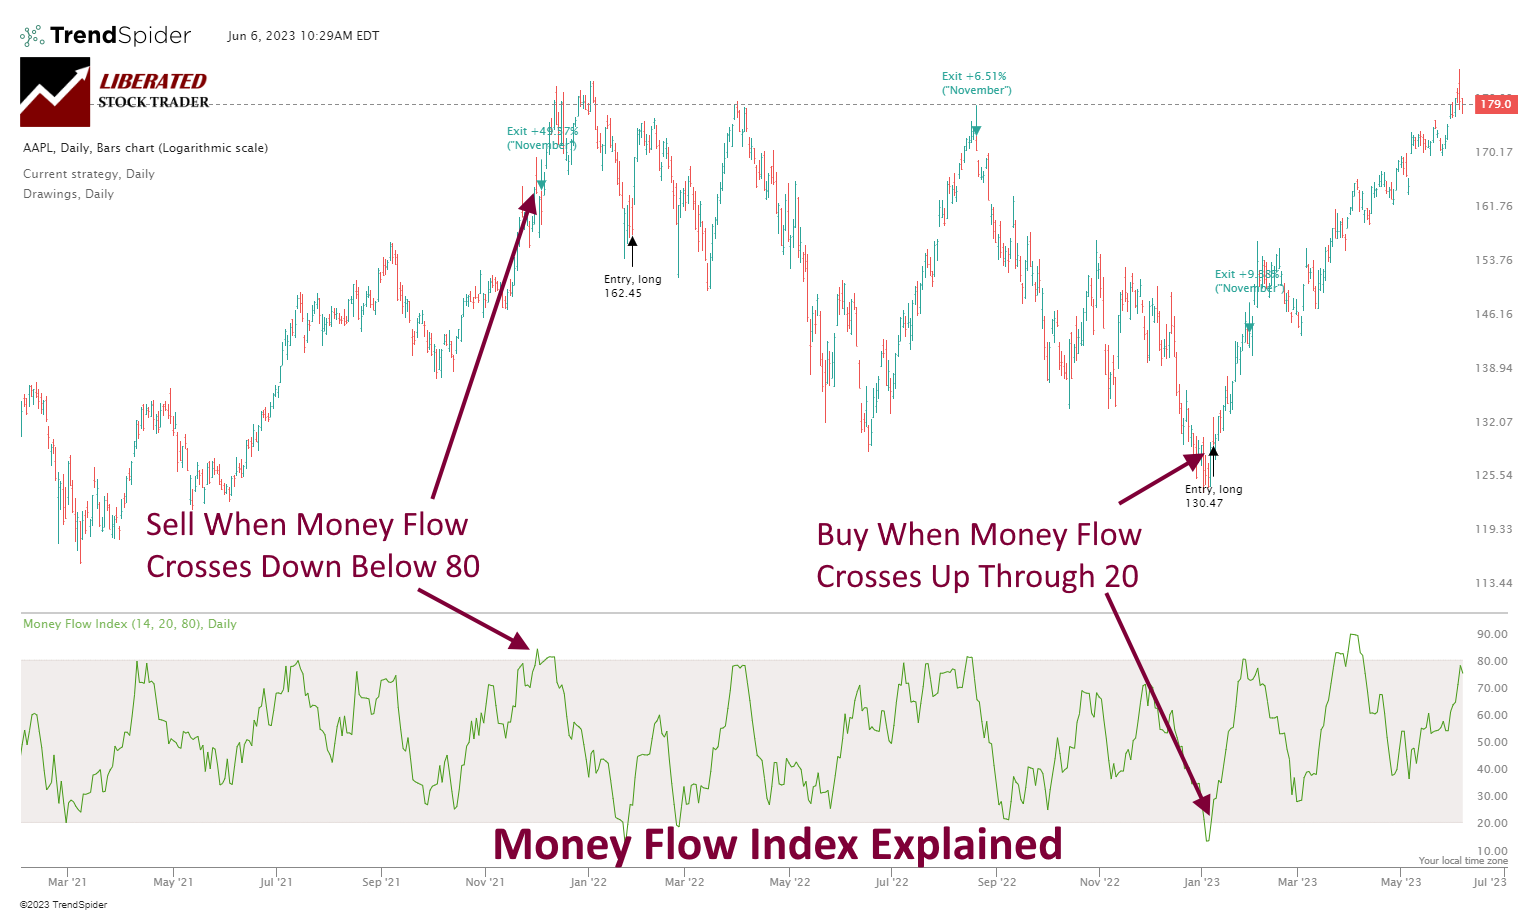
The money flow indicator can be used as a tool for swing trading. This indicator measures the difference between buying and selling pressure in the market, displaying it as either a positive or negative number. The indicator will be positive if there is more buying pressure than selling. Conversely, if there is more selling pressure, it will be negative.
A trader can use this information to determine whether to enter a trade based on the strength or weakness of buying/selling pressure. For example, if a particular stock has strong buying pressure, it may be a good time to enter a long position. On the other hand, strong selling pressure could indicate that it is time to exit an existing position or even enter a short one.
Backtest All Indicators with TrendSpider
Our tests reveal the Money Flow Index is a profitable indicator for swing traders. Please read our article testing the money flow index indicator.
Money Flow Index Indicator Best Settings & Reliability Tested
5. Reversal Trading Strategy
Reversal trading is another swing trading strategy used by traders who anticipate major stock price reversals after making significant moves up or down over a given period. This type of trading requires precise timing to maximize profits from trend reversals, so traders must keep an eye on key indicators such as RSI (Relative Strength Index), MACD (Moving Average Convergence Divergence), and Money Flow Index.
How to Use the Parabolic SAR for Swing Trading
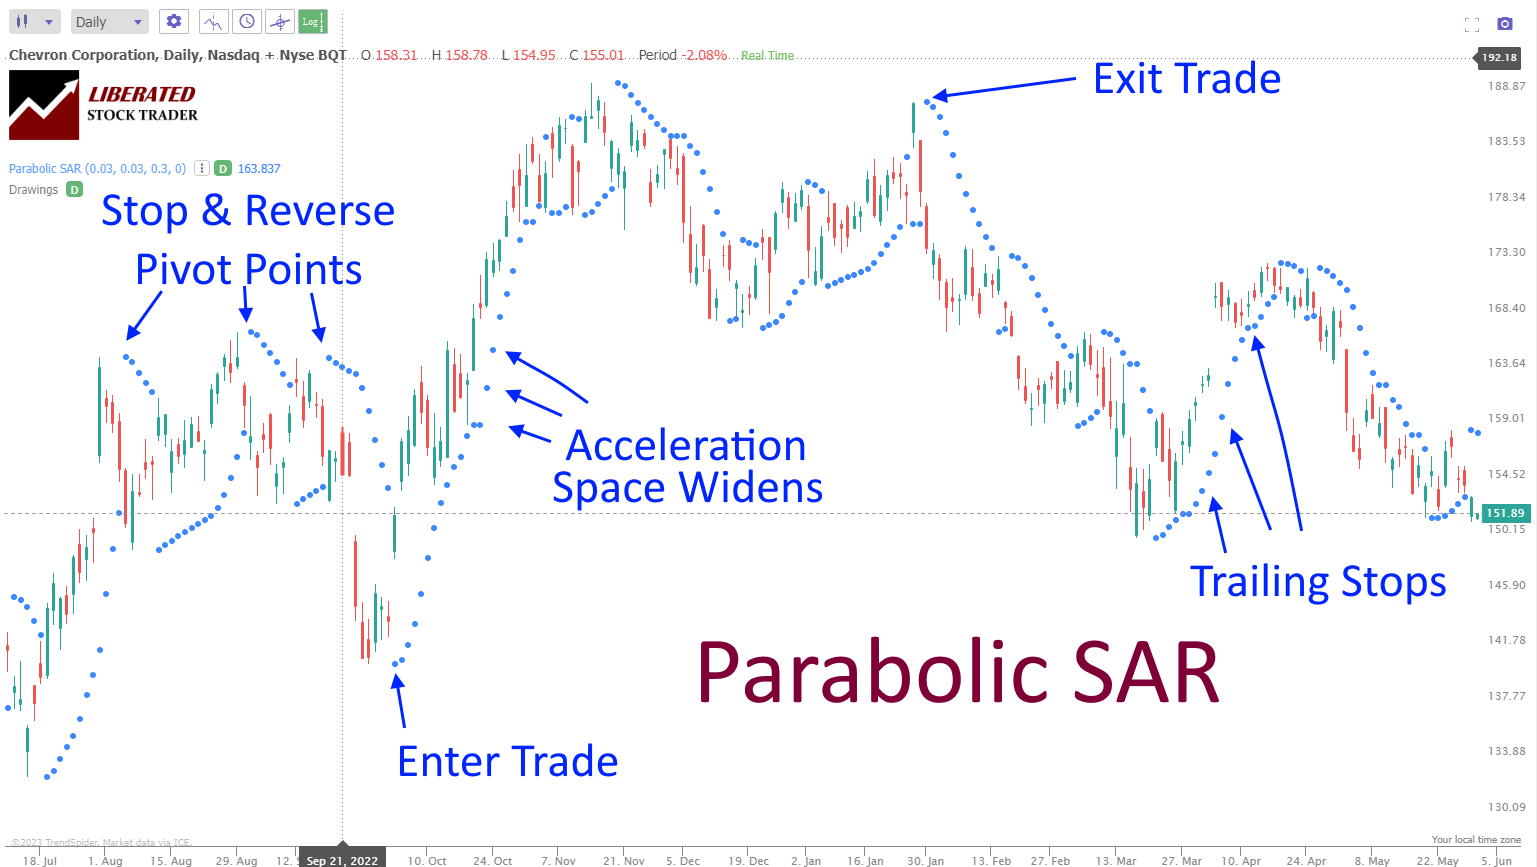
The Parabolic Stop and Reverse (SAR) indicator is used to identify potential trend reversals in stocks. This indicator plots a dot above or below the price of a stock depending on its momentum. When the dot is positioned above the price, there’s an indication that the stock may experience an upward reversal. Conversely, when the dot is positioned below the price, there’s a signal that the stock may experience a downward reversal.
Traders must use SAR alongside other technical indicators, such as RSI and MACD, for confirmation before entering into swing trades. Many traders believe that trading with the Parabolic SAR requires accurate timing to succeed. Traders should
Create the Perfect Swing Trading Strategy with TrendSpider
Not all chart indicators are profitable; at least half of technical indicators cause losses, so it is important to test your strategy properly.
How to Backtest Chart Indicators Before You Swing Trade.
Equipped with the right strategy, your pathway to success in stock trading becomes much more promising. But how about automating that same strategy to eliminate any guesswork? Enter TrendSpider, your ultimate ally. With its remarkable strategy tester feature, you can backtest the Money Flow Index, RSI, MACD, and other popular indicators to evaluate their historical performance. Gain invaluable insights into your trading even before you make a move.

Get Powerful Indicator Backtesting & Auto-Trendlines in TrendSpider
And that’s not all – TrendSpider’s automated alerts and bot system allow you to automate these strategies across any time frame. Don’t miss out on exploring their feature-packed platform today – your trading journey awaits!
The Best Chart Patterns for Swing Trading
Over several decades, extensive research has been conducted into the most successful chart patterns for swing trading, like the double bottom, cup and handle, and inverse head and shoulders. These patterns have over an 80% success rate, according to the Encyclopedia of Chart Patterns.
Our extensive coverage of the best bullish chart patterns and the 23 best stock chart patterns will help you be profitable.
22 Best Stock Chart Patterns Proven Reliable By Data Testing
Pros:
- Take advantage of larger trends in the market and reduce risk by waiting for reliable entry signals.
- Can hold positions for days or weeks to achieve higher reward potential from a single trade.
- Monitor multiple markets using different strategies at once to increase profitability.
- With TrendSpider’s intuitive interface, you can easily design a comprehensive swing trading strategy.
Cons:
- Requires diligent attention to monitor for entry and exit signals.
- High trade frequency can increase transaction costs.
- Volatile markets with large swings can create challenging trading conditions.
- TrendSpider leverages its auto-trendlines technology and AI-driven alerts to help you stay ahead of the market, giving you an edge in any swing trading situation.
FAQ
How long is a swing trade?
Swing trading typically involves positions held for days or weeks but can range from a few minutes to several months. As such, swing traders can potentially capture larger rewards from a single trade than day traders. The key is finding an entry and exit point to maximize profits while limiting risk.
How much time do I need to Swing Trade?
Swing traders devote anywhere from minutes to several hours daily to researching and studying chart patterns, backtesting technical indicators, and developing their strategy. The amount of time you dedicate to active swing trading depends on your comfort level and using effective tools like TrendSpider.
What is the Best Software for Swing Trading?
Therefore, if you're serious about swing trading, staying on top of the market and reacting quickly to changing conditions is important. To that end, TrendSpider's advanced technical analysis tools provide real-time alerts so you can take action when needed.
Is Swing Trading Risky?
Swing trading involves risk but is not inherently more risky than day trading or scalping. It all depends on how you manage your trades. Having a sound strategy and using tools like TrendSpider to test your tactics can help you make informed decisions and manage your risk accordingly.
Is swing trading profitable?
Swing trading can be a highly profitable way to trade in markets, but it is important to understand that success is not easy. It requires discipline and the ability to execute strategies quickly and accurately. Tools like TrendSpider can help you identify opportunities more quickly using its market scanner to increase your chances of success as a swing trader.
How to scan stocks for swing trading?
A market scanner like TrendSpider can make finding potential trade setups much faster and easier. Its advanced algorithms are designed to scan the markets with lightning speed and pinpoint areas of interest. It also provides technical analysis indicators like moving averages, Elliott Waves, and Fibonacci levels, making it easy to identify entry and exit points.
How to use a stock screener for swing trading?
A stock screener can be a powerful tool for swing traders. To use a scanner for swing trading, you should quickly filter through stocks based on criteria you set, such as market capitalization, price volatility, and technical indicators like Money Flow Index or RSI. This makes it easy to find high-potential stocks that meet your trading criteria.
Can I make money swing trading?
Yes, you can make money swing trading if you can identify stocks with the potential for large swings. Properly analyzing a stock's price movements and basing your decisions on relevant technical indicators and data points can help you increase your chances of success. Understanding market trends and sentiment is important to predict potential price movements accurately.
Can I short-sell in swing trading?
Yes, you can short-sell in swing trading if you determine that a stock's price will likely decrease. When engaging in short selling, it is important to understand the high risks associated with this strategy and ensure that you have enough liquidity to cover your position. Many traders use technical analysis tools such as trend lines and Fibonacci retracement levels to gain insights.
What technical indicators are best used in swing trading?
Popular technical indicators in swing trading include moving averages, support and resistance levels, Ichimoku cloud, Fibonacci retracement levels, and stochastics. These tools can help traders identify important areas where a stock's price may change directions or break out of a pattern.
How often do I need to check my stocks when swing trading?
Swing traders typically check their stocks multiple times daily to take advantage of short-term opportunities in the market. However, some traders may also use longer-term strategies that require less frequent monitoring.
Do I need to use stop-loss orders when swing trading?
Yes, it is important to use stop-loss orders when engaging in any trading to limit your potential losses. As with any strategy, assessing risk before entering any trade is essential, ensuring you have an exit plan if needed.
Does swing trading work?
Swing trading is a popular way to trade the stock market but does not guarantee success. Like any other form of speculation, swing trading involves risk, and one should always ensure a thorough understanding of the markets before making any trades. Swing traders must also be prepared to manage their positions continuously to maximize gains and minimize losses.
How much money do you need to start swing trading?
The amount of money you need to start swing trading will depend on the type of broker you use and what kind of strategies you intend to employ. Generally, most swing traders will require at least $1,000-$2,000 in capital to get started, but it is important to remember that this is a risky investment and should be treated as such.
How profitable is swing trading?
The level of profitability you can achieve from swing trading will depend on the strategies you employ and the intelligence of your trades. With a swing trading strategy, do not expect to make more than 25% per year. Swing trading is considered a higher-risk form of investing, offering greater returns than more conservative investments.
Can I make a living swing trading?
It is difficult but possible to make a living swing trading. If you are successful, you can expect a 25% profit per year, which means to live off your profits, you will need at least $200K of capital to make $50K per year.
Summary
Ultimately, swing trading can be a profitable venture if done properly. However, to make successful trades, it is important to understand the market and the risks associated with swing trading. Advanced tools like those provided by TrendSpider can help you stay ahead of the curve and maximize your profits when trading.