The cup and handle chart pattern is the most reliable in technical analysis. Its shape resembles a cup with a handle on the right side.
Twenty years of trading research show that the cup and handle pattern has a 95% success rate in bull markets and returns an average profit of +54%.
The cup and handle is reliable and accurate but can be difficult to identify. With 61% of cup and handle pattern trades reaching the average price target, this is a good trading setup.
Discover how to spot, target, and trade the cup and handle to improve your trading results!
How Reliable is a Cup and Handle?
Published research shows a cup and handle pattern is incredibly reliable, with a 95% success rate on a continuation of an uptrend in a bull market. When the price breaks up through resistance, it has an average 61% chance of a 54% price increase.
| Chart Pattern Test | Cup and Handle |
| Success Rate | 95% |
| Average Price Change | +54% |
Research Highlights
- The cup-and-handle is a bullish continuation pattern.
- This cup and handle is the most reliable pattern in technical analysis.
- The cup forms a wide U-shape over at least 30 days.
- The handle is a downsloping trend after the cup is formed.
- The pattern is proven successful in the Encyclopedia of Chart Patterns
What Is a Cup and Handle?
According to research, the cup and handle is a bullish continuation chart pattern, with an impressive 95% success rate. The pattern consists of two distinct parts: the cup and the handle. The “cup” portion of the pattern forms with a downward move in price, followed by an upward rally that terminates near the price level of where it began. This forms a U-shape or “cup.” The “handle” forms when the price pulls back downward again, usually within a 5-20% range and near the cup’s low before resuming its upward trend.
The cup and handle chart pattern is a technical analysis trading strategy in which the trader attempts to identify a breakout in asset price to profit from a strong uptrend.
The cup and handle chart pattern is considered reliable based on 900+ trades, with a 95% success rate in bull markets.

Auto-detect this Chart Pattern with TradingView
How to Identify a Cup and Handle?
The cup and handle chart pattern is difficult to identify. First, you will notice a “cup” shape in the chart that forms when an asset’s price rises, then retraces in a long U-shape that forms over at least 30 trading days. Secondly, you will see two declining trendlines forming the “handle.” The handle should be less steep than the cup and last at least five days.
The breakout occurs when the asset’s price breaches the cup pattern’s highest point, known as the resistance line. It often indicates that a strong uptrend will occur. Traders look for a strong volume increase to confirm the breakout. After the breakout, you can expect to see a long upward price trend that lasts anywhere from several weeks to several months.
To help identify cup-and-handle patterns quickly and easily, use TradingView’s pattern recognition tool. It helps you easily detect cup and handle patterns, making it much easier to identify high-probability trades.
Trading a Cup and Handle
To trade cup and handle chart patterns, look for a price breakout above the cup’s rim and the top of the handle. Enter a long trade after the price closes above the rim and place a stop loss below the breakout. Verifying a higher volume of trade at the breakout increases pattern reliability.
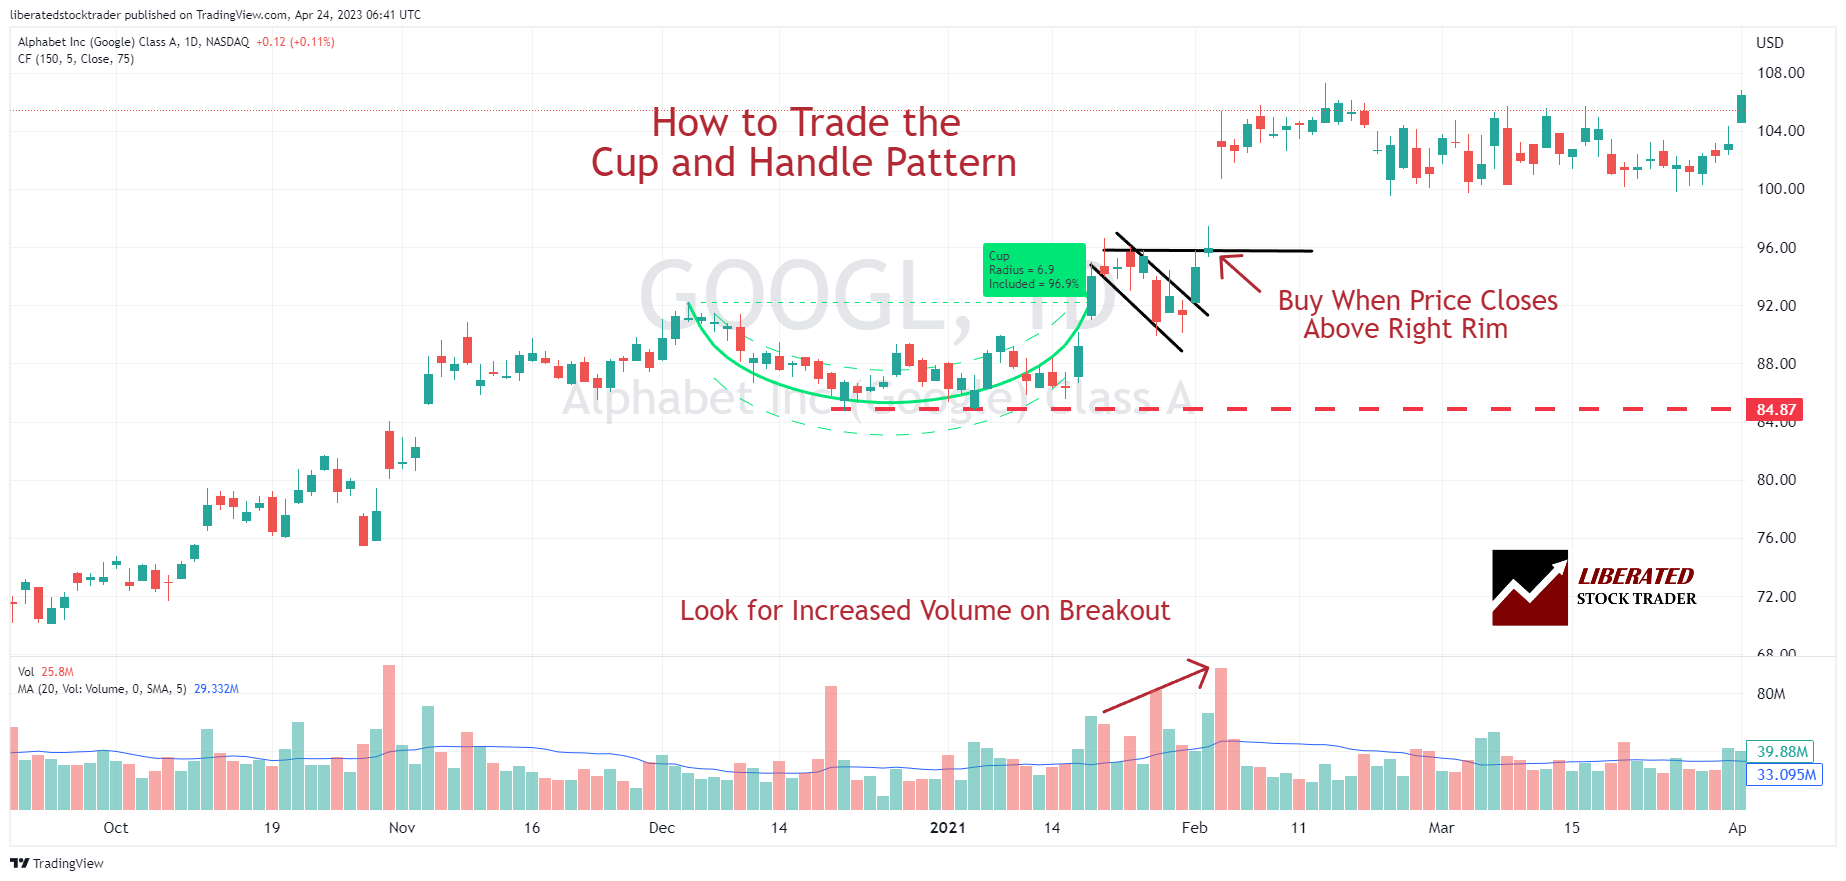
Traders should pay attention to volume when trading a cup and handle chart pattern. Higher volume on the breakout is often considered a confirmation of trend in this setup (see the above chart). This means traders should be vigilant and wait for higher volumes before entering a trade on any breakout situation.
Cup and Handle Entry and Exit Points
The entry point for a cup and handle trade is at the break of the resistance neckline after the handle is formed. Traders should place a stop-loss order below the neckline to protect against potential losses. The exit point can be determined by setting a price target based on the cup depth. (See Chart Below)
Cup and handle formations can fail at a 5% or higher rate during bear markets. To mitigate the risk of a failed pattern, traders should have a clear exit strategy. Proper risk management techniques are crucial to limit losses and maximize profits during any trade.
Price Targets
To set a price target for a cup and handle, traders can measure the depth of the cup from its high point to its low point. For example, if the cup has a depth of $10, then the price target should be set at $10 above the breakout level. This will provide a high-probability exit point with a healthy potential for profit. Additionally, traders can use a trailing stop loss to protect their profits if the stock reverses direction due to outside influences.
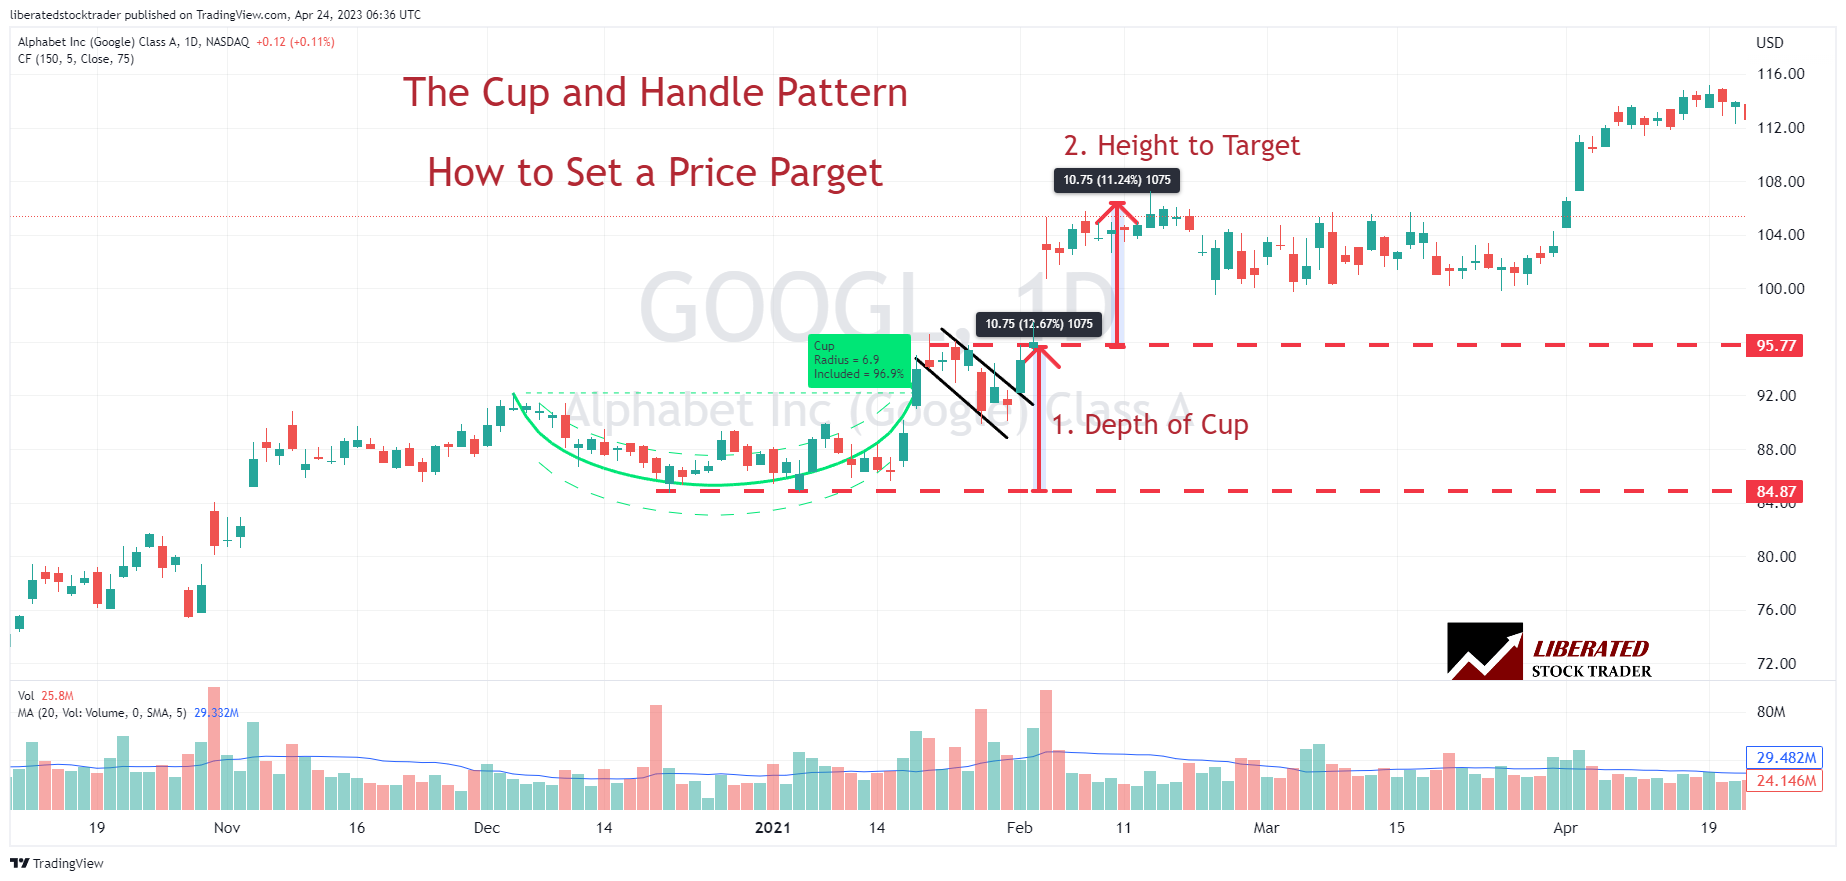
The chart above shows that the height/depth of the cup and handle is equal to the price target.
Trading Timeframe
Cup and handle patterns can form across various timeframes, from intraday to weekly charts. However, the most reliable timeframe is a daily chart, with the pattern forming over multiple weeks. Even though cups and handles are uncommon, they are effective for longer-duration trades.
What Happens After a Cup and Handle Pattern?
Two decades of research by Tom Bulkowski show that after a cup and handle pattern is confirmed on a break of the neckline on higher volume, the price increase averages +54%.
Once the cup and handle pattern is confirmed, traders should consider opening a long position near the support area and placing a stop-loss order below the lower low. By doing this, traders can better manage their risk as they enter a trade.
What Happens with a Failed Cup and Handle Pattern?
A cup and handle in a bull market fails only 5% of the time. When a cup and handle pattern fails, the stock price falls below the neckline support and continues to decline or consolidate sideways. Proper risk management is essential to limit losses on failed patterns.
Automatically Identify the Cup and Handle
Using TradingView pattern recognition, you can automatically identify cup and handle patterns. Go to TradingView > Click Indicators > Type “Cup.”> Select “Cup Finder.” Now, a chart with a cup and handle pattern will be clearly marked.

Pattern Rules
- The cup should be roughly bowl-shaped, forming a “U” shape.
- The handle should form a downward-sloping channel that dips below the cup’s rim.
- The pattern should mark a significant price high before forming the cup.
- A buy signal is triggered once the price breaks above the cup’s rim.
- The pattern breakout needs to be on higher trading volume
The Best Chart Pattern Scanners
Two trading platforms currently offer in-depth pattern scanning and screening: TrendSpider and FinViz. Finviz is a good free pattern scanner, whereas TrendSpider enables full backtesting, scanning, and strategy testing for chart patterns.
TrendSpider Pattern Scanning in Action
Scanning for chart patterns with TrendSpider is easy. Visit TrendSpider, select Market Scanner > All of the Following >Chart Pattern > Scan. You will be presented with a list of chart patterns you want to trade.
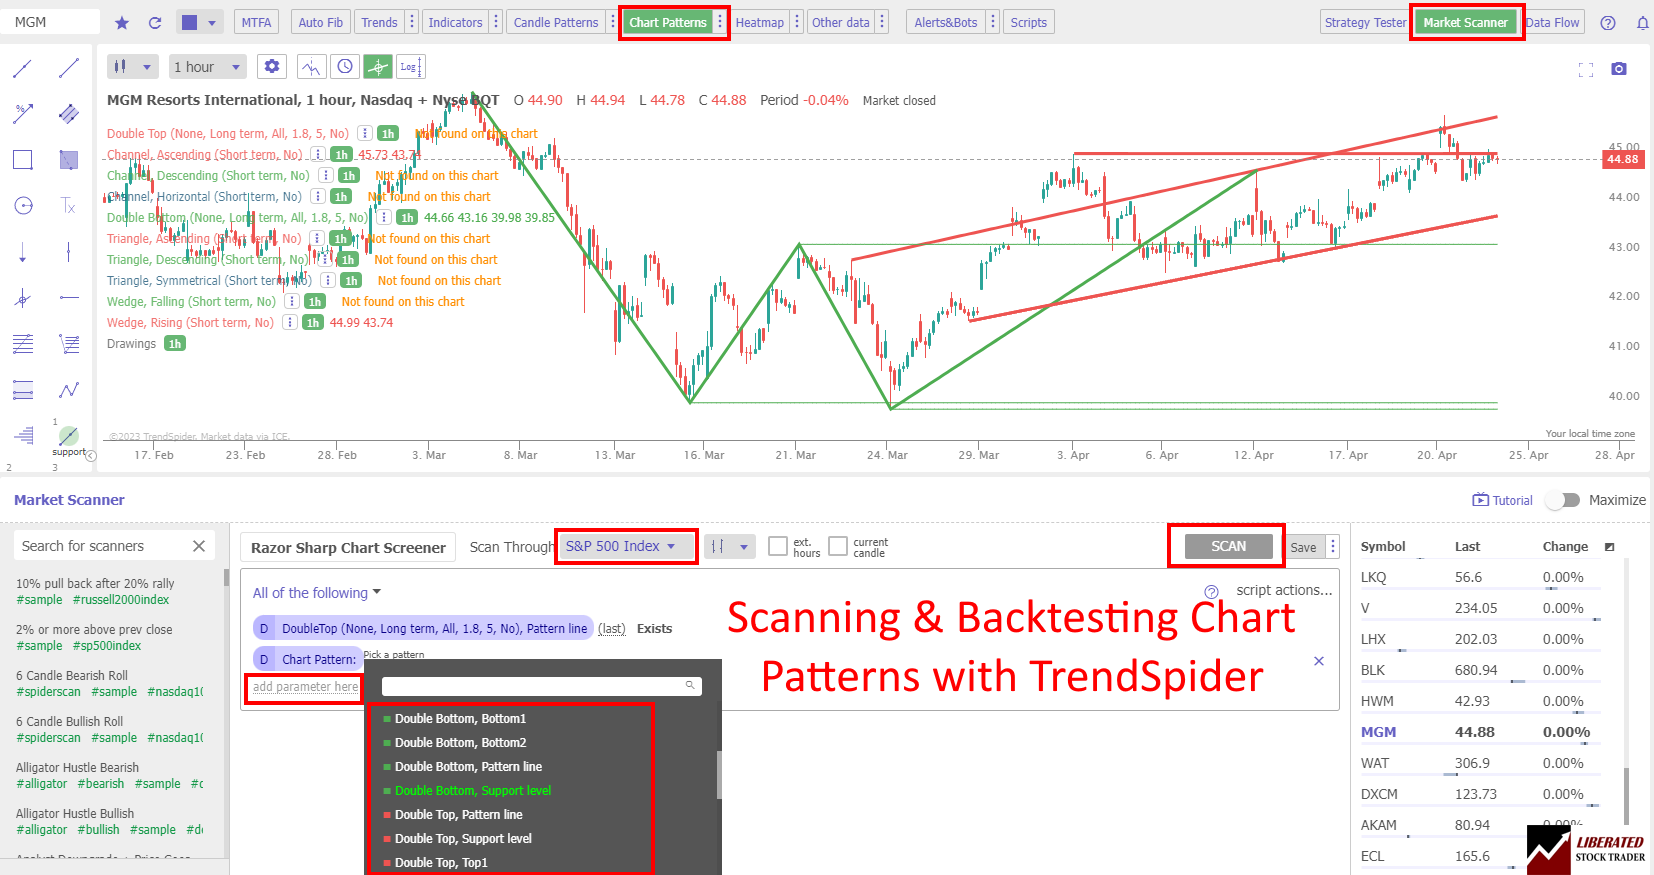
Scan for this Chart Pattern with TrendSpider
Using AI-Driven Pattern Detection
One of the major benefits of using AI-driven technical analysis tools like TrendSpider is the ability to backtest historical data. This allows traders to compare the performance of their strategy over different periods and markets. With TrendSpider, you can go back in time to find stocks exhibiting cup and handle patterns and then use the platform’s advanced analytics tools to analyze how effective this pattern was for trading at any given time. TrendSpider’s AI-driven algorithms also help traders identify the most reliable entry and exit points for cup and handle patterns.
By combining AI-driven technical analysis with traditional charting methods, TrendSpider helps traders take full advantage of market opportunities presented by chart patterns. In addition, its interactive charts allow traders to analyze various aspects of the pattern without manually drawing each line onto the chart.
Scan for Chart Patterns for Free
FinViz has a great feature for scanning 28 chart patterns. To Scan for chart patterns, Visit FinViz > Select Screener > Technical > Charts > Pattern >Select a Pattern. This is especially useful to traders who want to monitor potential trading opportunities.
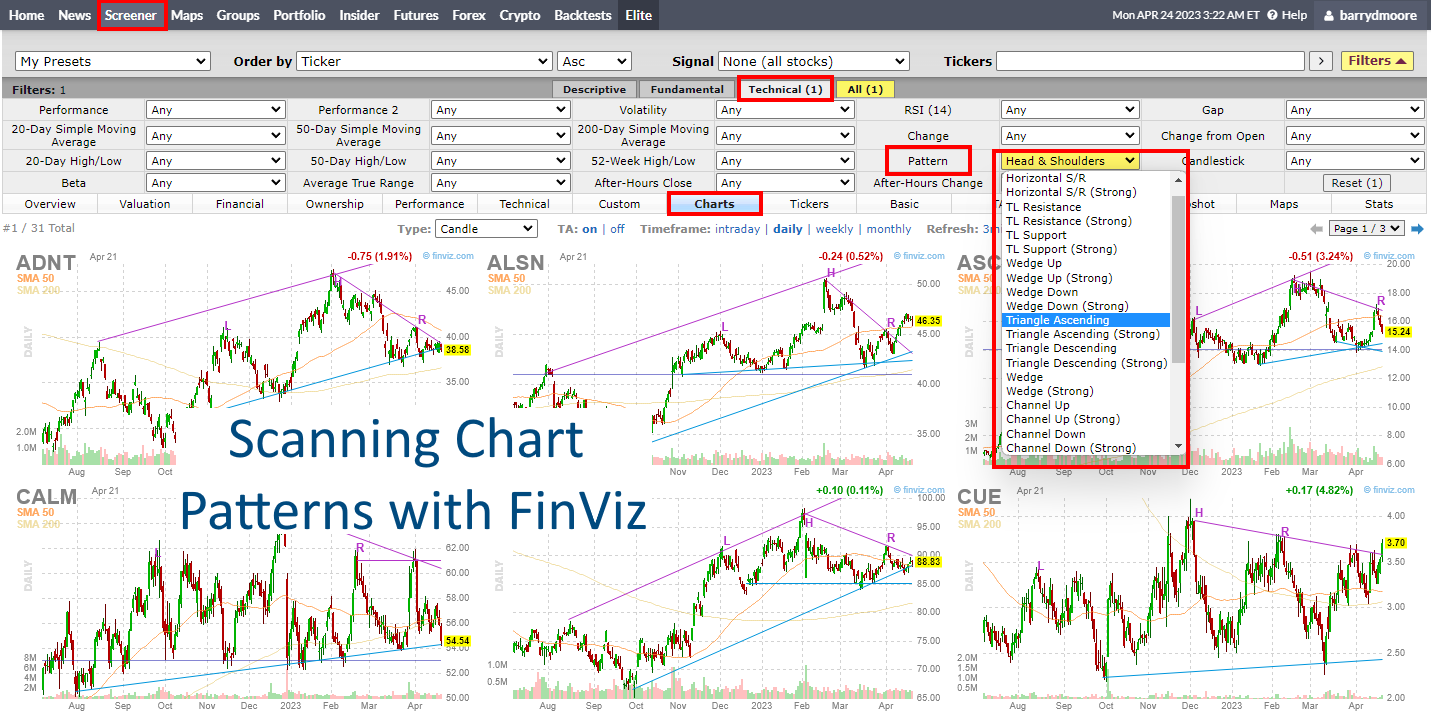
Scan for this Chart Pattern with FinViz
The first step to finding stocks that have profitable chart patterns is to select a set of criteria. Finviz offers a range of pre-defined filters and sorting options, enabling traders to quickly narrow their search by sector, industry, market capitalization, and more. After selecting the desired criteria, traders can apply the filter to the Finviz screener.
Once the filter has been applied, traders can then view the results on a chart. Several stocks may meet the criteria depending on the complexity of the search criteria. By clicking on each company name, traders can open up a chart.
Final Thoughts
Cup and handle formations are a reliable chart pattern that can offer high-probability trades for experienced stock traders. By utilizing proper risk management techniques, traders can maximize their potential profits while limiting losses. When entering any trade, it is important to remember the fundamentals of trading and not just focus on chart patterns. Combining sound fundamental analysis with technical indicators can provide a more comprehensive approach that can increase your chances of success in trading.
Ultimately, it is up to traders to decide if they wish to pursue cup and handle formations as part of their overall trading strategy.
FAQ
How to measure a cup and handle pattern?
TradingView can automatically measure a cup and handle pattern and set a price target. Alternatively, to measure manually, use an arithmetic chart and plot the depth of the cup. This distance will equal the future price target, which you should annotate in the breakout direction on the chart.
Is a cup and handle a continuation or reversal pattern?
Testing shows that the cup and handle is a continuation pattern. This pattern is highly predictive, up to 95%. It's important to note that a cup and handle pattern may take three weeks up to one before the breakout happens. As such this pattern is not for day traders.
What are the best cup and handle pattern scanners?
The best cup and handle pattern scanner is TradingView. Every chart you review in TradingView will automatically be scanned for a cup and handle pattern, and you can run backtests on the pattern.
What are the risks of trading a cup and handle?
The biggest risk of trading a cup and handle is a 5% chance of not breaking even or the 63% chance it will not meet its price target. Smart traders will manage risk and use a rolling stop-loss.
Do cup and handle patterns hold?
Cup and handle patterns hold only 95 percent of the time on an upward breakout in bull markets, according to decades of research compiled by Tom Bulkowski in his book The Encyclopedia of chart patterns. This means it is one of the better-performing chart patterns.
How to identify cup and handles?
Cup and handle patterns can be identified automatically with TradingView. Alternatively, you can manually identify it by looking for a U-shaped pattern spanning at least two months, followed by a price decline of at least five days.
Is a cup and handle pattern profitable?
Yes, a cup and handle pattern yields an average profit of 54 percent; it is a good way to identify potential high-probability trades. Tom Bulkowski's research confirms an accuracy of 95 percent for cup and handle patterns with an average profit potential of 54 percent.
Can a cup and handle fail?
Yes, at least 5% of cup and handles patterns fail. The typical cup and handle have a strong trend formed over many months, meaning the price has a high probability of emerging bullish after trend confirmation.
How reliable is a cup and handle pattern?
The cup and handle pattern is an incredibly reliable chart indicator, with success rates of 95 percent during a bull market. The pattern is most reliable when formed over many months.
Is a cup and handle good or bad?
Considering the evidence, the cup and handle is a good pattern for swing traders. Because this pattern takes months to form, it is not ideal for day traders or scalpers.
What is the success rate of a cup and handle?
According to Tom Bulkowski's research, the success rate of a cup and handle is a 95 percent chance of a 54 percent price increase in a bull market on a continuation of an uptrend. Traders should note this the pattern meets its 54 percent target only 63 percent of the time.
How do you target stop losses in cup and handle patterns?
Traders should set the approximate target stop loss level in a cup and handle at the point above the cup's rim after the handle is formed. The exact percentage stop loss depends on the price target expectations and the timeframe.
What are the benefits of trading cup and handles?
Cup and handles allow traders to enter a position at the start of a new strong uptrend, thus maximizing profits. Additionally, they give traders confirmation that a bull trend is likely to continue.
How accurate is a cup and handle pattern?
Published research demonstrates cup and handle patterns are highly reliable, being bullish 95 percent of the time, with a 63% chance of a 54% gain—source: The Encyclopedia of chart patterns.
Can a cup and handle be bearish?
Cup and handles can be bearish, but it is quite rare. If the price reverses and declines after the pattern is confirmed, it is considered bearish, and the pattern has failed.
What is the opposite of a cup and handle pattern?
The opposite of a cup and handle pattern is an inverse cup and handle pattern. Unlike the bullish cup and handle, the inverse cup and handle is bearish and provides a reliable setup for short trades in downward-trending markets.
Learn the Success Rates of 65 Chart Patterns
The Encyclopedia of Chart Patterns by Tom Bulkowski details the reliability and success rates of 65 chart patterns and shows you how to trade them. It is an indispensable resource for traders and investors seeking to enhance their profitability by leveraging stock chart patterns. This comprehensive reference book provides in-depth explanations and detailed illustrations of over 65 different patterns, including Head and Shoulders, Double Tops, Wedges, Flags, Gaps, and more.
