
Our updated 56-year S&P 500 seasonality research shows that the best month to buy stocks is October if your goal is to capture the historically strong October-to-January period. November is the strongest individual month, with an average monthly return of approximately 1.6%, while September remains the weakest month, averaging about -0.8% since 1970.
| Quick Answer | Updated Result |
|---|---|
| Best month to buy stocks for the seasonal run | October |
| Strongest single month for S&P 500 returns | November |
| Weakest month historically | September |
| Best seasonal buying window | October through January |
| Best time to reduce seasonal risk | Before September weakness |
| Dataset period | 1970–2025, full calendar years only |
Stock market seasonality is not a guarantee, and it should never replace company research, valuation analysis, or risk management. But long-term market history does show recurring patterns. Certain months have repeatedly delivered stronger average returns than others, and those patterns can help investors understand when market conditions have historically been more favorable.
31-Year Seasonality Chart for the S&P500
What Is the Best Month to Buy Stocks?
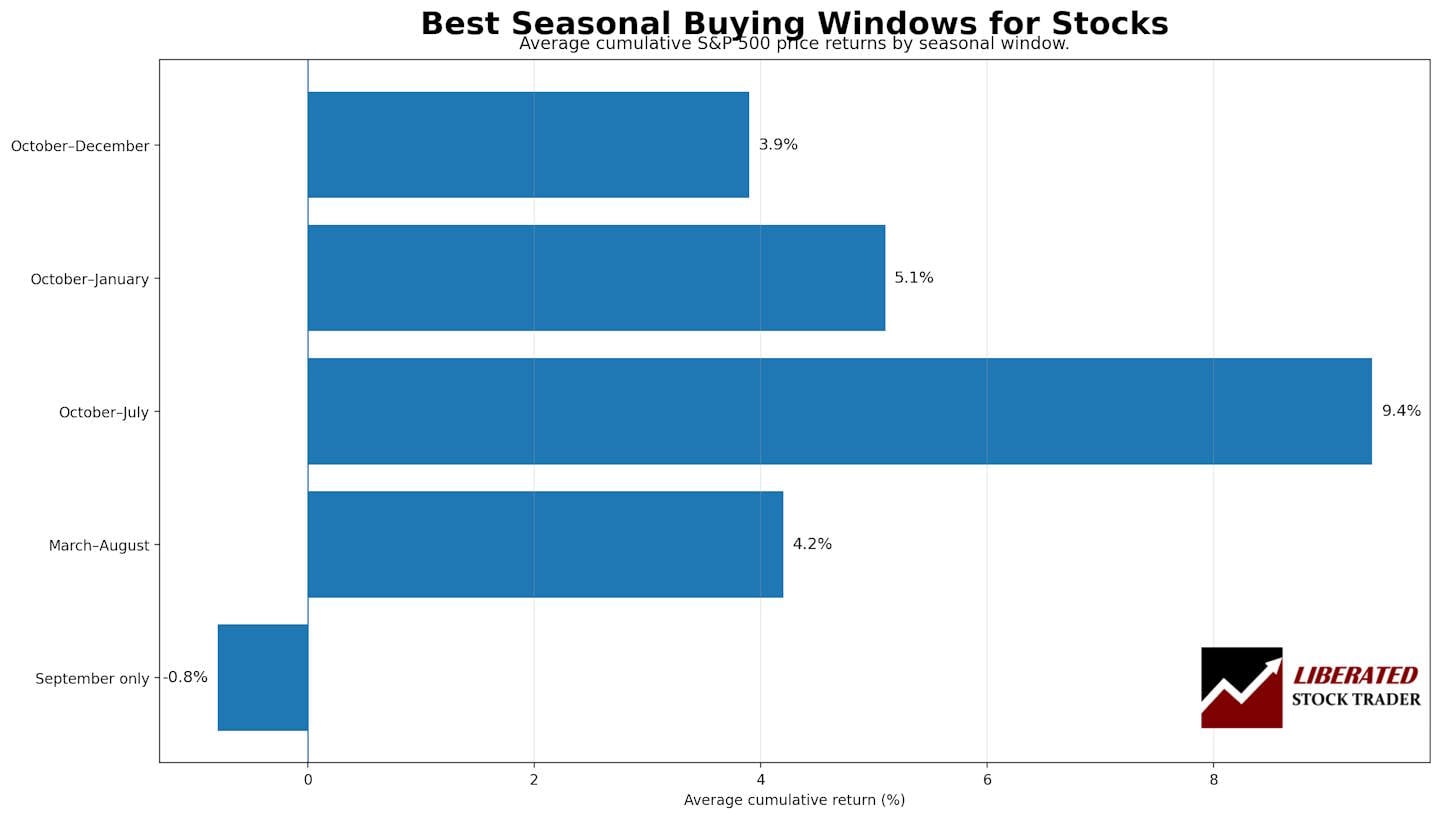
The best month to buy stocks is October, when judged by the seasonal pattern. Since 1970, October has marked the beginning of the strongest four-month stretch in the S&P 500: October, November, December, and January. Together, those four months have produced an average cumulative return of about 5.1%.
November remains the strongest individual month, averaging about 1.6% since 1970. December and January are also historically strong, while October matters because it marks the start of the favorable seasonal window. In practical terms, the data suggests that investors who wait until after September weakness and buy around October have historically positioned themselves ahead of one of the market’s strongest seasonal periods.
This does not mean October will always be positive. October includes famous crashes, such as those in 1987 and 2008. The point is not that October is risk-free; it is that, on average, buying after the historically weak September period has often been rewarded by the strength that follows in November, December, and January.
S&P 500 Monthly Returns: 1970 to 2025
The table below updates the original long-term monthly return analysis through 2025. Returns are rounded to one decimal place to keep the data readable. Because these are long-term averages, small methodological differences, such as using month-end prices versus monthly average closing prices, can create slight variations. The broad seasonal message is unchanged: September is weak, while October through January is the strongest stretch.
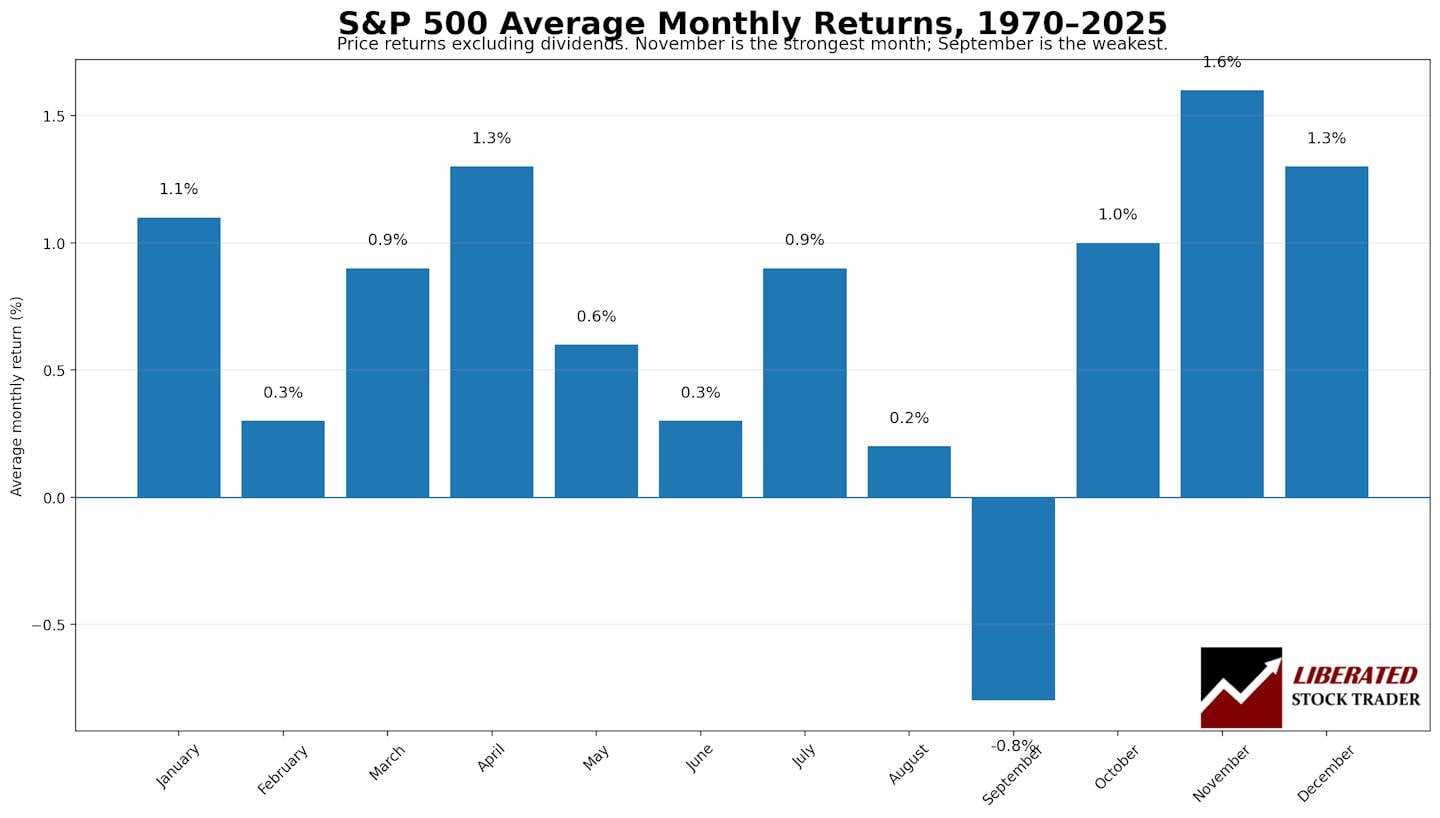
| Month | Average S&P 500 Return, 1970–2025 | Seasonal Interpretation |
|---|---|---|
| January | 1.1% | Historically positive |
| February | 0.3% | Weak positive |
| March | 0.9% | Positive |
| April | 1.3% | Strong |
| May | 0.6% | Moderate |
| June | 0.3% | Weak positive |
| July | 0.9% | Positive |
| August | 0.2% | Weak positive |
| September | -0.8% | Weakest month |
| October | 1.0% | Best seasonal entry month |
| November | 1.6% | Strongest single month |
| December | 1.3% | Strong; supports Santa rally effect |
The data shows why October is so important. October itself is not the highest-returning month, but it comes immediately after the historically weak September period and before the strongest cluster of monthly returns. For investors using seasonality as one input, October is a more useful buying month than November because it positions the investor before the strongest individual month begins.
The Santa Claus Rally also contributes to the high performance in December.
What Is the Worst Month for Stocks?
The worst month for stocks is September. From 1970 through 2025, September remained the only month with a clearly negative long-term average return, at about -0.8%. This result is consistent with the original research and remains intact even after adding the strong 2024 and 2025 market years.
For traders, this does not automatically mean “sell everything in September.” It means September deserves respect as a historically difficult month. For long-term investors, the more useful lesson is that buying aggressively at the start of September has historically carried weaker odds than waiting until the end of September or early October.
The Best Seasonal Buying Window: October to January
The strongest seasonal window for the S&P 500 runs from October through January. Using the updated data, the average returns for these four months are approximately:
| Seasonal Window | Average Cumulative Return | Investor Interpretation |
|---|---|---|
| October to December | 3.9% | Strong year-end period |
| October to January | 5.1% | Best seasonal buying window |
| October to July | 9.4% | Historically strong long holding window |
| March to August | 4.2% | Positive but less concentrated |
| September only | -0.8% | Seasonally weakest month |
The October-to-January pattern is one reason investors often talk about year-end strength, the Santa Claus rally, and the January effect. These ideas are related but not identical. The key takeaway is simpler: the final quarter of the year and the first month of the next year have historically been favorable for stocks.
The 3 Best Months to Buy Stocks
Based on average monthly S&P 500 returns from 1970 to 2025, the three strongest individual months are:
| Rank | Month | Average Return | Why It Matters |
|---|---|---|---|
| 1 | November | 1.6% | The strongest single month historically |
| 2 | December | 1.3% | Supports the year-end rally pattern |
| 3 | April | 1.3% | Historically strong spring performance |
| 4 | January | 1.1% | Positive start-of-year effect |
| 5 | October | 1.0% | Important because it begins the strongest seasonal window |
November is the best single month, but October is the better “buy month” if you are trying to capture the full seasonal move. Buying at the start of November means missing October’s average gain and entering after the seasonal move has already begun.
The Best Months to Buy Stocks Since 2000
The market has changed significantly since 2000. Online trading, ETFs, index investing, options growth, algorithmic trading, global liquidity cycles, and mega-cap technology stocks have all influenced market behavior. The 2000–2025 period also includes the dot-com crash, the 2008 financial crisis, the 2020 pandemic crash, the 2022 bear market, and the AI-driven recovery in 2023–2025.
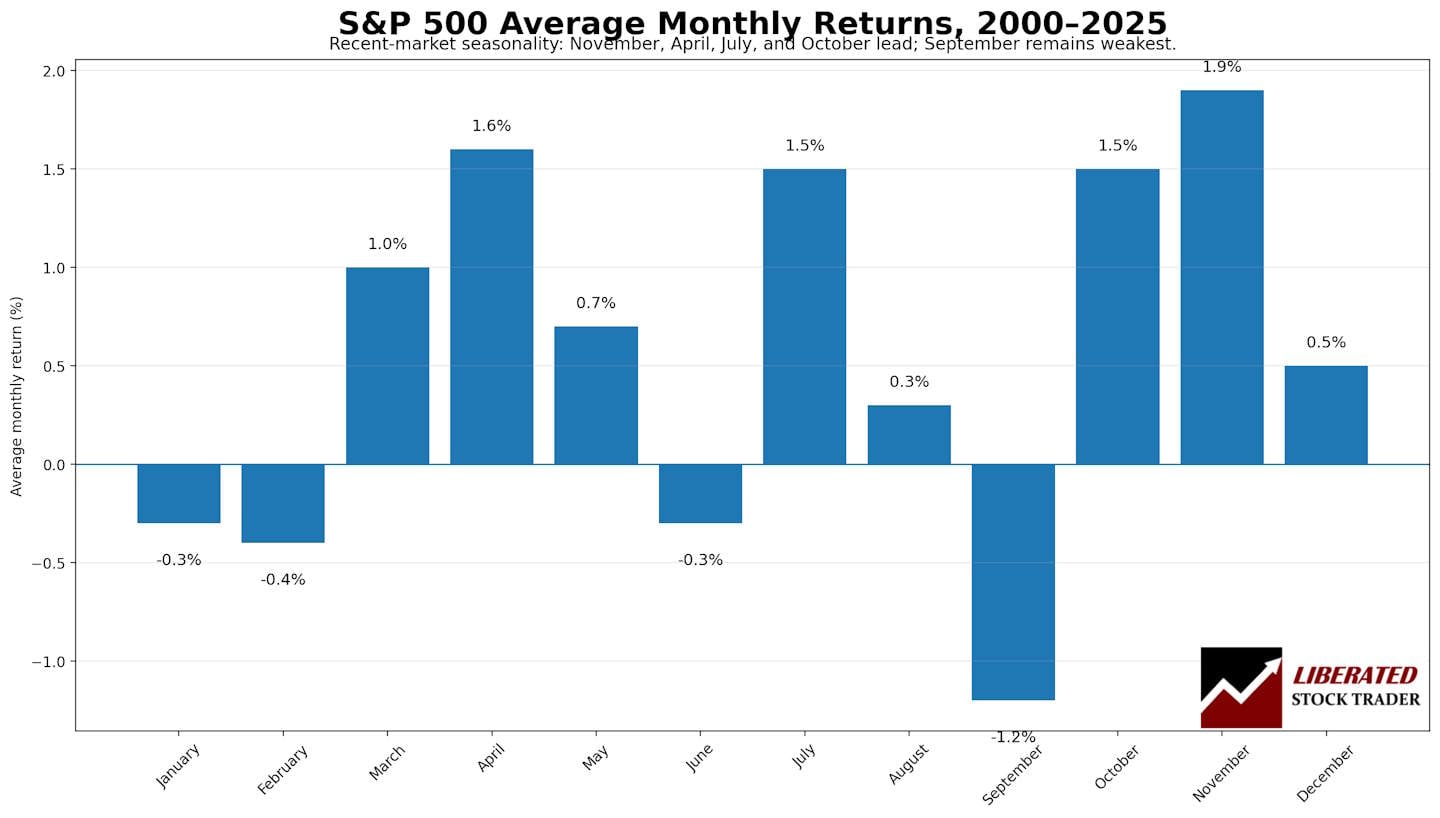
Despite these changes, the seasonal pattern still points toward strength in October, November, December, and parts of the spring. Since 2000, November has remained the strongest month, while September has remained the weakest.
| Month | Average S&P 500 Return, 2000–2025 | Comment |
|---|---|---|
| January | -0.3% | Weak since 2000 |
| February | -0.4% | Weak |
| March | 1.0% | Positive |
| April | 1.6% | Strong |
| May | 0.7% | Moderate |
| June | -0.3% | Weak |
| July | 1.5% | Strong |
| August | 0.3% | Weak positive |
| September | -1.2% | Weakest month |
| October | 1.5% | Strong |
| November | 1.9% | Strongest month |
| December | 0.5% | Positive but weaker than the long-term average |
Updated 2024 and 2025 Monthly Returns
The updated data matters because 2024 and 2025 were both strong years for the S&P 500. However, they did not remove the long-term seasonal pattern. September improved because 2024 and 2025 were positive September years, but it remained the worst month in the long-term dataset.
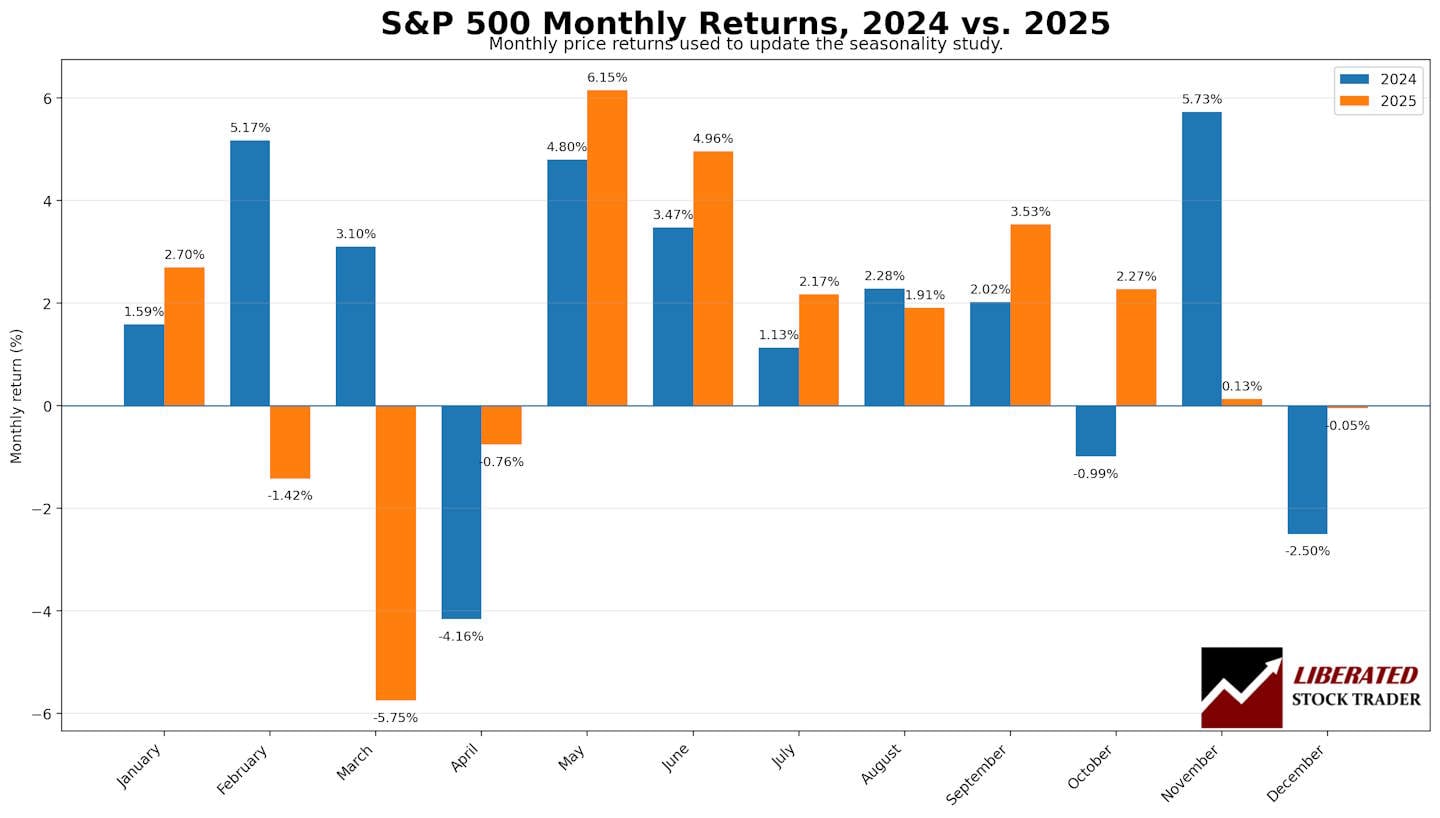
| Month | 2024 S&P 500 Return | 2025 S&P 500 Return |
|---|---|---|
| January | 1.59% | 2.70% |
| February | 5.17% | -1.42% |
| March | 3.10% | -5.75% |
| April | -4.16% | -0.76% |
| May | 4.80% | 6.15% |
| June | 3.47% | 4.96% |
| July | 1.13% | 2.17% |
| August | 2.28% | 1.91% |
| September | 2.02% | 3.53% |
| October | -0.99% | 2.27% |
| November | 5.73% | 0.13% |
| December | -2.50% | -0.05% |
One lesson from the 2024–2025 data is that seasonality should not be treated as a fixed rule. September was positive in both 2024 and 2025, while December was weak in both years. This proves the point: seasonality is useful as a probability framework, not a prediction machine.
How the Stock Market Has Changed Since 1970
The S&P 500 of the 1970s was very different from today’s market. The modern market is faster, more liquid, more technology-driven, and more globally interconnected. Investors now trade through online brokers, ETFs dominate flows, options volumes are far larger, and algorithmic trading reacts instantly to news and data.
Several major structural changes have influenced monthly returns:
- ETF growth: Investors can now buy and sell entire indexes instantly.
- Options growth: Hedging and speculation can amplify short-term market moves.
- Algorithmic trading: Markets react faster to economic data and earnings releases.
- Mega-cap concentration: A small group of technology giants can heavily influence index returns.
- Global liquidity: Central bank policy has become a major driver of market direction.
Despite these changes, the broad seasonal pattern has persisted: weakness tends to concentrate around late summer and September, while strength tends to cluster near year-end and early winter.
Why Does Stock Market Seasonality Exist?
There is no single explanation for stock market seasonality, but several forces may contribute to recurring patterns:
- Tax-loss selling: Investors sell losing positions near year-end, then reinvest later.
- Institutional rebalancing: Funds adjust portfolios around quarter-end and year-end reporting periods.
- Holiday optimism: December often benefits from lighter volume and positive investor sentiment.
- Earnings cycles: Quarterly earnings can shift risk appetite.
- Monetary policy: Central bank expectations influence market behavior throughout the year.
Seasonality is the result of many small behavioral, institutional, and economic effects interacting over time. It is not magic, and it is not guaranteed. But because markets are partly driven by human behavior, recurring calendar patterns can appear across decades.
What Is the Best Month to Sell Stocks?
Based purely on seasonality, the best time to reduce exposure is often before September weakness. Since September remains the weakest month in the long-term dataset, investors using seasonal timing may prefer to avoid adding new risk at the start of September or may wait until late September or early October to buy.
For long-term investors, this does not mean selling a diversified portfolio every August. Taxes, transaction costs, dividends, capital gains, and personal goals matter. For traders, however, the data suggests September warrants caution, and October warrants attention.
Should You Actually Time the Market by Month?
Seasonality can improve your understanding of market behavior, but it should not be the only reason to buy or sell. The best investors combine several inputs:
- Market trend and price action
- Company fundamentals
- Valuation
- Economic conditions
- Interest rates and inflation
- Risk management rules
- Portfolio allocation
If you invest in an S&P 500 ETF or another broad-market index fund, this research may be useful because the data directly track the index. But if you buy individual stocks, seasonality becomes less reliable. A single company’s earnings, debt, valuation, competitive position, and news flow can overwhelm broad market seasonal effects.
Seasonality is best used as a supporting tool. It can help with entry timing, portfolio reviews, and risk awareness, but it should never replace proper investment analysis.
Summary
The best month to buy stocks is October if you want to capture the strongest seasonal market window. November is the best individual month, but October is the more useful entry point because it comes immediately after the historically weak September period and before the strongest part of the year-end rally.
Using updated S&P 500 data from 1970 through 2025, the strongest individual months are November, December, April, January, and October. The weakest month remains September. Since 2000, November, April, July, and October have been the most favorable months, while September remains the most difficult.
The practical takeaway is simple: do not use the calendar alone to make investment decisions, but do respect the long-term evidence. Historically, late September and early October have often been better moments to look for buying opportunities than the start of September.
Research Data Notes
This article updates our original research using S&P 500 price-return data through the end of 2025. The data excludes dividends and focuses on monthly price changes in the index. This makes the analysis useful for studying market timing and seasonal price behavior. Still, long-term buy-and-hold investors should remember that total returns, including dividends, are higher than price returns alone.
FAQ
What is historically the best month to buy stocks?
October is historically the best month to buy stocks if your goal is to capture the strongest seasonal run from October through January. November is the strongest single month, but buying in October positions investors ahead of the strength in November and December.
What is the best month for stock market returns?
November is the strongest individual month for average S&P 500 price returns since 1970, with an average gain of about 1.6%.
What is the worst month for stocks?
September is historically the worst month for stocks. From 1970 to 2025, September was the only clearly negative month in the long-term average return table.
Is December a good month to buy stocks?
December has historically been a strong month, but it is usually better to buy before December if you are trying to capture the full seasonal pattern. October and November are better entry points based on long-term average returns.
Should I sell stocks before September?
Traders may reduce risk before September because it has historically been the weakest month. Long-term investors should be more careful, because taxes, transaction costs, and missing market rebounds can reduce returns. September weakness should be treated as a risk-management signal, not an automatic sell rule.
Are stocks usually higher in winter or summer?
Historically, the S&P 500 has produced stronger average returns in the winter period from October through January than in the late-summer period. September is the weakest month, while November, December, January, and October are among the strongest.
Does this research include dividends?
No. This analysis focuses on S&P 500 price returns and excludes dividends. Total returns, which include reinvested dividends, are higher over long periods, but price returns are useful for studying market seasonality and timing.

This is my first time to view your site.
Truly marvellous.
Hi Alex,
Yes, that is also a good strategy
Barry
Looking at the average values, isn’t it best to buy stocks at the END OF February and END OF September?
I mean, then they’re usually at their cheapest point, followed by the best growth, right?
I think it would be best to keep the certificates
Want to buy stock for each grandchild. How do I keep them from cashing in immediately after giving them the certificates?
It appears that q3 results influence the good buy in Oct & Nov and q4 & YOY for April buying, in other words q1& q2 have less influence on buying trends. q1 & q2 creates un certainty in moods as one is beginning of the year and another is just starts to give signs.
Yes, buying at the end of the falling period is a good idea.
If you are a buy and hold long time investor, would be be prudent to invest in the months when the stock market is falling, so as to have bigger gains for the future ?
Hi Steve, thanks for the question.
The numbers suggest that April is the best month on average for stock price increases. So perhaps the end of April.
thanks
Barry
As a newly retired couple we will have to sell some ETF S&P 500 shares each year to meet our spending needs. Does your data show a best time a year to sell to get the best price?
I will think about it for the next update.
Barry
Hi Rama,
I would highly recommend that you do not sell your flat to invest in the stock market with the hope of profiting and buying a bigger apartment. The stock market is volatile, you should only invest a portion of your available capital in stocks.
I have a small flat. If I sell and invest in stock market, will I be able to get the value for buying bigger flat. If possible or say yes, please give me the time period I have to wait to make a valuable consideration for a big flat which is normally avaialbel at 1. to 1.5 cr. At the same time being a greedy like, I do not want to
land in loss and be a bankrupt.
Awaiting your sincere advice at practical experience and exposure to the stock market.
My name is Ramachandran Chandrasekaran
This is useful and interesting data, but couldn’t you update the charts with 2010-2020 data?