Return on Capital Employed (ROCE) is a valuable financial metric that offers insights into a company’s profitability and efficiency in using its capital.
☆ Research You Can Trust ☆
My analysis, research, and testing stems from 25 years of trading experience and my Financial Technician Certification with the International Federation of Technical Analysts.
By allowing investors and analysts to measure the returns a company generates from its employed capital, ROCE serves as a magnifying glass over the business’s operational effectiveness.
This measure is crucial as it helps in comparing the profitability of companies across industries and sizes, considering the amount of capital involved in generating those profits.

ROCE is calculated by dividing a company’s earnings before interest and tax (EBIT) by its capital employed. This calculation gives stakeholders an overview of how efficiently a company uses its funds to generate earnings before the influence of financial structure, tax rates, and other external factors.
In essence, ROCE evaluates the core operational efficiency of a company, making it a significant indicator for evaluating investment decisions and benchmarking against peers.
Key Takeaways
- ROCE evaluates a company’s efficiency in generating profits from its capital.
- The metric is calculated using EBIT and capital employed, providing a focused measure of core operational efficiency.
- ROCE offers strategic insights for investors and can vary significantly across different industries.
Understanding ROCE
Return on Capital Employed, or ROCE, is a critical financial ratio for understanding how well a company generates profits from its available capital. It aids investors in gauging the efficiency and profitability of a company’s capital investments.
ROCE Defined
Return on Capital Employed (ROCE) is one of the most revealing profitability ratios, providing a snapshot of a company’s financial performance. This ratio reflects how effectively a company utilizes capital to generate earnings before interest and taxes (EBIT). ROCE is a useful metric for comparing profitability across companies and industries, regardless of size.
Formula for ROCE
To calculate ROCE, one can use the following formula:
ROCE = EBIT/ Capital Employed
Where:
- EBIT = Earnings Before Interest and Tax
- Capital Employed = Total Assets – Current Liabilities
In short, the ROCE formula divides a company’s operating earnings by its capital employed. A higher ROCE indicates that a company has generated more profits from its available resources and can indicate operational efficiency.

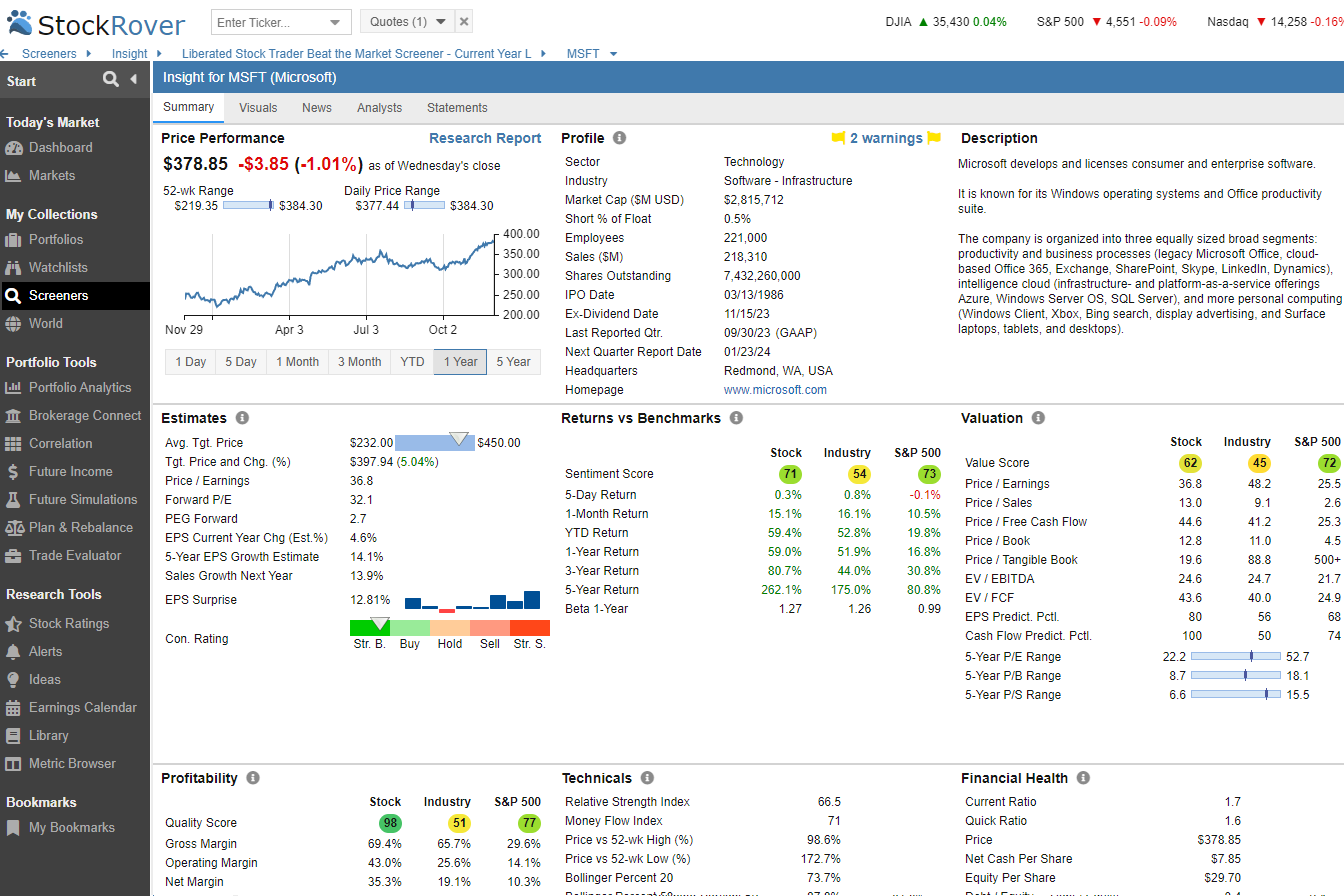
Try Powerful Financial Analysis & Research with Stock Rover
Interpreting ROCE Ratios
ROCE is generally expressed as a percentage or fraction. A higher ROCE signifies that a company is using its capital more efficiently and profitably to generate profits.
Investors should compare ROCEs across companies, industries, and sectors to get an accurate picture. Generally speaking, higher ROCEs are favorable, with lower ones being unfavorable.
However, ratios above 20% can be considered too high; this could indicate an overly aggressive approach, which may lead to financial distress in the future.
When interpreting ROCE values, higher percentages typically indicate more efficient use of capital. A company with a high ROCE implies that it is generating more profit per dollar of capital employed, signifying a potentially sound investment opportunity.
Conversely, a lower ROCE suggests less efficient use of capital, which may signal further analysis or cautious investment. It’s imperative to compare a company’s ROCE with its industry peers to ascertain relative performance, as different industries have varying benchmarks of what constitutes a “good” ROCE.
Using ROCE to Analyze Companies
Return on Capital Employed is useful for evaluating companies’ financial health and performance. By comparing this metric across different companies and industries, investors can assess the effectiveness of each entity’s operations. Also, by looking at historical trends in ROCE ratios, it is possible to gain further insights into how certain firms have used their capital over time. Additionally, one
EBIT stands for earnings before interest and taxes, representing a company’s operating profit. Capital Employed, on the other hand, refers to the total amount of capital that a company has used to generate profit. It is often calculated as total assets minus current liabilities or as fixed assets plus working capital.
Components of Capital Employed
Capital employed plays a pivotal role in examining a company’s financial efficiency. It comprises two key elements: total assets and current liabilities. These components serve as the basis for understanding capital utilization within a business.
Calculating Total Assets
Total assets represent the sum of a company’s current and non-current assets. These resources owned by the company are expected to yield economic benefits. Calculating total assets involves adding all tangible and intangible assets, including cash, inventory, property, plant, equipment, and intellectual property.
Example:
- Tangible Assets: Buildings, Machinery
- Intangible Assets: Patents, Trademarks
The total assets give a snapshot of the company’s revenue-generating resources.

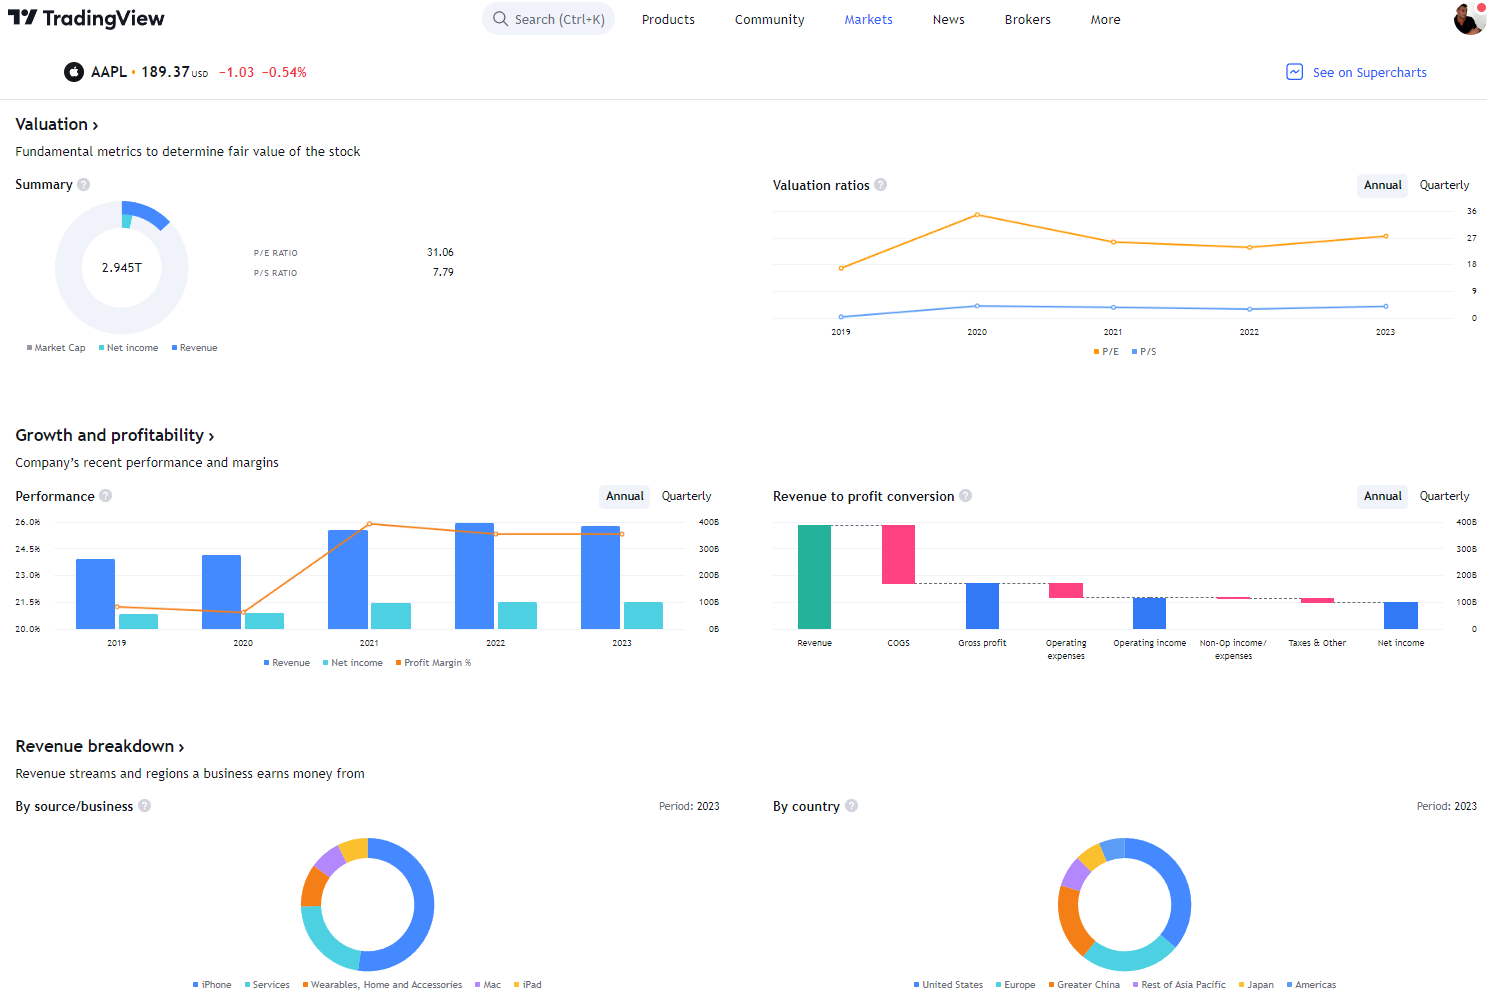
Global Financial Analysis for Free on TradingView
Understanding Current Liabilities
Current liabilities are the company’s debts or obligations due within one year. They are a crucial factor in assessing the capital employed as they provide insights into a business’s short-term financial health. Current liabilities include accounts payable, short-term loans, taxes payable, and other similar obligations.
Key points:
- Current Liabilities must be settled within one fiscal year.
- They significantly impact the working capital and cash flow.
Table: Typical Current Liabilities
| Liability | Description |
|---|---|
| Accounts Payable | Money owed to suppliers |
| Short-term Debt | Loans due within a year |
| Taxes Payable | Taxes owed to the government |
By subtracting current liabilities from total assets, one can derive the net capital employed, which offers a more accurate measure of the capital at work within the firm. This calculation assesses the return on capital employed, an indicator of the efficiency and profitability of a company’s capital investments.
ROCE Practical Example
| ROCE | Alpha Corp ($m) | Beta Inc ($m) |
|---|---|---|
| Sales | 500 | 700 |
| EBIT | 100 | 120 |
| Total Assets | 600 | 900 |
| Current Liabilities | 200 | 300 |
| Capital Employed | 400 (Total Assets – Current Liabilities) | 600 (Total Assets – Current Liabilities) |
Using the formula for ROCE ((EBIT/Capital employed) x 100), we can calculate:
| Financial Indicator | Alpha Corp | Beta Inc |
|---|---|---|
| ROCE | 25% (100/400 * 100) | 20% (120/600 * 100) |
Now, let’s break down what these figures mean:
In our example, Alpha Corp has a higher ROCE (25%) than Beta Inc (20%). This means that for every dollar Alpha Corp has invested, it generates 25 cents in profit, while Beta Inc generates only 20 cents.
Therefore, from an investor’s perspective, Alpha Corp appears to be using its capital more efficiently to generate profits compared to Beta Inc. However, this is just one indicator. Other factors such as market conditions, growth prospects, and risk profile should also be considered when making investment decisions.
Key Financial Metrics Compared
Financial analysts often compare various ratios when evaluating a company’s profitability and efficiency. Each metric provides a different angle on how effectively a company uses its resources to generate earnings.
Our original trading research is powered by TrendSpider. As a certified market analyst, I use its state-of-the-art AI automation to recognize and test chart patterns and indicators for reliability and profitability.
✔ AI-Powered Automated Chart Analysis: Turns data into tradable insights.
✔ Point-and-Click Backtesting: Tests any indicator, pattern, or strategy in seconds.
✔ Never Miss an Opportunity: Turn backtested strategies into auto-trading bots.
Don't guess if your trading strategy works; know it with TrendSpider.
ROCE vs. ROI
The Return on Capital Employed (ROCE) measures how much operating income is earned for each dollar of capital employed. It incorporates both equity and debt in its calculation. In contrast, the Return on Investment (ROI) measures the return generated from a specific investment relative to its cost. ROI is broader and can be applied to various investment types, not just to capital employed in business operations.
ROCE vs. ROE
Return on Equity (ROE) is concerned solely with the profitability relative to shareholders’ equity. Unlike ROCE, which considers all forms of capital employed, ROE focuses on the return generated by the company’s equity financing. It shows how effectively the firm uses shareholders’ funds to create profits.
ROCE vs. ROIC
Return on Invested Capital (ROIC) is similar to ROCE as both consider the efficiency of the capital allocation. However, ROIC is typically more narrow, as it measures the return on capital specifically invested in the company’s core operations, excluding any investment income or non-operating gains or losses. The formula for ROIC normally uses net operating profit after taxes (NOPAT) divided by the invested capital.
ROCE in Different Industries
The performance of the Return on Capital Employed (ROCE) metric can vary widely across different industries, often influenced by their respective capital requirements and operating models.
Capital-Intensive Industries
In capital-intensive industries, such as manufacturing, utilities, and telecom, high levels of investment in property, plant, and equipment are the norm. These sectors require significant capital outlay to produce goods or deliver services. Companies in these fields often have large asset bases, which means their ROCE is a critical measure of how efficiently they utilize these assets to generate profits. For example, a telecom company with extensive network infrastructure might report a different ROCE than a manufacturing firm with expensive machinery and equipment investments.
Service-Oriented Sectors
In contrast, service-oriented sectors, including consulting, software, or retail, tend to have lower capital requirements. These sectors rely more on human capital and less on physical assets. As a result, companies within these sectors typically exhibit higher ROCE figures, as they require less capital to generate earnings. Here, the efficacy of capital utilization is often more reflective of intellectual property and workforce efficiency rather than the cost or value of physical assets.
Strategic Insights and Investment Decisions
Return on Capital Employed (ROCE) is a pivotal financial ratio that serves as a beacon, guiding investors to make informed decisions. This metric evaluates the efficiency and profitability of their capital investment in a business.
Investment Strategies Using ROCE
Investors rely on ROCE to shape robust investment strategies, reflecting how well a company utilizes its capital to generate profits. A higher ROCE indicates that a company is making efficient use of its capital investment, which can be attractive for investors seeking profitable investment opportunities. Consequently, investment strategies often incorporate ROCE as a criterion for portfolio selection, emphasizing companies with a consistent track record of high ROCE figures. This methodical focus allows investors to target businesses likely to provide a greater return on their investments.
Evaluating Company Performance
Using ROCE also aids in comparing company performance within the same industry. By measuring the returns generated from the capital employed, investors gain a clearer view of a company’s operational efficiency and prowess in generating profits from its investments. The components of ROCE, such as Operating Profit and Capital Employed, factor into this evaluation, eliminating disparities that arise from differences in financial structure. This level of analysis provides a standardized valuation metric, and when ROCE trends upwards, it typically suggests improving operational efficiency and potential for increased valuation in the eyes of investors.
FAQ
This section addresses common queries regarding Return on Capital Employed (ROCE) and provides concise explanations to enhance understanding of this financial ratio.
How to determine if a ROCE percentage is poor or weak?
A ROCE percentage is generally considered poor or weak if it is lower than the industry average or the company's cost of capital. Lower percentages suggest a company is not using its capital as effectively as possible to generate profits.
What are possible explanations for a decline in ROCE?
A decline in ROCE could be attributed to increased capital without a proportional rise in profits, or it can indicate falling earnings due to operational inefficiencies or heightened competition affecting profit margins.
What is needed to calculate capital employed?
The components necessary to calculate capital employed typically include total assets minus current liabilities or equity plus long-term liabilities. These components represent the capital investment deemed necessary for a company to function.
How does ROCE provide insight into a company’s financial health?
ROCE provides insight into a company's financial health by measuring the efficiency with which the firm utilizes its capital to generate profits, revealing how well the management generates returns from its investments.
How is average capital employed factored into the ROCE equation?
The average capital employed is factored into the ROCE equation by calculating the mean value of the beginning and ending capital employed over a period, which is then used as the denominator in the ROCE formula.
Can ROCE be equated directly with capital employed?
ROCE cannot be equated directly with capital employed because ROCE is a ratio that measures the returns generated on the capital employed, not the capital itself. ROCE reflects the effectiveness of how well the capital is utilized rather than the amount of capital available.


