The best value investing stock screeners for Benjamin Graham & Warren Buffett portfolios are Stock Rover, Portfolio 123, TradingView, and TC2000.
Stock Rover is the best value investing stock screener overall because it has 650 screening metrics, including fair value and margin of safety, plus Graham and Greenblatt calculations.
Portfolio 123 has 240 financial criteria, TC2000 has 90 fundamentals, and TradingView can globally scan for 48 financial metrics.
4 Best Value Investing Stock Screeners
- Stock Rover: Best for value investors with fair value, margin of safety, plus Graham and Greenblatt ratios.
- Portfolio 123: An excellent value investing platform with over 240 financial screening criteria.
- TradingView: Best value screener for US and international investors.
- TC2000: Best financial charts for US & Canadian investors.
Value Investing Screeners Summary
Stock Rover is the best Ben Graham and Warren Buffett value stock screener, with fair value, margin of safety, dividend, and analyst Ratings. Portfolio 123 has 240 fundamental value criteria with inbuilt backtesting. TradingView is good for international investors needing robust fundamental and technical stock screens. Finally, TC2000 has the best fundamental charting and scanning for US & Canadian Investors.
Comparison Table
| Value Investing Screeners | Stock Rover | Portfolio123 | TradingView | TC2000 |
| 🎯 Rating |
4.9 | 4.4 | 4.2 | 4.1 |
| 📡 Screening Score |
★★★★★ | ★★★★✩ | ★★★★✩ | ★★★★✩ |
| 📰 Portfolio & Research |
★★★★★ | ★★★★✩ | ★★★★✩ | ★★★★✩ |
| 🔍 Backtesting |
★★★★✩ | ★★★★★ | ★★★★★ | ★★✩✩✩ |
| ⚡ Financial Metrics | 650 | 240 | 48 | 90 |
| 🏆 Fair Value | ✓ | ✘ | ✘ | ✘ |
| 🎯 Margin of Safety | ✓ | ✘ | ✘ | ✘ |
| ♲ Graham Number | ✓ | ✘ | ✘ | ✘ |
| 🆓 Free Plan | ✓ | ✘ | ✓ | ✓ |
| 🎮 Free Trial | 14-Day | ✘ | 30-Day | 30-Day |
| ✂ Discount | -25% | ✘ | -15% | -$25 |
| 🌎 Region | USA | USA | Global | USA |
Benjamin Graham, Howard Marks, Jack Bogle, Joel Greenblatt, and Warren Buffett have stood the test of time as genuinely talented value investors. They prove long-term value investing is safer and more successful than day trading stocks. They are millionaires and billionaires who have left a legacy, unlike any day traders.
1. Stock Rover: Winner Best Value Investing Stock Screener
Stock Rover is the best value stock screener because it has over 650 financial metrics, Buffett’s margin of safety and fair value calculations, the Graham number, and Joel Greenblatt’s magic formulas.
Stock Rover provides first-class fundamental data for Graham and Buffett value investors, wrapped up in a 10-year financial database. Additionally, the portfolio management and stock research tools are outstanding.
| Stock Rover Rating |
4.9/5.0 |
| ⚡ Financial Metrics | 650 |
| 📡 Screening Score |
★★★★★ |
| 📰 Portfolio & Research |
★★★★★ |
| 🔍 Backtesting |
★★★★✩ |
| 🏆 Fair Value | ✓ |
| 🎯 Margin of Safety | ✓ |
| ♲ Graham Number | ✓ |
| 🆓 Free | Yes |
| 🎮 Free Trial | 14-Day |
| ✂ Discount | -25% |
| 🌎 Region | USA |
Pros
★ Huge Selection of Fundamental & Financial Scanning Criteria
★ Incredible Stock Scoring Systems Allow You To Find Perfect Matches For Your Portfolio
★ Unique 10-Year Historical Fundamentals Data
★ Warren Buffett & Ben Graham Screeners & Portfolios Fully Integrated
★ The Best Usability & Setup
Cons
✘ No Social Community
It is awe-inspiring that Stock Rover has stormed into the review winners section of our Stock Market Software Review on its first try.
I actively use Stock Rover daily to find the undiscovered gems that form the foundations of my long-term investments.
| ⚡ Features |
Charts, News, Watchlists, Broker Integration |
| 🏆 Exceptional Features |
Screening, Portfolio, 10-Year Data |
| 🎯 Best for | Growth, Dividend & Value Investors |
The list of fundamentals you can scan and filter on is genuinely huge. Any idea based on fundamentals will be covered with over 600 data points and scoring systems. Watchlists have fundamentals broken into Analyst Estimates, Valuation, Dividends, Margin, Profitability, Overall Score, and Stock Rover Ratings. You can even set the watchlist and filters to refresh every minute if you wish.
Stock Rover includes a screener called the “Graham Enterprising Screener.” The Benjamin Graham Enterprising Screener focuses on intrinsic value based on a company’s earnings, dividends, assets, and financial strength. This screener uses the P/E ratio for the lowest 30% of the stock sector.
Stock Rover enables key criteria used by Benjamin Graham, such as the Price to Graham Number.
The price-to-Graham number ratio is a conservative valuation measure based on Benjamin Graham’s classic formula. The Graham Number is one of his tests for whether a company is undervalued and is computed as the square root of 22.5 times the tangible book value per share times the diluted continuing earnings per share. Any stock with a value of less than 1.0 is considered undervalued.
How to Beat the Stock Market With Stock Rover
I love Stock Rover so much that I spent 2 years creating a growth stock investing strategy that has outperformed the S&P 500 by 102% over the last eight years. I used Stock Rover's excellent backtesting, screening, and historical database to achieve this.
This Liberated Stock Trader Beat the Market Strategy (LST BTM) is built exclusively for Stock Rover Premium Plus subscribers.
Stock Rover allows you to calculate Intrinsic Value, a key Benjamin Graham and Warren Buffett criteria, in 5 different ways:
- Fair value is a discounted cash flow analysis to determine the Intrinsic Value
- Fair Value (Academic) uses a discounted cash flow analysis that forecasts cash flows into perpetuity.
- Intrinsic Value (Academic) is determined by adding the Net Present Value of Cashflows and the Terminal Value (Academic)
- Intrinsic Value EV to Sales is determined by comparing its EV / Sales ratio vs. industry norms.
- The Intrinsic Value Exit Multiple is determined by adding the Net Present Value of Cash Flows and the Terminal Value Exit Multiple.
Stock Rover has over 150 pre-built screeners, and the Premium Plus service unlocks the Warren Buffett and Benjamin Graham metrics.
[Related Article: 4 Easy Steps To Build Your Own Warren Buffett Screener With Stock Rover]
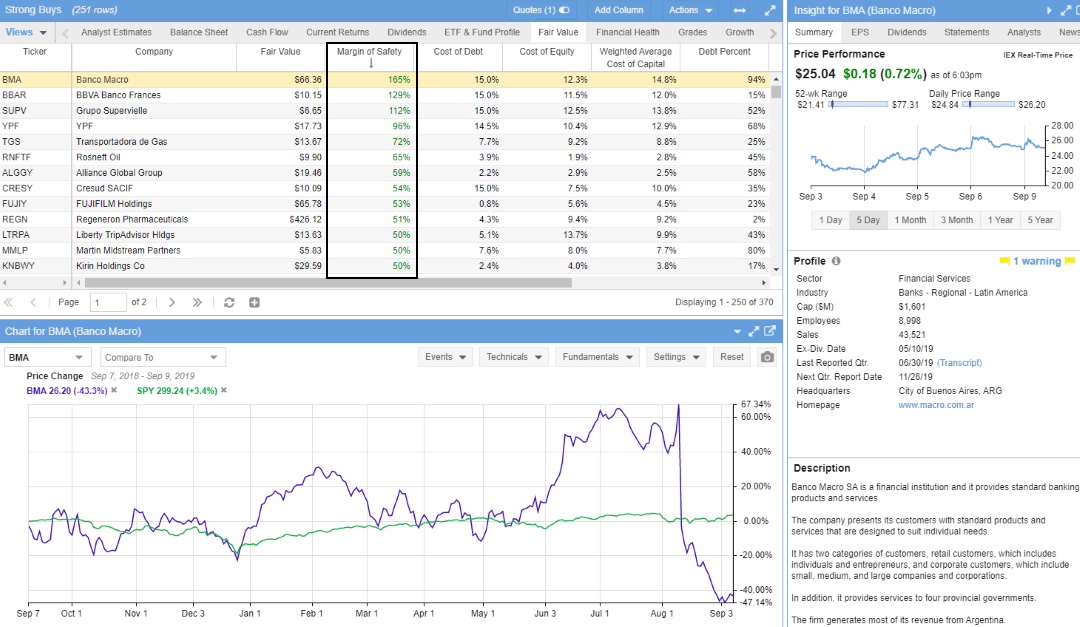
Stock Rover is an excellent Fair Value Screener. It allows you to calculate the intrinsic value automatically in five different ways. Add to this the three Fair Value calculations, and you will have everything you need to scan the market for deep-value stocks. Finally, Stock Rover includes the Price to Lynch Fair Value Calculation based on the famed investor’s valuation formula.
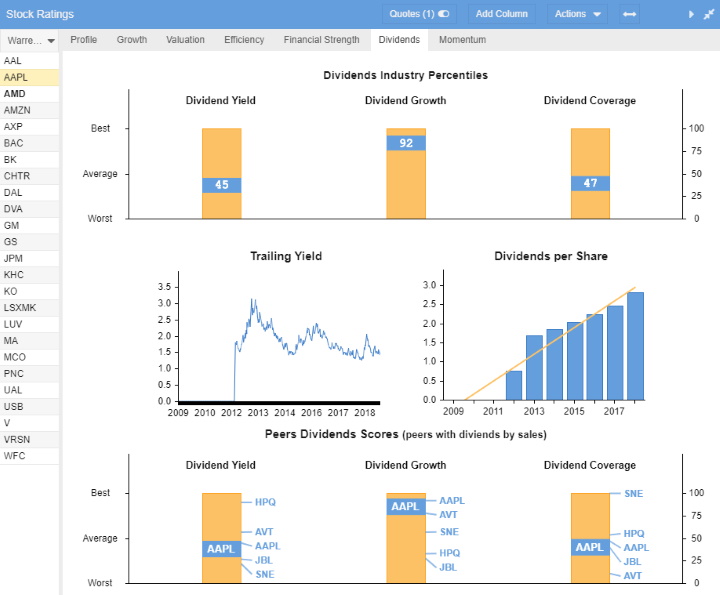
Another reason why I like Stock Rover so much is the detailed dividend and income analysis provided. As all smart value investors know, you need to accrue your dividends to have a chance at excellent market-beating returns. Stock Rover provides intelligent analysis to enable you to do just that.
The team at Stock Rover has implemented some great functionality; I particularly like the roll-up view for all the scores and ratings. I have imported the Warren Buffett portfolio, including his top 25 holdings. I have also selected the “Stock Rover Ratings” tab. This tab rolls all analyses into a simple-to-view ranking system, saving time and effort while providing a wealth of insight.

With Stock Rover, you get broker integration with practically every major broker, including our review-winning brokers, Firstrade, and Interactive Brokers. Stock Rover will take care of profit and loss reporting on your portfolio and provide portfolio rebalancing recommendations. It is a unique package that includes income (dividend) reporting and scoring.
Stock Rover is not for day traders but for longer-term investors who want to maximize their portfolio income and take advantage of compounding and margin of safety to manage a safe and secure portfolio.
You can have Stock Rover for free; however, the Premium Plus service unleashes its real power. Moreover, their top service tier is not even expensive compared to the competition.
Stock Rover pricing starts at $0 for the Free plan, Essentials costs $7.99, Premium costs $17.99, and Premium Plus costs $27.99 monthly. Opting for a yearly subscription reduces the costs by 16%, and a 2-year subscription reduces the price by 26%, representing a significant saving.
For full-value investing stock screening, you need the Premium Plus Service (Recommended)—$27.99 US/mo—which includes ten years of historical screening, an unlimited margin of safety and fair value scoring, limitless stock warnings, and stock ratings + analyst ratings scoring.
Stock Rover wins our value stock screener review by providing the best software for value and income investors. A 10-year financials & fundamentals historical library plus incredible scanners, including Warren Buffett & Ben Graham’s favorite criteria. Fair Value, Margin of Safety, and so much more.
If you are a long-term investor, this is the software for you.
2. Portfolio 123: Best Value Investing Screener & Backtesting
Portfolio 123 has 240 financial metrics and ratios for value investors and includes powerful backtesting capabilities so that you can test your investing methodology.
| Portfolio 123 Rating |
4.4/5.0 |
| ⚡ Financial Metrics | 240 |
| 📡 Screening Score |
★★★★✩ |
| 📰 Portfolio & Research |
★★★★✩ |
| 🔍 Backtesting |
★★★★★ |
| 🏆 Fair Value | ✘ |
| 🎯 Margin of Safety | ✘ |
| ♲ Graham Number | ✘ |
| 🆓 Free | ✘ |
| 🎮 Free Trial | 21 Days $9 |
| ✂ Discount | ✘ |
| 🌎 Region | USA |
Pros
- 470+ Screening Metrics
- 10-Year Backtesting Engine
- Unique 10-Year Historical Data
- Pre-built Model Screeners
- 260 Financial Ratios
- Integrated $0 Trading
Cons
- No Integrated News
- No App for Android or iPhone
- Initially, Complex To Use
- Missing Fair Value & Margin of Safety Metrics
- Technical Analysis Charting Needs Improving
Portfolio123 Key Features
| ⚡ Features |
Screening, Research, Charts |
| 🏆 Exceptional Features |
Trading, Backtesting |
| 🎯 Best for | Experienced Investors |
The Portfolio123 screener allows you to filter 10,000+ stocks and 44,000 ETFs to help you find the investments or trades that match your exact criteria. Portfolio123 also has ranked screening, which enables you to rank the stocks that best match your criteria, filtering a list from hundreds of stocks to a handful. You can also define your custom universes, setting the macro criteria for which stocks are included in the sample.
Over 225 data points will cover most of your fundamental ideas. Portfolio123 has 460 criteria, including analyst revisions, estimates, and technical data.
You can also use Portfolio123 to screen stocks on their performance relative to the S&P500 or any other benchmark. You could develop a strategy to select stocks based on their historical performance versus the market.
The number of factors available for screening is impressive. You can screen based on reliable information from a company’s financial reports, access technical factors, create your factors using period and announcement dates, eliminate stocks with high bid-ask spreads, limit your screen to stocks in a certain industry or sector, rank factors against other stocks in an industry or sector, and change your factor balance depending on economic conditions.
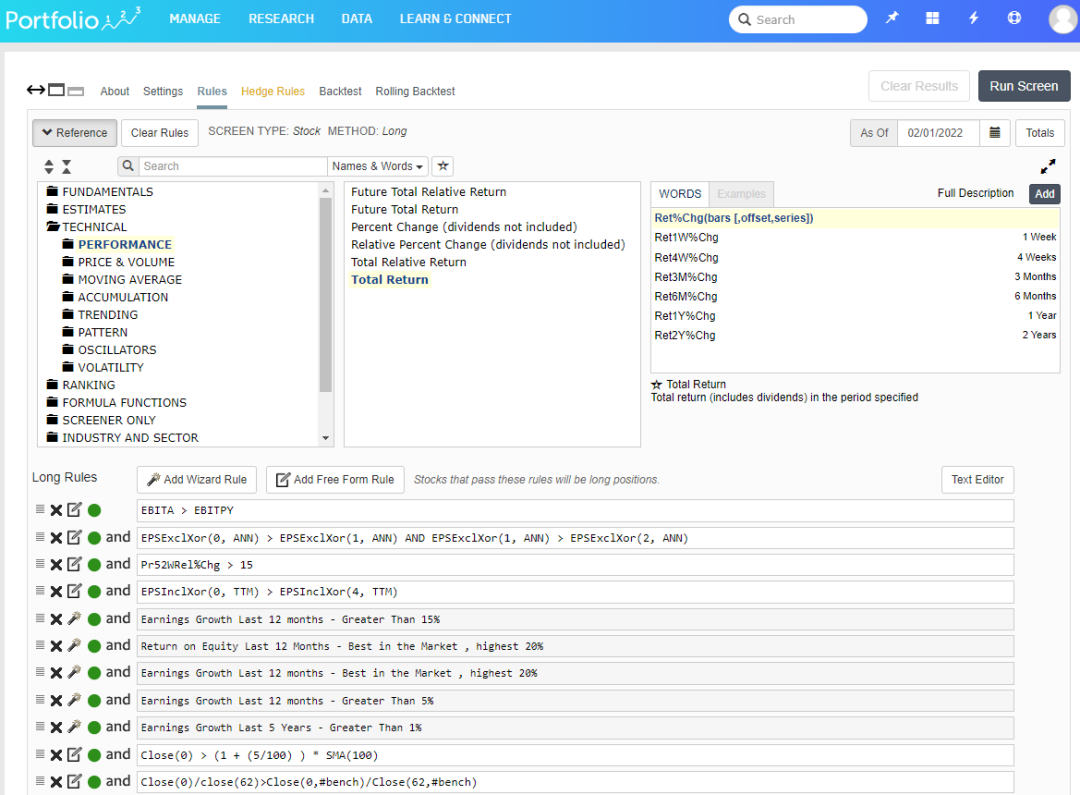
Here is a very complex screening strategy I developed using Portfolio123; as you can see, it is extremely powerful and flexible, with almost limitless rules and conditions.
3. TradingView: Best Free Value Stock Screener
TradingView provides 48 financial metrics for value investors to scan the global stock markets. Criteria include ROA, Quick Ratio, Price to Book, PE Ratio, and Price to Free Cash Flow.
| TradingView Rating |
4.2/5.0 |
| ⚡ Financial Metrics | 48 |
| 📡 Screening Score |
★★★★✩ |
| 📰 Portfolio & Research |
★★★★✩ |
| 🔍 Backtesting |
★★★★★ |
| 🏆 Fair Value | ✘ |
| 🎯 Margin of Safety | ✘ |
| ♲ Graham Number | ✘ |
| 🔍 Backtesting | ✓ |
| 🆓 Free | Yes |
| 🎮 Free Trial | 30-Day |
| ✂ Discount | -15% |
| 🌎 Region | Global |
Pros
★ 48 Fundamental & Financial Scanning Criteria
★ Best Screener for Global Stock Markets
★ Ability to Screen Stocks, Forex, Crypto & Commodities
★ Great Usability & Setup
Cons
✘ No Deep Historical Data
✘ No Fair Value & Margin of Safety
TradingView Key Features
| ⚡ Features |
Charts, News, Watchlists, Screening |
| 🏆 Unique Features |
Trading, Backtesting, Community |
| 🎯 Best for | Stock, Fx & Crypto Traders |
| ♲ Subscription | Monthly, Yearly |
| 💰 Price | Free | $13/m to $49/m annually |
TradingView has a very slick system, and they have put considerable thought into how fundamentals integrate into the analytics system.
Testing the TradingView stock screener shows it excels at screening for technical indicators. It provides real-time scanning and filtering on 172 metrics, including 48 financial filters. TradingViews stock screener also includes a useful scan for technical buy and sell ratings.
Thanks to a connection to the Federal Reserve database, TradingView has vast amounts of economic data, such as Federal Funds Rates and World Economic Growth.
TradingView’s screening watchlists have fundamental data separated into Performance, Valuation, Dividends, Margin, Income Statement, and Balance Sheet. TradingView stands out with its charting of economic indicators, for example, comparing the civilian unemployment rate versus the growth in company profits.
You can set the screening watchlist and filters to refresh every minute.
The TradingView stock screener comes complete with 160 fundamental and technical screening criteria. All the usual criteria are there, such as EPS, Quick Ratio, Pre-Tax Margin, and PE Ratio. However, it also goes into more depth with more esoteric criteria, such as the number of employees, goodwill, and enterprise value.
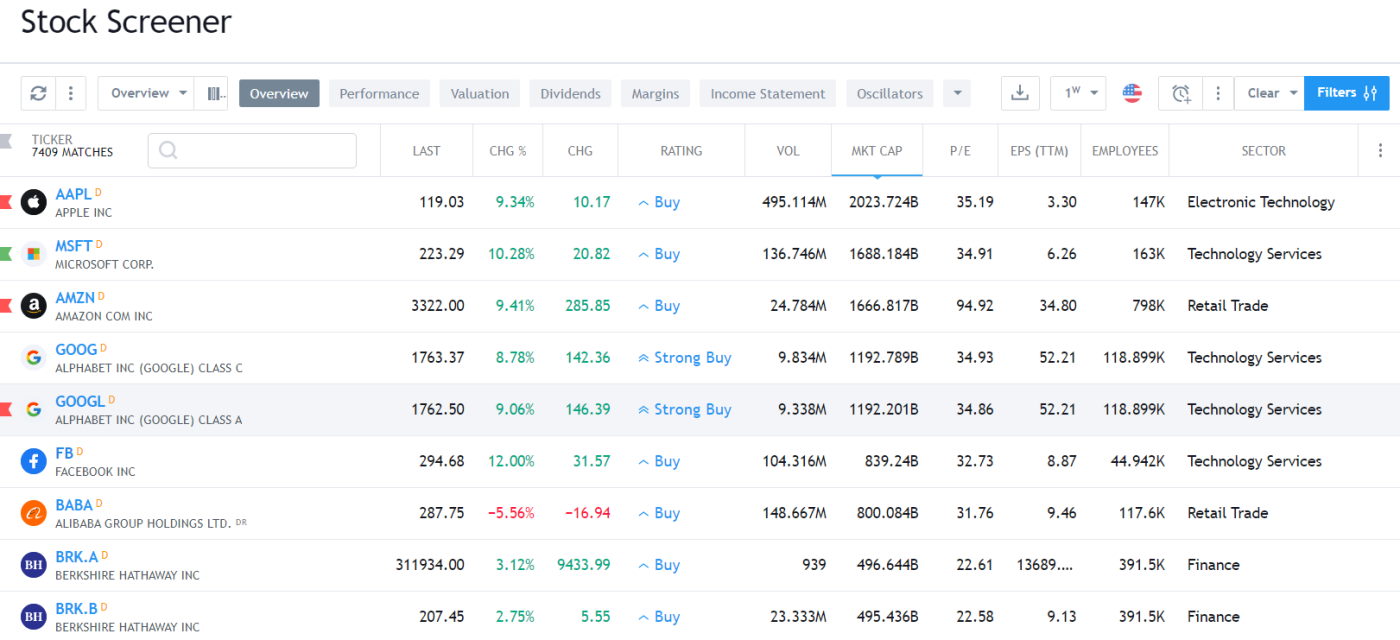
Another great thing about the screener implementation is that it is very customizable; you can configure the columns and filters exactly how you like them. As you can see above, I have changed the overview screen to include the number of employees, P/E, and EPS TTM.
TradingView stands out because of the vast selection of economic indicators you can map and compare on a chart. For example, you can compare the Civilian Unemployment Rate versus the growth in Company Profits for the USA. This is incredibly powerful.
You can use TradingView right now with no login, installation, or cost. However, the Pro Version of TradingView unlocks even more power and abilities. Starting at $9.95, this is very inexpensive.
We recommend TradingView for any international traders as the market coverage is enormous, and if you want a very active trading community, this is the place to go.
The TradingView stock screener comes complete with 150 fundamental and technical screening criteria; all the usual criteria are EPS, quick ratio, pre-tax margin, and PE ratio (forwards and trailing twelve months). However, it also goes deeper with more esoteric criteria such as the number of employees, goodwill, and enterprise value.
Another great thing about the screener implementation is that it is very customizable; you can configure the column and filter exactly how you like it. As you can see above, I have changed the overview screen to include the number of employees, P/E, and EPS TTM.
Extremely easy to use, low cost, and packed with Stock Screener Power, including economic data, it is the right combination for active international day traders who value a social community.
4. TC2000: Market Scanning for Value Investors
TC2000 offers 90 financial screening criteria for traders trading short-term value plays. Insider ownership, open interest, float, assets, margins, and dividend criteria are all covered.
| TC2000 Rating |
4.1/5.0 |
| ⚡ Financial Metrics | 90 |
| 📡 Screening Score |
★★★★✩ |
| 📰 Portfolio & Research |
★★★★✩ |
| 🔍 Backtesting |
★★✩✩✩ |
| 🏆 Fair Value | ✘ |
| 🎯 Margin of Safety | ✘ |
| ♲ Graham Number | ✘ |
| 🆓 Free | Yes |
| 🎮 Free Trial | 30-Day |
| ✂ Discount | -25% |
| 🌎 Region | USA |
Pros
★ 90 Fundamental Screening Criteria
★ Can Create Custom Indicators
★ Ability to Trade from Charts with TC2000 Brokerage Account
Cons
✘ No News Service
✘ No Margin of Safety or Fair Value
✘ No Social Trading
| ⚡ Features |
Charts, Custom Indicators, Screening |
| 🏆 Unique Features |
TC2000 Brokerage, EasyScan |
| 🎯 Best for | Stock & Options Traders |
Make no mistake; if you want fundamentals screened in real-time layered with technical screens integrated into live watch lists connected to your charts, Telechart is a power player.
In 2000, I selected TC2000 as my tool of choice because it offered the best implementation of fundamental scanning, filtering, and sorting available on the market. Seventeen years later, they are still a leader in this section.
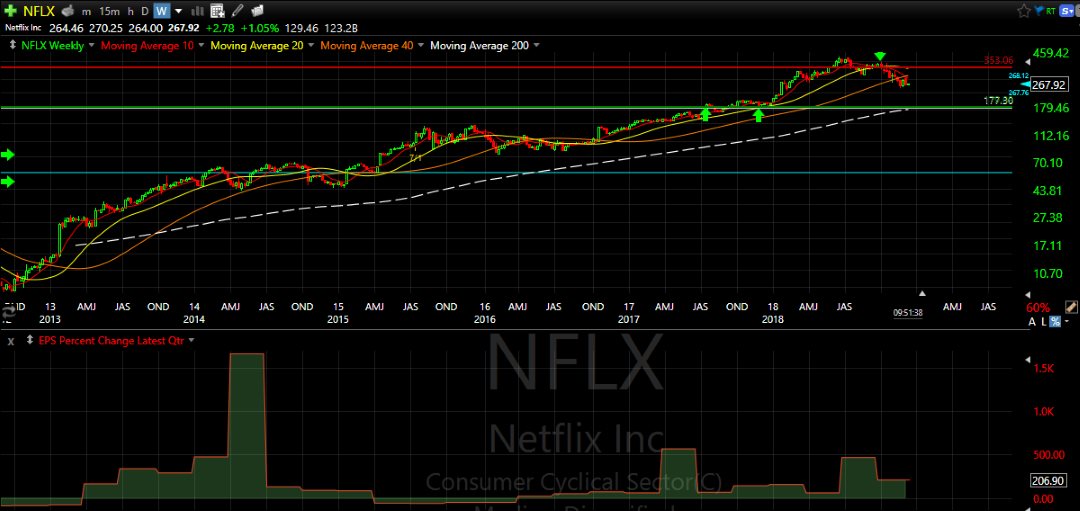
They offer a good selection of fundamentals to choose from, but what makes it unique is the fact you can, with a few clicks, create your indicators based on the fundamentals. You can then overlay the indicators directly on the charts, which opens up a whole new world of technical and fundamental analysis.
Using TC2000, you can quickly scan for and sort stocks based on dividend yield. Here, I built a real-time screener sorted by dividend yield for companies valued at over $1 billion in enterprise value and with a book value per share close to or higher than the stock price. As you can imagine, this is valuable information.

TC2000 does an outstanding job of enabling you to plot fundamentals like the P/E Ratio and EPS on the stock chart, which can be valuable to investors.
The only downside is that it is only available for those who trade the US and Canadian Stock Markets.
Summary
Stock Rover is the best stock screener overall for growth and value investors with fair value, margin of safety, dividend, and analyst ratings. TradingView is best for international investors, with a global screener for US and international investors, including excellent fundamental and technical stock screens. Finally, TC2000 has good fundamental charting and scanning for US and Canadian investors.

Thank you for this comparison