The Rate of Change (ROC) is a momentum indicator that measures the speed and direction of asset price movements. It helps traders determine whether a security is trending and how quickly its price changes.
Backtesting the price rate of change indicator on 30 Dow Jones Industrial Average stocks over 20 years on daily charts resulted in an impressive average 66% win rate, outperforming a buy-and-hold strategy.
In my 40-day, 5-minute day trading test, pairing ROC with a Heikin Ashi chart outperformed the market 93% of the time, compared to 43% with classic candles, while increasing the win rate (55% vs. 45%) and reward-to-risk ratio (2.7 vs. 1.84).
The ROC indicator is a good choice for traders. Learn how to test and trade it yourself.
Key Takeaways
- The rate of change is an oscillating momentum indicator.
- The Rate of Change (ROC) measures the speed and direction of change.
- ROC is a high-performing chart indicator with a 66% success rate.
- ROC performs best on 5-minute Heikin-Ashi charts, outperforming the market 93% of the time.
Many chart indicators are not profitable, but ROC is. Learn everything you need to know about trading the price rate of change indicator.
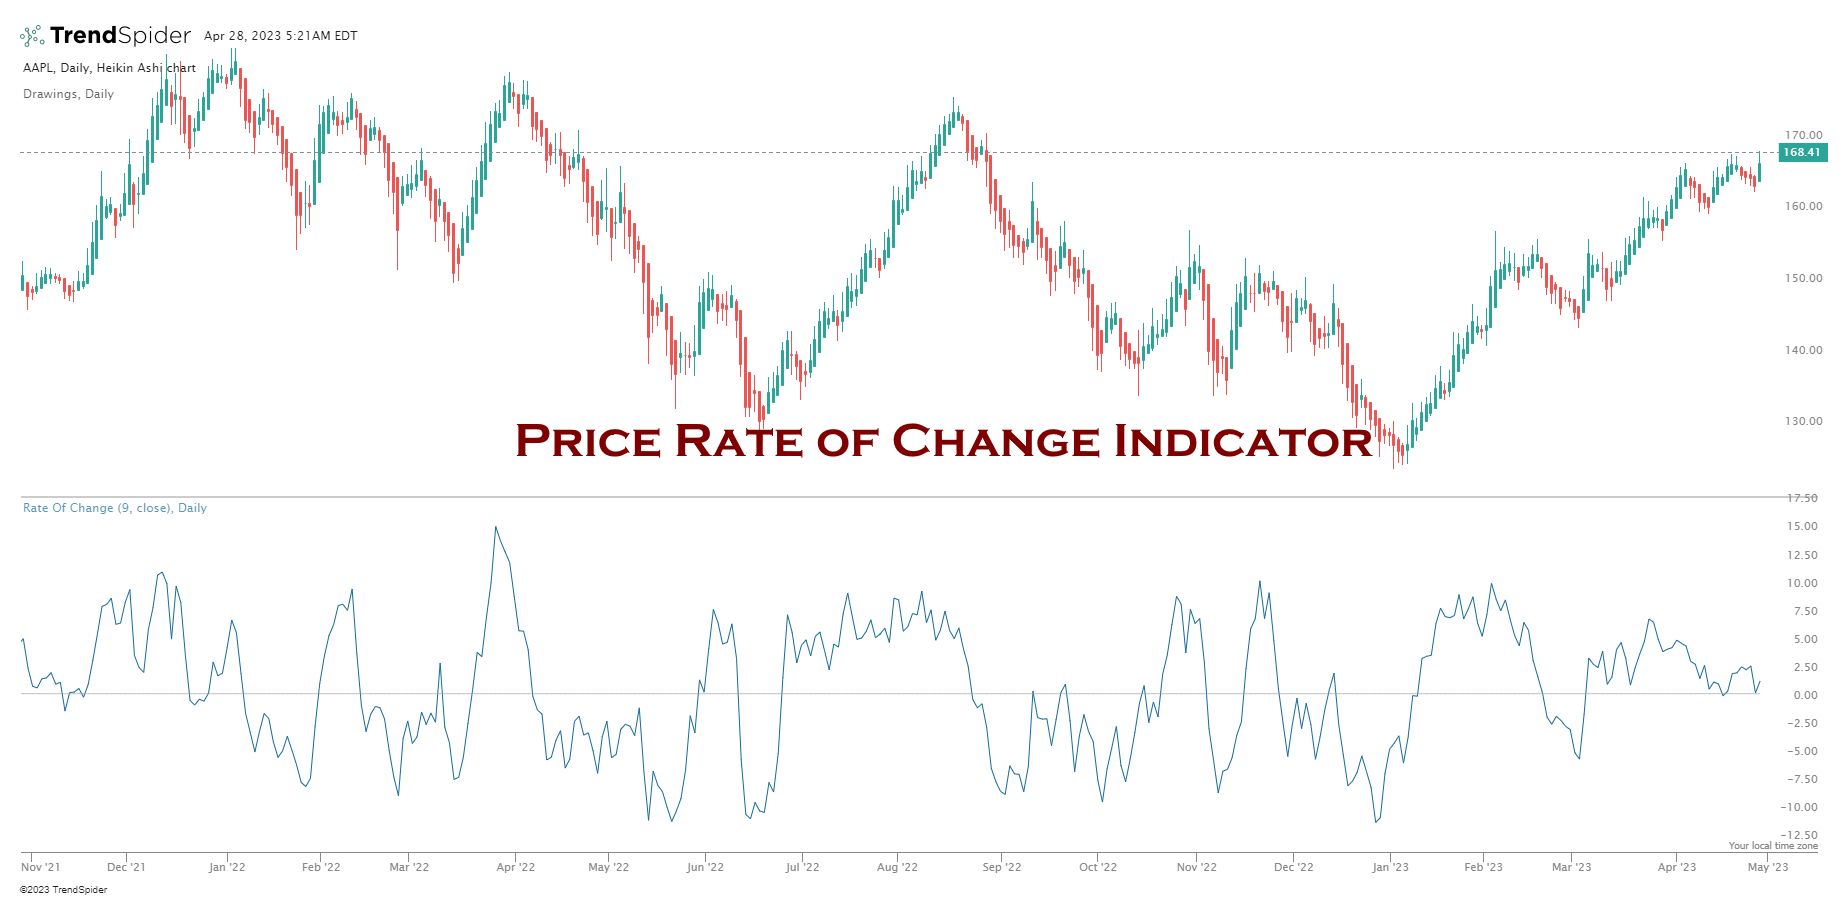
What Is Price Rate of Change?
The Rate of Change chart indicator (ROC) is a technical analysis tool used to measure the speed and direction of price movements. As its name implies, it measures the rate at which the security’s price changes over time. Specifically, it compares current prices with those in the recent past. This comparison lets traders determine whether a security is trending, either up or down, and how quickly its price changes.
How to Use the Rate of Change Indicator
Using the ROC indicator, traders can identify potential buying and selling opportunities and areas of potential risk. It can also confirm price pattern trends and breakouts.
The ROC line will move up or down depending on the rate at which the security’s price changes, with higher values indicating a faster rate of change and asset price growth. This can help traders identify when a trend is forming or gaining momentum and whether it may be time to enter or exit a trade.
ROC is an Oscillating Indicator
The Rate of Change (ROC) is classified as an oscillating indicator, meaning its values fluctuate around the zero line. This indicator is unbounded, meaning there is no upper or lower limit, but generally, it is between -100 and +100.
By interpreting these levels, traders can gain insight into whether the asset is in an uptrend or a downtrend. In general, values below 0 indicate that the security is in a downtrend, and values above 0 indicate that it is in an uptrend.
TrendSpider 4.8/5⭐: My Pick for AI-Power & Auto-Trading
I’ve used TrendSpider for 7 years for my research and testing. It auto-detects trendlines, patterns, and candlesticks, backtests ideas, and lets you use AI to create unique strategies and launch trading bots—with no code.

Save 38% to 45% on TrendSpider
Our Top Rated 4.72 ⭐ Trading Tool
✅ Leader in AI Trading & Chart Pattern Recognition
✅ Scanning & Auto-Trading
Deal Ends In:
Ultimate Rate of Change Trading Advice
My 40-day, 5-minute benchmark shows a clear edge when the Rate of Change (ROC) is applied to Heikin Ashi rather than traditional candlesticks. The Heikin Ashi version outperformed the market in 93% of days (vs 43%), improved the win rate to 55% (vs 45%), and boosted the reward/risk ratio to 2.7 (vs 1.84). Despite generating fewer trades (114 vs 152), it produced a far higher expectancy of +1.04R per trade compared to +0.28R, indicating bigger average winners and better noise filtering.
Practically, this means traders can pursue a higher-quality signal set with ROC by switching the chart type to Heikin Ashi—fewer whipsaws, better payoffs, and more consistent market beating. While execution costs and slippage always matter, the 3.7× expectancy uplift suggests this edge has room to absorb friction and still outperform; further testing across markets and periods can validate durability.
Understanding Rate of Change
The price rate of change (ROC) is a technical analysis indicator used to gauge momentum. Momentum indicates the rate of change or acceleration of price movements for an asset. An increase in momentum suggests that the trend is becoming stronger and more likely to continue, while a decrease in momentum suggests that the trend may be weakening and could soon reverse. By monitoring this indicator, traders can gain insight into the speed of change.
Pros:
- ROC helps you determine if a stock is on an uptrend or a downtrend, making it easier to decide when and at what price to buy or sell shares.
- ROC has a good performance track record in backtesting.
- It can help you identify potential buying or selling opportunities in the market.
- ROC can be used to evaluate an index, sector, or industry.
Cons:
- The rate of change helps traders to be profitable for 60% of stocks traded, but that means it underperforms at 40%.
- No indicator is 100% accurate, and ROC is no exception.
- Not suitable for trading stable assets with low price volatility.
Additionally, by measuring the rate of change in a security’s price, traders can better gauge the strength of a trend. This can be particularly beneficial for those who want to identify when momentum is increasing and decide whether or not to take advantage of it.
Finally, ROCs may also enable traders to spot reversals in trends before other indicators catch them, giving them an edge over the competition.
How to use ROC in Trading?
The Rate of Change indicator is calculated by taking the current price and subtracting the value of a given period (usually 14 days). This value can then be divided by the same period’s value to measure the percentage change.
A positive ROC indicates that prices are increasing, while a negative one suggests that prices are declining.
Traders can use the ROC to identify areas of support and resistance. When the indicator is above zero, it suggests that prices are increasing and provides a level of support. Conversely, when the indicator is below zero, it suggests that prices are decreasing and provides a level of resistance. Additionally, traders may look for divergence between the ROC and price action to identify potential reversals.
Is the Price Rate of Change Indicator Accurate?
Yes, according to my testing, the price rate of change is a top-performing indicator, with 20-year results proving a reward/risk ratio of 2.5 and outperforming a buy-and-hold strategy on 66% of stocks.
Using ROC as Trend Confirmation
A positive ROC validates a bullish trend, whereas a negative ROC signifies a bearish one. When the price consolidates, the ROC will fluctuate around zero. This zero point is important because it tells you the price is consolidating, and other indicators will not function well. If you build this into your trading strategy, it will improve the effectiveness of other indicators.
Combining Rate of Change with Moving Averages
The price rate of change is incredibly useful in combination with other chart indicators, such as moving averages. For example, most indicators perform well when a stock is trending up or down. However, when the price consolidates, these indicators provide many false buy and sell signals, causing small trading losses. If you observe ROC hovering around zero, you can hold off trading other indicator signals because they are likely false.
Can the Rate of Change be used for Buy and Sell Signals?
My research backtesting shows that the price rate of change is an excellent indicator for identifying buy and sell signals independently of other indicators. Over 20 years, ROC significantly outperformed a buy-and-hold strategy on 66% of the Dow Jones Industrial Index stocks.
Using ROC to Detect Price Divergences
Traders can also use ROC to signal price divergences. For example, if prices are making higher highs, but the ROC is making lower highs, it could suggest that price momentum is weakening, and a reversal may be imminent. Similarly, if prices are making lower lows, but the ROC is making higher lows, it suggests that prices could soon reverse and start to increase.
By recognizing these divergences, traders can use the ROC indicator to make more accurate trading decisions.
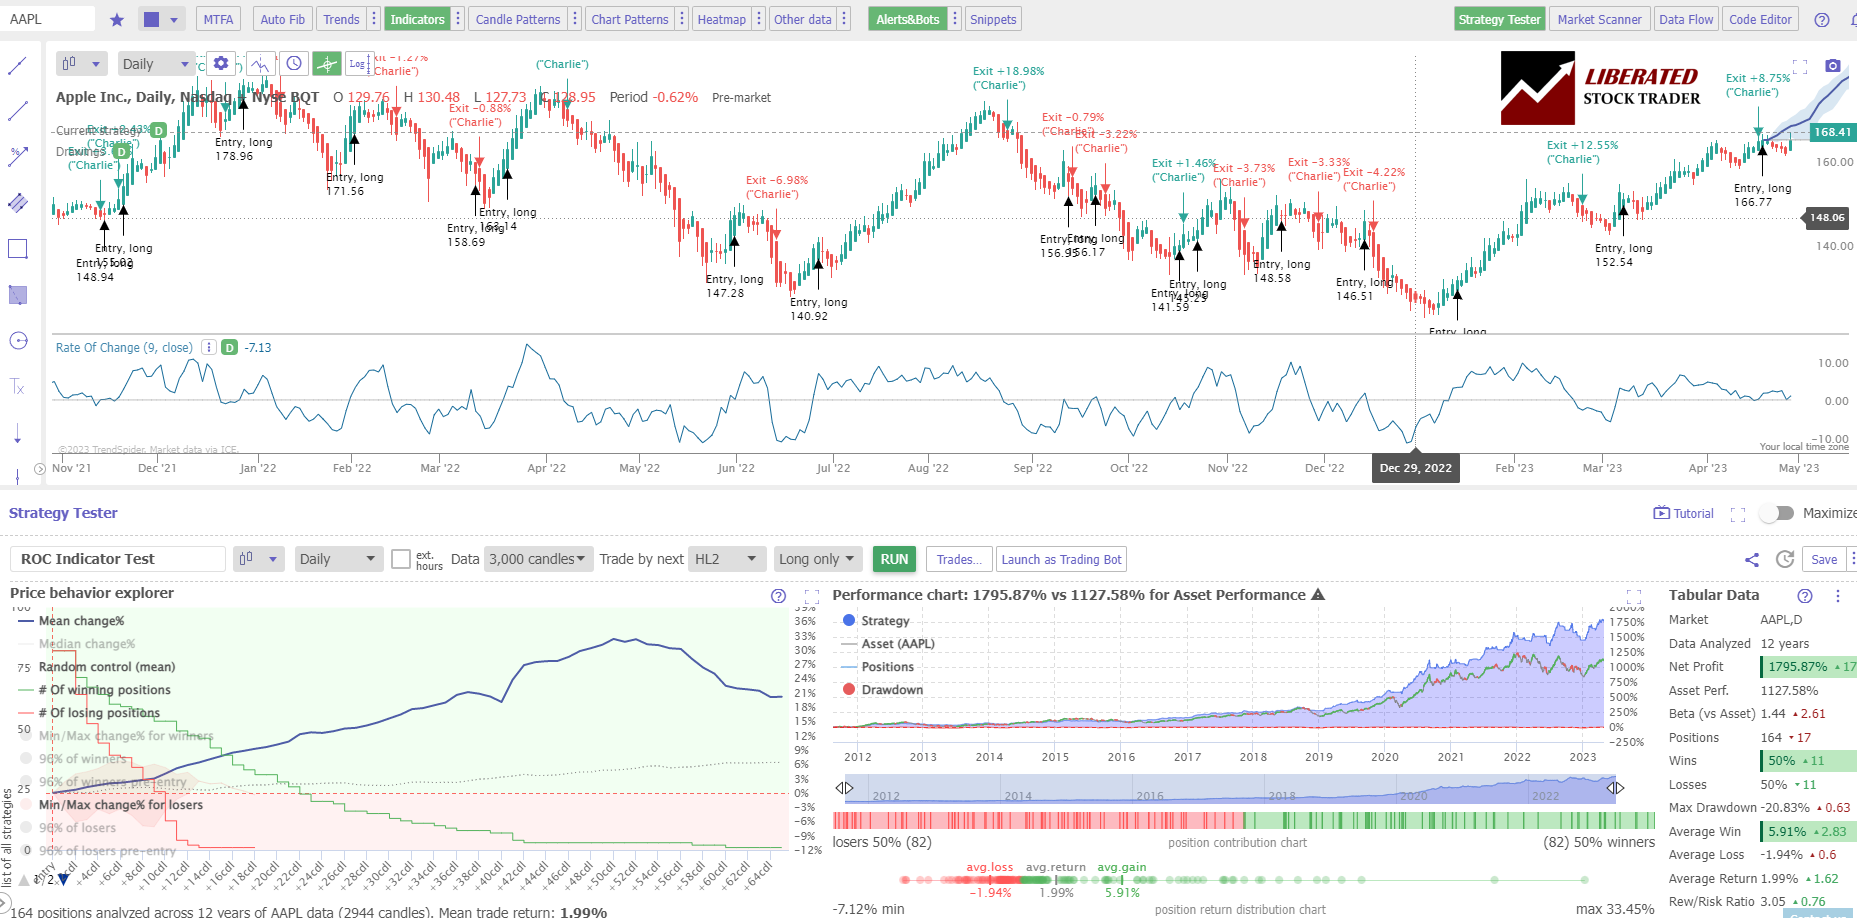
Rate of Change Indicator Backtesting
To backtest the rate of change (ROC) indicator, I used TrendSpider, the leading AI stock trading software with pattern recognition and a codeless backtesting engine. Testing was configured with a Heikin Ashi daily chart, and the exit criteria were set to the next trading day HL2 (Price High + Low /2)
| Testing Criteria | Setting |
| Index: | DJIA |
| Date Range | 12 Years/3000 Candles |
| ROC Settings: | 9 |
| Entry Criteria: | ROC > 0 |
| Exit Criteria: | ROC < 0 |
| Sell: Next Open | (Price High + Low /2) |
Performance Results Chart
Here, you can see the entire performance results for Apple Inc., the best-performing stock in the Dow Jones Industrial Average index. Each buy and sell signal is plotted, and the detailed performance ratios are shown on the bottom right of the chart.
I tried many solutions, but this testing was only possible using TrendSpider.
Testing Performed With TrendSpider – The Best Software for Traders
ROC Indicator Backtesting Results
Overall, the rate of change indicator was a good performer, outperforming 60% of the Dow Jones 30 Index by significant margins over the last 12 years. Over a 20-year backtest, ROC beat buy and hold on 66% of the stocks.
The table below shows the best and worst-performing stocks in terms of the risk-reward ratio.
| 12 Year Backtest Results | Best Performer | Worst Performer |
| Ticker: | AAPL | UNH |
| Reward/Risk Ratio: | 3.05 | 1.93 |
| Buy & Hold Performance: | 1127% | 974% |
| ROC Performance: | 1795% | 282% |
| # Trades: | 164 | 181 |
| Average Win: | 5.91% | 3.36% |
| Average Loss: | -1.94% | 1.74% |
The most interesting ROC trade was in IBM. Over 12 years, the buy-and-hold trade yielded a net loss of 22.53%, yet using this ROC system, it made a profit of 76%.
Backtesting for Day Trading
Configured for a day trading strategy using the Rate of Change setting nine on a Heikin Ashi chart produced an incredible 93% win rate, outperforming a buy-and-hold strategy. Over 40 days, there were 130 trades and a reward/risk ratio of 2.1/1, with 55% of trades being winners.
| ROC | Candlestick | Heikin Ashi |
| Timeframe | 5-min | 5-min |
| Duration | 40 Days | 40 Days |
| % Beating Mkt | 43% | 93% |
| Avg # Trades | 152 | 114 |
| Reward/Risk Ratio | 1.84 | 2.7 |
| % Winners | 45% | 55% |
The results prove that using a Heikin Ashi chart, which smoothes previous bars, is a significant advantage in trading. Using a standard OHLC or candlestick chart created many losing trades due to volatility, but the Heikin Ashi chart enhanced the rate of change indicator to make it highly profitable.
Heikin Ashi + ROC clearly outperforms classic candlesticks on every key metric.
- Outperformance vs. market: 93% (Heikin Ashi) vs 43% (candlestick) — a +50 pp jump, indicating far more consistent edge.
- Win rate: 55% vs. 45% — +10 pp, suggesting Heikin Ashi reduces whipsaws.
- Reward/Risk: 2.7 vs. 1.84 — ~47% higher payoff when right.
- Trade frequency: 114 vs 152 trades — ~2.9/day vs ~3.8/day. Fewer, cleaner signals with Heikin Ashi.
- 3.7× higher expectancy with Heikin Ashi.
Bottom line: On this sample, the ROC strategy performs far better using Heikin Ashi candles—more wins, bigger winners, fewer trades, and much higher consistency vs. the market.
*Assumes average loser ≈ 1R. Real-world results will vary with costs/slippage; the higher expectancy suggests the edge is more likely to survive them.
How to Calculate the ROC Indicator?
It’s easy to calculate the Rate of Change (ROC) indicator. All you need is the closing price of a stock for two different periods. Let’s assume we want to compare the last 20 days and the previous ten days, so we get:
ROC = [(Last Price – Previous Price) / Previous Price] x 100
The formula multiplies the result by 100 to convert the decimal number into a percentage.
For example, the stock closed at $100 on the 10th day, and today it is trading at $110. Using the formula above, we get the following:
ROC = [(110 – 100) / 100] x 100 = 10%
This means that the stock has gained 10% in just ten days. The formula also works for losses, so if the stock had gone down to $90 in that period, we would have:
ROC = [(90 – 100) / 100] x 100 = -10%
In this case, it means that in just ten days, the stock has lost 10%. In my example above with a profit, the ROC shows us that the stock has gained 10% in the last ten days, but we don’t know if this is better or worse than its performance over a longer period. To compare its performance over the last 20 days rather than just the previous 10, we can use the same formula:
ROC = [(Last Price – Price 20 Days Ago) / Price 20 Days Ago] x 100
This gives us a more accurate picture of how the stock’s performance has changed over the last 20 days.
Summary
The Rate of Change (ROC) is a good pattern for traders, with proven accuracy and success rates. Traders should always perform backtesting and strategy analysis before trading any asset. The best software for detailed trading strategy development and technical analysis is TrendSpider. Read the TrendSpider review.
FAQ
What is the best software for backtesting chart indicators?
Our detailed testing of chart indicators has been performed with TrendSpider, which is the best trading software for backtesting and strategy development.
How do you calculate the price rate of change?
The price rate of change is calculated by subtracting the current closing price from the closing price 20 days ago and then dividing that figure by the closing price 20 days ago. The result is multiplied by 100 to get a percentage value. This can also be used to calculate the rate of change over any period of time.
What does ROC stand for?
ROC stands for Rate of Change. It measures how quickly the price is moving in relation to time and can be used to gauge whether an asset is in a bullish or bearish trend. By comparing the ROC of different assets, traders can identify strong trends that might provide good trading opportunities.
What data sources are best used to calculate ROC?
Stock exchanges, such as the New York Stock Exchange or NASDAQ, are the most reliable data sources for calculating ROC. Historical price data can be obtained from these exchanges and then used to calculate the price rate of change. Additionally, technical analysis software packages often provide real-time price updates that can be used.
Is the price rate of change (ROC) a reliable pattern?
Yes, our research shows that the price rate of change (ROC) is a reliable indicator, with a reward-to-risk ratio averaging 2.6 and a success rate of 60% over a 12-year test period.
What is the difference between ROC and RSI?
ROC and RSI measure different aspects of price movements. The Relative Strength Index (RSI) is an oscillator that measures momentum by comparing recent gains to losses over time. The Rate of Change (ROC) is a momentum indicator measuring the percentage price change between two different periods.
What is the ROC percentage?
The ROC percentage is the rate of change between two time periods. It is calculated by dividing the difference in closing prices between the two time periods and then dividing it by the earlier period's closing price. For example, if a stock closes at $20 on day 1 and $22 on day 2, its ROC percentage would be 10%.
Is ROC a good indicator?
Yes, ROC is a good indicator. Our 20 years of testing shows it performs really well, with a 66% chance of outperforming a buy-and-hold strategy. Not all indicators work well, but ROC is one of the best.
Is ROC a leading indicator?
Yes, ROC is a leading indicator. It helps investors anticipate turning points in the market by showing when momentum is changing direction. Using ROC divergences can help traders make better-informed decisions about entry and exit points for their trades.
Can I use ROC to predict future stock performance?
No, ROC cannot be used to predict future stock performance, but it can indicate future price direction. It indicates the current momentum in the market and can help traders identify potential turning points.
When should I use ROC?
ROC is best used as a short-term indicator. It can be used to confirm trends and identify potential reversals in the near future but should not be relied on for long-term predictions. Also, it is important to remember that ROC does not guarantee success; traders must do their own analysis.
What indicators are similar to ROC?
Indicators that are similar to ROC include moving averages, the relative strength index (RSI), and stochastics. Moving averages provide a smoothed version of price action over a certain time period and can be used to identify potential entry or exit points. The RSI is another leading indicator that measures the speed and change of recent stock prices.