The average true range (ATR) is a nondirectional momentum indicator that measures price volatility.
My test trades yielded a 1.77 reward-to-risk ratio, with an average winning trade of 8.5%. Across a large sample, an ATR-based strategy yielded a small gain per trade, but it lost more often than it won and experienced significant drawdowns.
While primarily recognized for its role in the commodities market, ATR’s application extends across stocks, forex, and futures markets, making it a valuable indicator for diverse trading strategies.
Key Takeaways
- The ATR indicator measures market volatility and price movements.
- It is utilized across various markets, enhancing the strategy for entry and exit points.
- Understanding and interpreting ATR can optimize its application and improve trade management.
- The ATR trailing stop is an indicator that can be used for profitable trading.
- ATR has a win rate of 43% and an 8.5% average profit vs a -4.8% loss.
Testing Summary
- Edge: Small but real—expectancy ≈ +0.19R/trade, avg. return ≈ +0.9–1.0%/trade, profit factor ≈ 1.34 (from 43% wins with 1.77 reward/risk).
- Risk profile: Material drawdowns (-40% vs asset -47%), so the edge comes with notable pain.
- Tempo: 1,205 trades over ~297 years of aggregated data ≈ ~4 trades/year—a slow, grind-it-out system.
- Takeaway: ATR alone is not a strong standalone signal; it’s better as a volatility/position-sizing and stop framework. Pair it with a directional edge (trend, momentum, or mean-reversion rules) to justify the drawdown and improve the hit rate.
Understanding the ATR Indicator
The ATR is not a directional indicator, such as up or down, but it provides insight into the volatility of a certain stock or market. This information can inform your trading decisions, especially regarding stop-loss orders or identifying suitable entry and exit points.
It’s important to note that ATR does not predict price direction or momentum but measures interest level or volatility. This volatility indicator provides an understanding of the degree of price movement in a market, irrespective of direction.
How to Trade the ATR Indicator
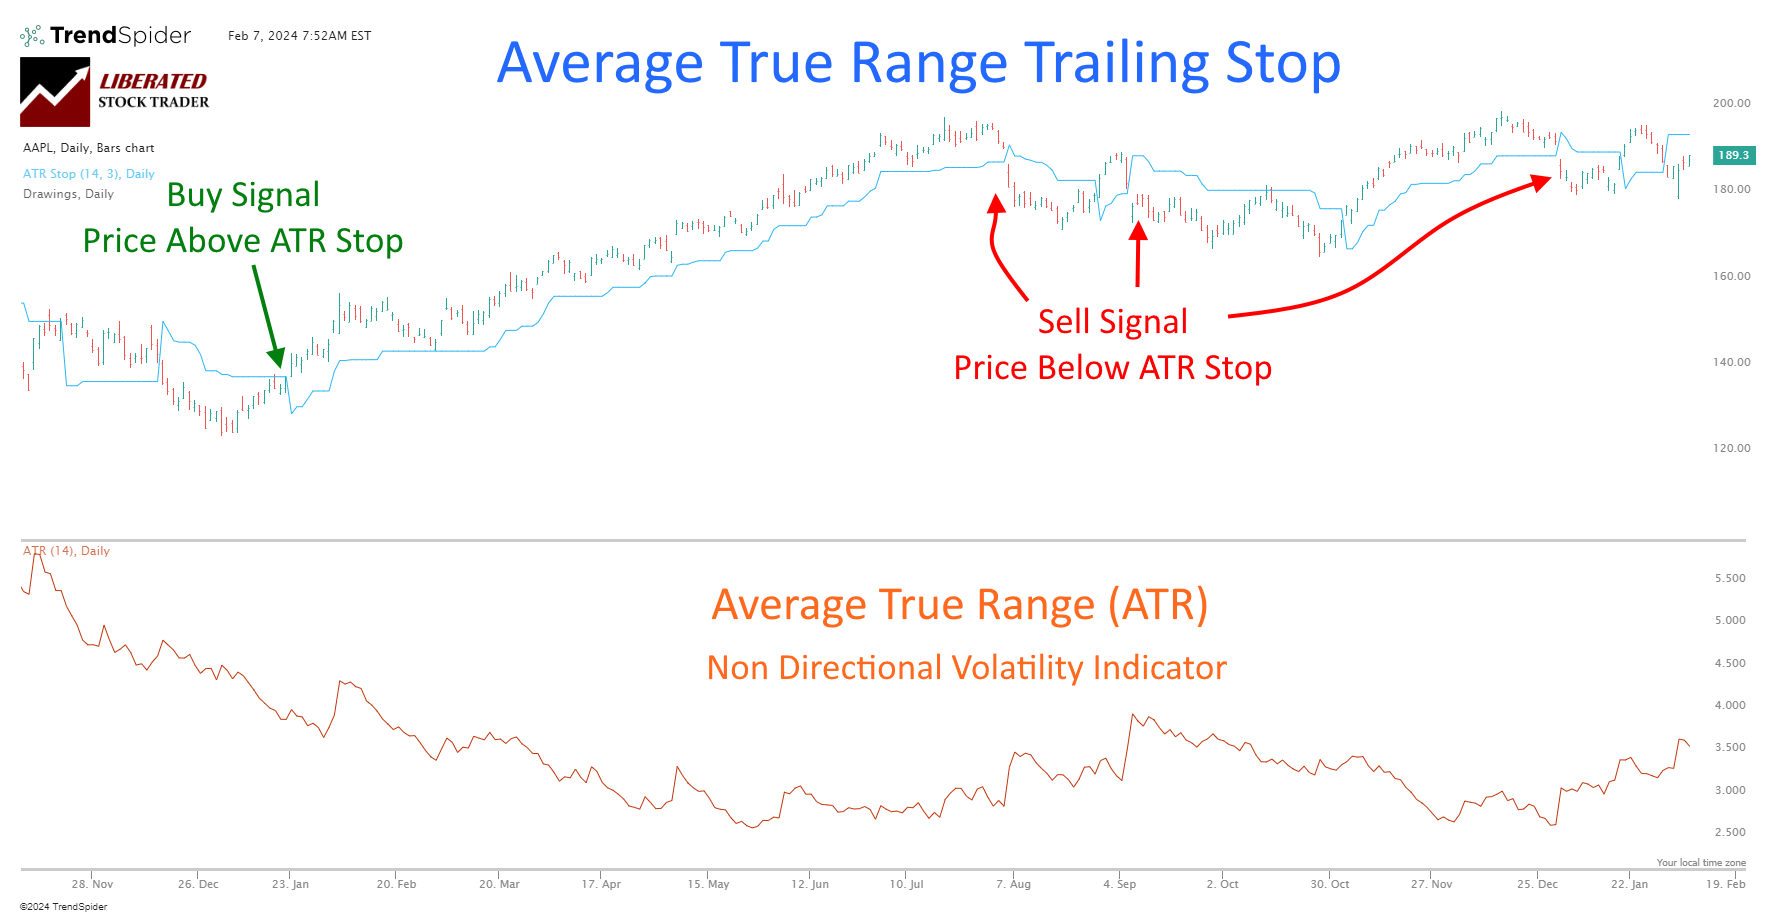
You cannot directly trade using the ATR indicator to provide precise buy and sell signals. ATR is a nondirectional indicator, meaning it only indicates the amount of momentum or volatility in a stock price, not the direction. When ATR increases, an asset price can increase or decrease. ATR shows only the power behind the price move in either direction.
However, you can use the ATR trailing stop indicator to provide reliable buy and sell signals; see the image below for how to trade ATR.
Trade the ATR Indicator with TrendSpider
Trading the ATR Trailing Stop
The ATR trailing stop indicator is better suited for trading as it provides a clear buy and sell signal for traders and can be accurately measured using backtesting trading software such as mytop recommendation, TrendSpider.
The ATR trailing stop is a modified version of the standard trailing stop used in technical analysis. It adjusts the stop-loss level according to the ATR value, providing a dynamic stop-loss that considers market volatility.
To use the ATR trailing stop, you must first determine your risk tolerance and how much you are willing to lose on a trade. This will be used as your initial stop-loss level. Next, calculate the ATR value for your chosen time frame using a charting platform or an online calculator. Then, multiply the ATR value by a predetermined multiplier (usually between 2 and 3) and add this number to your entry price for long positions or subtract it for short positions.
TrendSpider 4.8/5⭐: My Pick for AI-Power & Auto-Trading
I’ve used TrendSpider for 7 years for my research and testing. It auto-detects trendlines, patterns, and candlesticks, backtests ideas, and lets you use AI to create unique strategies and launch trading bots—with no code.

☆ Backtesting ATR Trailing Stop ☆
TrendSpider provides incredibly granular point-and-click backtesting functionality, enabling powerful strategy development. It is my favorite tool for auto trading, backtesting, and systematic trading.
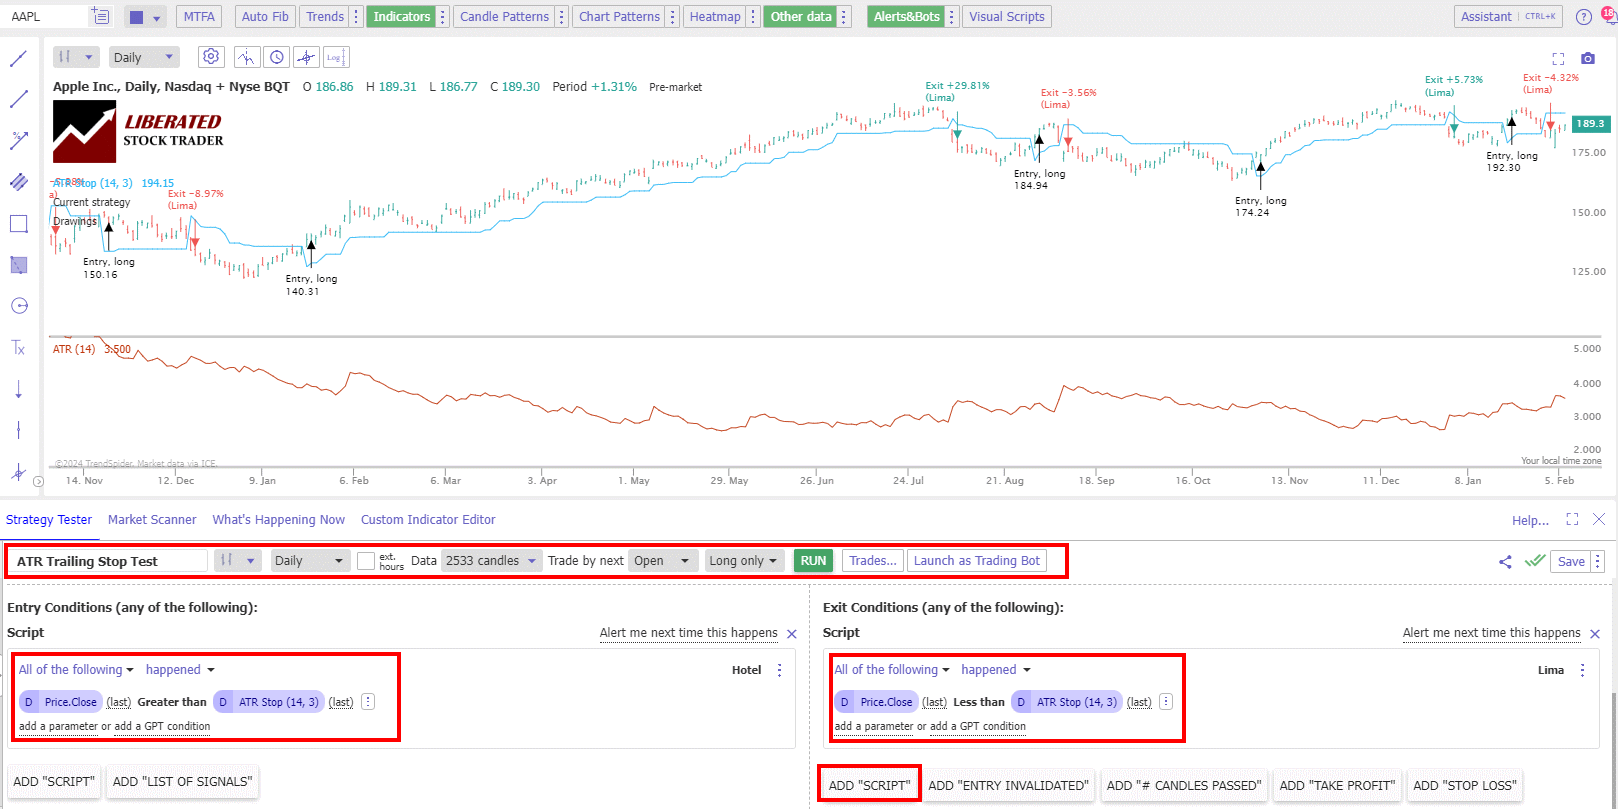
To set up ATR indicator backtesting in TrendSpider, follow these steps:
- Register for TrendSpider.
- Select Strategy Tester.
- Entry Condition > Add Script > Add Parameter > Condition > Price (Close) > ATR Stop (14,3).
- Sell Criteria, select > Add Script > Add Parameter > Condition > Price (Close) < ATR Stop (14,3).
- Finally, click “RUN.”
Backtest ATR Free with TrendSpider
Do you want to test any indicator, chart pattern, or performance for any US stock? The award-winning TrendSpider software makes it easy! My Trendspider review unveils insights into discovering the most powerful trading strategy development and testing service.
☆ ATR Trailing Stop Reliability Test Results ☆
The backtesting data covers 297 years. During this period, 1,205 positions were taken on the Dow Jones 30 stocks. Testing was based on the ATR trailing stop indicator. When the price was above the trailing stop, a long trade was executed, and when below, the trade was closed.
Of these positions, only 43% resulted in wins, while 57% ended in losses. The maximum drawdown (DD) experienced during the testing period was -40%.
On average, the winning positions yielded a high return of 8.5%. Conversely, the losing positions had an average loss of -4.8%. Overall, the average return from all positions taken was 1%.
| ATR Backtest Parameters | Results |
| Data Analyzed (years) | 296.8 |
| #Trades | 1,205 |
| Wins | 43% |
| Losses | 57% |
| Max DD | -40% |
| Max DD (Asset) | -47% |
| Average Win | 8.5% |
| Average Loss | -4.8% |
| Average Return | 1.0% |
| Rew/Risk Ratio | 1.77 |
| Expectancy | 0.19 |
Despite the higher percentage of losing trades, the winning positions had a higher average return of 8.5%. On the other hand, the losing positions had an average loss of -4.8%. Overall, the average return from all positions taken during the backtest was 1%.
The reward-to-risk ratio stood at 1.77, indicating that, on average, the potential reward was around 1.77 times the potential risk. The expectancy, calculated by considering the win rate and average return, was 0.19.
Example: Test Trade Result Chart Apple Inc. (AAPL)
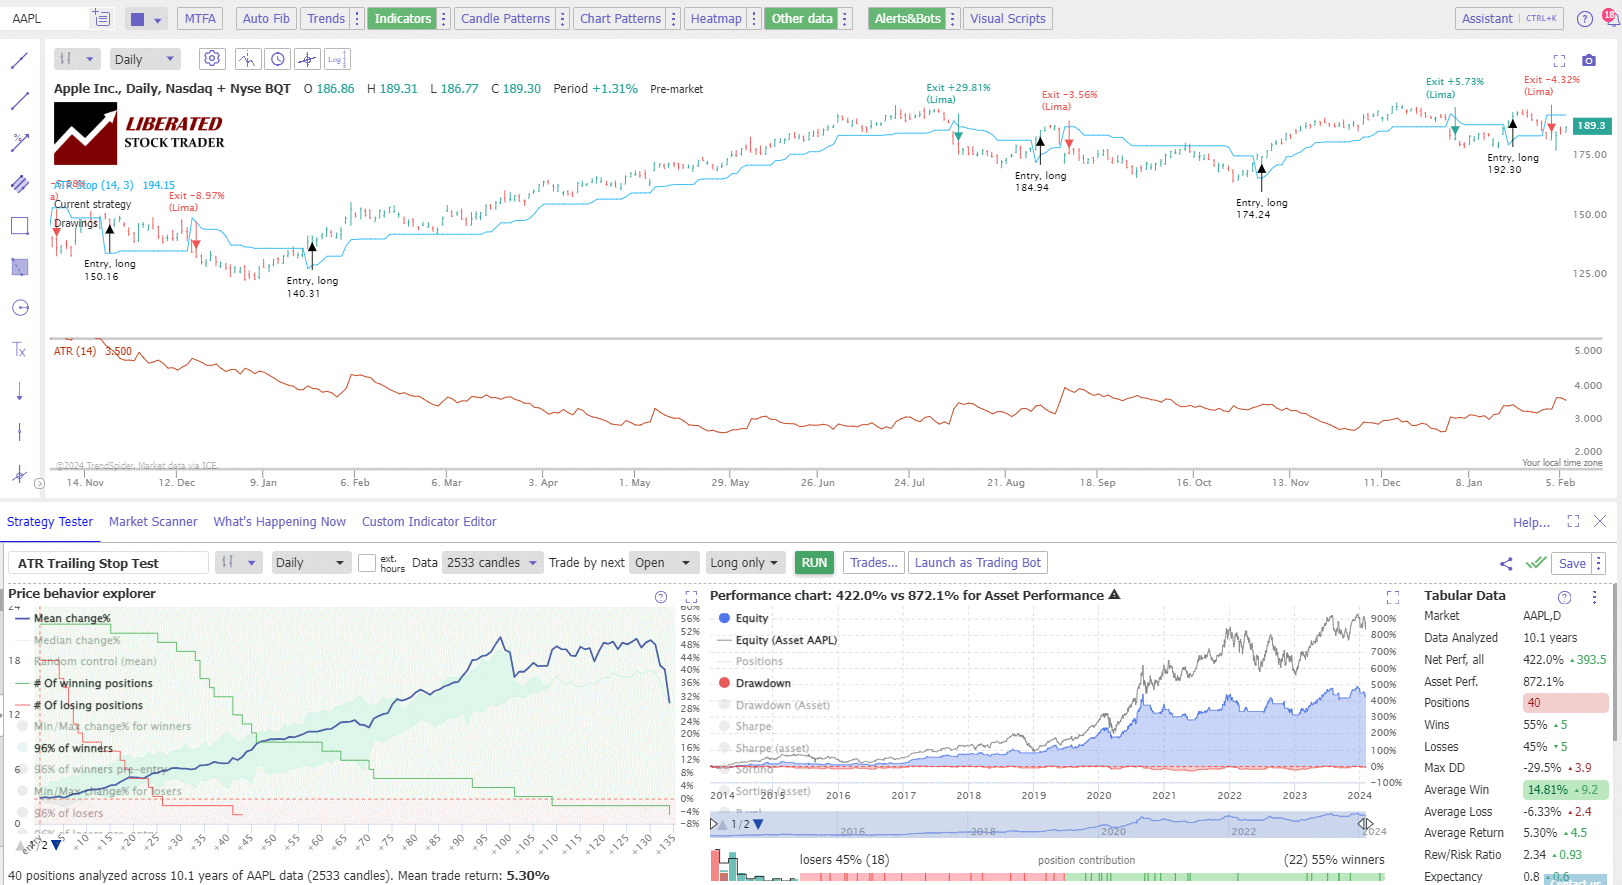
In summary, the ATR backtest results indicate that although the win rate is not particularly high, the winning positions tend to provide a favorable return, resulting in an overall positive average return. However, it is important to note the significant drawdown experienced during the testing period.
Calculation of ATR
To calculate ATR, you first need to understand the concept of True Range. The True Range is the greatest of the following:
- The difference between the current high and the current low
- The absolute value of the current high minus the previous close
- The absolute value of the current low minus the previous close
The Average True Range (ATR) is a volatility indicator that measures market fluctuation by decomposing the entire range of an asset’s price for that period. It is particularly useful for traders who want to understand an asset’s volatility before entering a trade.
- Compute the True Range for each period.
- Obtain an average of the True Ranges, typically over 14 periods.
ATR Formula
The ATR is the moving average of the true ranges over a given number of periods. It is calculated by:
Here’s a simple formula representation:
ATR = (Previous ATR * (n-1) + Current True Range) / n
Where n is the number of periods used for averaging, usually 14.
Use ATR to gauge the level of interest or disinterest in a price move. For example, a high ATR indicates increased interest, signaling that the price may continue to move in its current direction. At the same time, a low ATR suggests a lack of interest, potentially leading to price stagnation or reversal.
Period Selection
Period selection refers to the number of individual periods used to calculate the ATR. The standard setting for the ATR is 14 periods, but you may select a different number depending on your trading strategy. The key is to ensure consistency in the application to assess volatility accurately. Longer periods will generate a smoother ATR line, while shorter periods will respond more quickly to price changes.
ATR as a Volatility Measure
ATR measures volatility by decomposing the entire range of an asset price for that period.
Interpreting High and Low ATR Values
When you observe high ATR values, it indicates high volatility, signaling broader price movements within the given time frame – daily, weekly, or monthly. Conversely, low ATR values denote low volatility, indicating lower price movement. For clarity:
- High ATR values (> X):
- Indicate high volatility
- Suggest larger price movements
- Low ATR values (< X):
- Indicate low volatility
- Suggest smaller price movements
X depends on the asset and the period you are analyzing.
Comparative Analysis Across Different Time Frames
To understand price volatility comprehensively, you can use ATR to compare volatility across different time frames. For example:
- Daily ATR:
- Captures day-to-day market fluctuations
- Useful for short-term trading strategies
- Weekly ATR:
- Smoothes out short-term spikes
- Provides insights for mid-term trading outlook
- Monthly ATR:
- Offers a broad view of market sentiment
- Helpful for long-term investment analysis
Comparing these can help you understand if an asset’s volatility is a short-term occurrence or part of a longer-term trend.
ATR Trading Rules
ATR is a versatile tool that measures market volatility and assists in developing effective risk management strategies. It provides insights crucial for setting stop losses, determining position sizing, and pinpointing entry and exit points.
Setting Stop Losses
By factoring ATR into your stop loss strategy, you can adjust your stops based on market volatility. This helps in preventing premature trade exits due to normal price fluctuations. A common method is the Chandelier Exit, introduced by Chuck LeBeau, which sets a trailing stop based on a multiple of ATR below the highest price the asset has reached during the trade for a long position. For a short position, the Chandelier Exit is placed above the lowest price of the asset by a multiple of ATR, accounting for selling pressure. Here’s a simple representation:
- Long Position Stop Loss:
Highest High - (ATR * Multiplier) - Short Position Stop Loss:
Lowest Low + (ATR * Multiplier)
Determining Position Sizing
ATR can help you calculate the ideal position size for a trade. By comparing the ATR to your stop loss level, you ensure your position size is adjusted for current market volatility. This strategy balances the risk across different trades, regardless of the trading range. Use this formula to align your position sizing with market volatility:
- Risk Amount: Determine the total dollar amount you are willing to risk on the trade.
- ATR-based Stop Distance: Calculate the stop distance informed by current ATR values.
- Position Size:
Risk Amount / ATR-based Stop Distance(This gives the number of shares or contracts to trade).
Entry and Exit Points
ATR helps identify the right moments for entering and exiting trades. By observing changes in ATR, you can gauge shifts in buying or selling pressure. An increasing ATR indicates rising volatility, often associated with strong directional price moves, which can inform entry points during breakout strategies.
Conversely, a low ATR might signal a consolidation phase, potentially informing exit points to avoid limit moves. A strategic application for using ATR is to enter a trade when the price moves above a resistance level by a factor of ATR, indicating a potential volatility expansion and a stronger move.
ATR in Different Market Conditions
The Average True Range (ATR) indicator helps you understand the volatility in various market conditions, whether in strong trends or periods of consolidation. By analyzing ATR values, you can gauge the market’s interest and pressure in bullish or bearish directions and anticipate potential continuation moves or reversals.
Trending Markets
In a trending market, the ATR typically exhibits higher values, which reflect increased volatility due to strong buying or selling pressure. For instance:
- Bullish Market: Increasing ATR values may signify a strong bullish trend with sustained interest from buyers. Here’s what you might see:
- ATR Value: Rising
- Market Interpretation: High buyers’ interest, strong upward pressure.
- Bearish Market: Similarly, an elevated ATR in a bearish market can suggest aggressive selling, leading to a steep decline.
Table: ATR Behavior in Trending Markets
| Market Type | ATR Trend | Interpretation |
|---|---|---|
| Bullish | Rising | High buying pressure, continued interest |
| Bearish | Rising | Strong selling pressure, a potential continuation of the decline |
Sideways/Consolidating Markets
The ATR often decreases in sideways or consolidating markets, indicating lower volatility within the consolidation area. This diminished volatility suggests a lack of strong directional pressure as the market decides its next move. Key insights:
- Low Volatility: A low ATR value can point to a tight consolidation, with the potential for an abnormal price movement once the market breaks out.
- Breakout/Reversal: An increase in the ATR after a period of low volatility can be a catch for the beginning of a new trend or a reversal.
Table: ATR Behavior in Consolidating Markets
| Market Scenario | ATR Trend | Possible Interpretation |
|---|---|---|
| Consolidation Period | Decreasing | Low volatility, indecision, market poised for a move |
| Post-Consolidation | Increasing | Breakout from consolidation, the start of a new trend, or reversal |
When you interpret ATR readings, remember always to consider them in the context of the market environment. Robust ATR values in trending markets and diminished ATR in consolidating markets offer key signals about volatility and potential price movements.
Combining ATR with Other Indicators
When integrating the Average True Range (ATR) with other technical analysis tools, you’ll enhance your strategy by gaining insights into volatility in conjunction with momentum, trend strength, and potential reversal signals.
Combination with RSI
The Relative Strength Index (RSI) measures the velocity and magnitude of price movements. Combining ATR with RSI allows you to gauge when the market is potentially overbought or oversold while considering the current volatility. For instance:
- Overbought Conditions: RSI > 70, and a rising ATR may indicate increasing selling pressure.
- Oversold Conditions: RSI < 30, and an increasing ATR could reflect growing buying pressure.
Synergy with Moving Averages
Exponential Moving Averages (EMAs) track the predominant trends by smoothing out price fluctuations. ATR, when utilized with EMAs, can help you discern the sustainability of the trend. For example:
- Rising ATR with a price above a key EMA (such as the 50-day or 200-day EMA) suggests a strong and potentially sustained uptrend.
- Conversely, an increasing ATR with a price below a major EMA may signal a strong downtrend.
ATR and MACD
ATR’s partnership with the Moving Average Convergence Divergence (MACD) indicator offers a strategic view of market momentum and trend reversals. This confluence can confirm entry and exit points:
- Bullish Scenario: A bullish MACD crossover accompanied by a low but increasing ATR may point to the start of a sustained upward move.
- Bearish Scenario: A bearish MACD crossover with an increasing ATR might indicate a strong downward momentum.
By incorporating ATR with these indicators, you can refine your technical analysis and make more informed trading decisions.
ATR Time Frame and Period Selection
The Average True Range (ATR) indicator is adaptable, allowing you to tailor its time frame and period to match your trading or investment strategy. Understanding the significance of period selection is crucial for using ATR effectively.
Short-Term Trading Considerations
For short-term traders like day traders, selecting the appropriate ATR time frame and period is vital for gauging market volatility. When you operate on shorter time frames, such as a one-minute chart, using a 14-period ATR to determine volatility is common. However, you can adjust the number of periods to suit your specific needs; fewer periods can lead to a more sensitive ATR that responds quickly to market changes, which is crucial for setting tight profit targets. Here’s a brief guide to help you decide:
- One-minute chart: A 14-period ATR for moderate sensitivity or a 7-period for a higher sensitivity that suits aggressive trading.
- Five-minute chart: Often a 14-period ATR, balancing responsiveness with stability.
Long-Term Investment Strategies
Conversely, if you are a long-term investor, you need to consider a longer period to align with the strategy of long-term market trends. The ATR indicator can be set to a daily chart with a standard 14-period setting, providing a steady measure of volatility. You might extend the periods for your ATR calculation to smooth out short-term fluctuations and better understand the long-term volatility trend. This approach helps set broader profit targets and makes strategic exit or entry decisions.
- Daily chart: Typically, a 14-period ATR is used for a balanced view, but you might prefer a 28-period or higher for a long-term perspective.
Remember that the periods you select directly impact the indicator’s sensitivity and should align with your overall trading or investment horizon.
Interpreting ATR for Various Asset Classes
The Average True Range (ATR) indicator measures market volatility. By understanding its application across different asset classes, you can more precisely incorporate ATR into your trading strategy for commodities, stocks, and forex markets.
ATR for Commodities
The ATR can be especially useful for gauging daily volatility when considering commodities. Commodities often face price swings due to geopolitical events or natural disasters, so a higher ATR value indicates greater volatility. You might see this in markets for oil, gold, or agricultural products. Look at the ATR over a standard 14-day period to understand the average volatility. This information helps you set more accurate stop-loss orders and anticipate potential price movements for intraday trading.
ATR for Stocks
In the stock market, you’ll find that ATR can serve as a lens into a stock’s volatility. For instance, high ATR values typically show that a stock has had wider price fluctuations and could be considered more volatile, suggesting higher risk or potential for reward. Conversely, a low ATR indicates less volatility. By comparing the ATRs of different stocks, you get a clearer picture of relative volatility, which is crucial for managing the risk associated with your positions, particularly when devising strategies for individual securities or the broader equity market.
Application in Forex Markets
The ATR’s usefulness extends into the forex market as well. Because forex is traded around the clock, the indicator helps understand the volatility of different currency pairs. It shows you the average movement a pair makes daily and is essential for adjusting your strategies to intraday or daily market changes. You can use the ATR to set your stop losses and decide on trade exit points, which can be particularly valuable given the forex market’s high liquidity and fast pace. Remember that a higher ATR means larger price movements and possibly more risk, so adjust your trading approach accordingly.
ATR and Market Signals
The Average True Range (ATR) indicator is a versatile tool that can help you decipher a market’s volatility and interpret specific trading signals. It is particularly useful for identifying potential breakouts or reversals and spotting moves that might indicate continuation or exhaustion.
Identifying Breakouts and Reversals
- Breakouts occur when the price of an asset moves outside a defined range, and ATR can signal the move’s strength. A significant increase in ATR following a period of consolidation suggests a strong breakout. It’s important to compare the current ATR value with previous levels to confirm a breakout signal. This can serve as a buy signal for traders if the breakout is above resistance or a sell signal if it falls below support levels.
- Reversals are indicated by a decline in ATR after a volatile price move. An abrupt decrease in the ATR could mean a potential reversal, signifying that the market may be losing momentum and that the current trend is potentially ending. Your strategy should account for these signals and adjust positions accordingly to capitalize on the impending change in price direction.
Spotting Continuation or Exhaustion Moves
ATR is useful for identifying whether a market is likely to continue in its current trend or if the movement is losing steam, pointing toward exhaustion.
- For continuation, consistent ATR values and a persistent trend can reaffirm your belief in the market’s current direction. Small price gaps following this pattern often serve as confirmatory indicators of ongoing trends, giving you more confidence in your trading decisions.
- Regarding exhaustion, if you observe an increased ATR in conjunction with erratic price behaviors and substantial price gaps, it may indicate that the trend could be overextended. This pattern often leads to price corrections or reversals, prompting traders to reassess their positions to take profits or limit losses.
By incorporating ATR into your market analysis, you harness a deeper understanding of volatility and the quality of price moves, bolstering your capability to make informed trading decisions in various market conditions.
My groundbreaking research into the profitability and success rates of chart patterns and technical indicators is built on the most powerful backtesting platforms available. If you want to design original, profitable trading strategies, our exclusive review of the best backtesting software will help you find the perfect solution to give you a real edge in the markets.

FAQ
What is the best software for trading ATR?
To effectively trade ATR indicators I recommend TrendSpider or TradingView. TrendSpider has powerful point-and-click backtesting and auto-trading bot integration. TradingView has a powerful charting interface and a global trading community.
How do I use the ATR indicator to set a stop loss?
To set a stop loss using the ATR indicator, you can subtract a multiple of the ATR from the entry price for a sell position or add it to the entry price for a buy position. Common multiples are 1.5 or 2 times the ATR, which adjusts for the stock's volatility.
What is considered a good ATR value in trading?
A good ATR value cannot be defined universally as it depends on the specific market, the stock's historical volatility, and your trading strategy. A higher ATR indicates higher volatility, which may require wider stop losses to avoid market noise.
How can I calculate the Average True Range for a stock?
To calculate the ATR for a stock, you take the highest value from the following three: current high minus the current low, current high minus the previous close, or the current low minus the previous close. These values are then typically averaged over 14 days to get the ATR.
What strategies use the ATR indicator in trading?
Strategies involving the ATR include volatility-based entry and exit points, stop loss placements and position sizing. The ATR can also be used with other indicators to confirm trend strength or potential breakout situations.
How do I configure ATR settings for a 5-minute chart?
For different timeframes, such as a 5-minute chart, you can adjust the ATR period to suit your trading style. Short-term traders may use a lower period value for more sensitivity, while long-term traders prefer a higher value for greater smoothing.
Can you suggest some indicators that are similar to the Average True Range?
Indicators similar to ATR include the Relative Strength Index (RSI), which measures the speed and change of price movements, and Bollinger Bands, which use standard deviations to calculate volatility. Both help assess market conditions like ATR but provide additional insights into momentum and market trends.
Who created the ATR indicator?
J. Welles Wilder developed the Average True Range (ATR) indicator; the ATR appears in his book "New Concepts in Technical Trading Systems."