Experienced investors backtest their trading strategies to optimize their portfolios. Backtesting is a critical step that enables traders to assess the potential viability of a trading strategy by applying it to historical data.
I have been backtesting investing strategies for 15 years. In this guide, I will show you how it works and outline the key steps for successful backtesting. This will help you ensure that your trading strategies are well-tested and ready to take on live markets.
What is Backtesting?
Backtesting is a critical process in developing and evaluating trading strategies. It enables traders to assess an investment strategy’s potential viability by applying indicators and chart patterns to historical data.
Backtesting starts with a hypothesis about how the market works – such as a belief that prices tend to move in waves. Next, traders develop and refine a strategy based on this hypothesis, testing it against historical data to see whether it produces profits when applied over time. The most important thing is to test the validity of your hypotheses and measure the performance of different strategies.
Backtesting requires patience and discipline; however, when done properly, it can deliver valuable insights into the effectiveness of an investment strategy before applying it with real money.
Understanding Backtesting
Defining Backtesting
Backtesting refers to the method traders use to simulate a trading strategy using historical stock data. This practice allows one to estimate how well a strategy would have performed historically, giving insight into its potential future performance in the financial market. The fidelity of backtesting results depends deeply on the data quality and the tested strategy’s robustness.
The Importance of Historical Data
Historical data is the backbone of backtesting. This information includes a range of data points like stock prices, volume, and market conditions, which are essential to recreate market behavior during the period under study. The comprehensive nature of this data determines the accuracy of backtesting; the more detailed and complete the historical data, the more reliable the backtesting results. It provides traders with a scenario to verify how certain trading strategies would have withstood past market events, such as financial crises or bull markets.
Setting Up a Backtesting Environment
Establishing a robust backtesting environment is crucial for validating the efficacy of trading strategies. This involves selecting the appropriate tools, ensuring access to reliable market data, and tailoring the system to meet the specific testing criteria.
Choosing the Right Backtesting Software
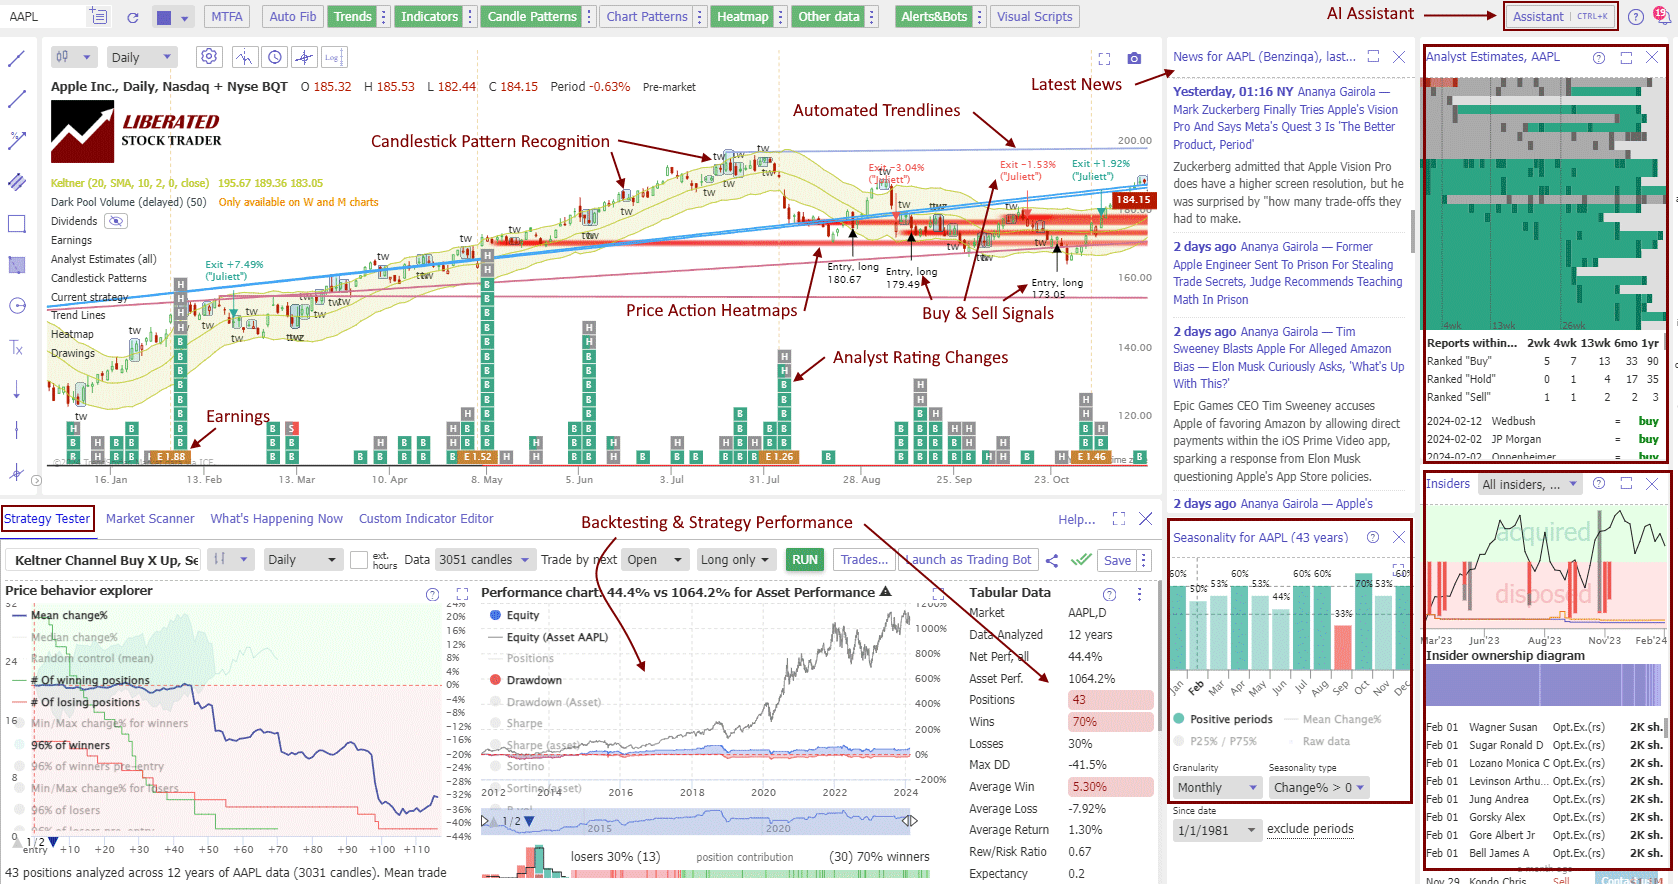
The foundation of any backtesting environment is the software used to run simulations. Traders should look for software that balances user-friendliness and comprehensive analytical capabilities. The best backtesting software should be capable of executing a range of strategies with various assets and time frames. Some popular software choices in the industry include TradingView, TrendSpider, and FinViz.
TrendSpider 4.8/5⭐: My Pick for AI-Power & Auto-Trading
I’ve used TrendSpider for 7 years for my research and testing. It auto-detects trendlines, patterns, and candlesticks, backtests ideas, and lets you use AI to create unique strategies and launch trading bots—with no code.

Backtesting with TrendSpider
TrendSpider is our recommended backtesting tool. It offers an advanced strategy tester and backtest engine. Its simple point-and-click features make it easy for users to construct complex strategies without coding knowledge. It also has a wide range of pre-built technical indicators and powerful visualizations for analyzing the backtested results.
Get Code Free TrendSpider Backtesting
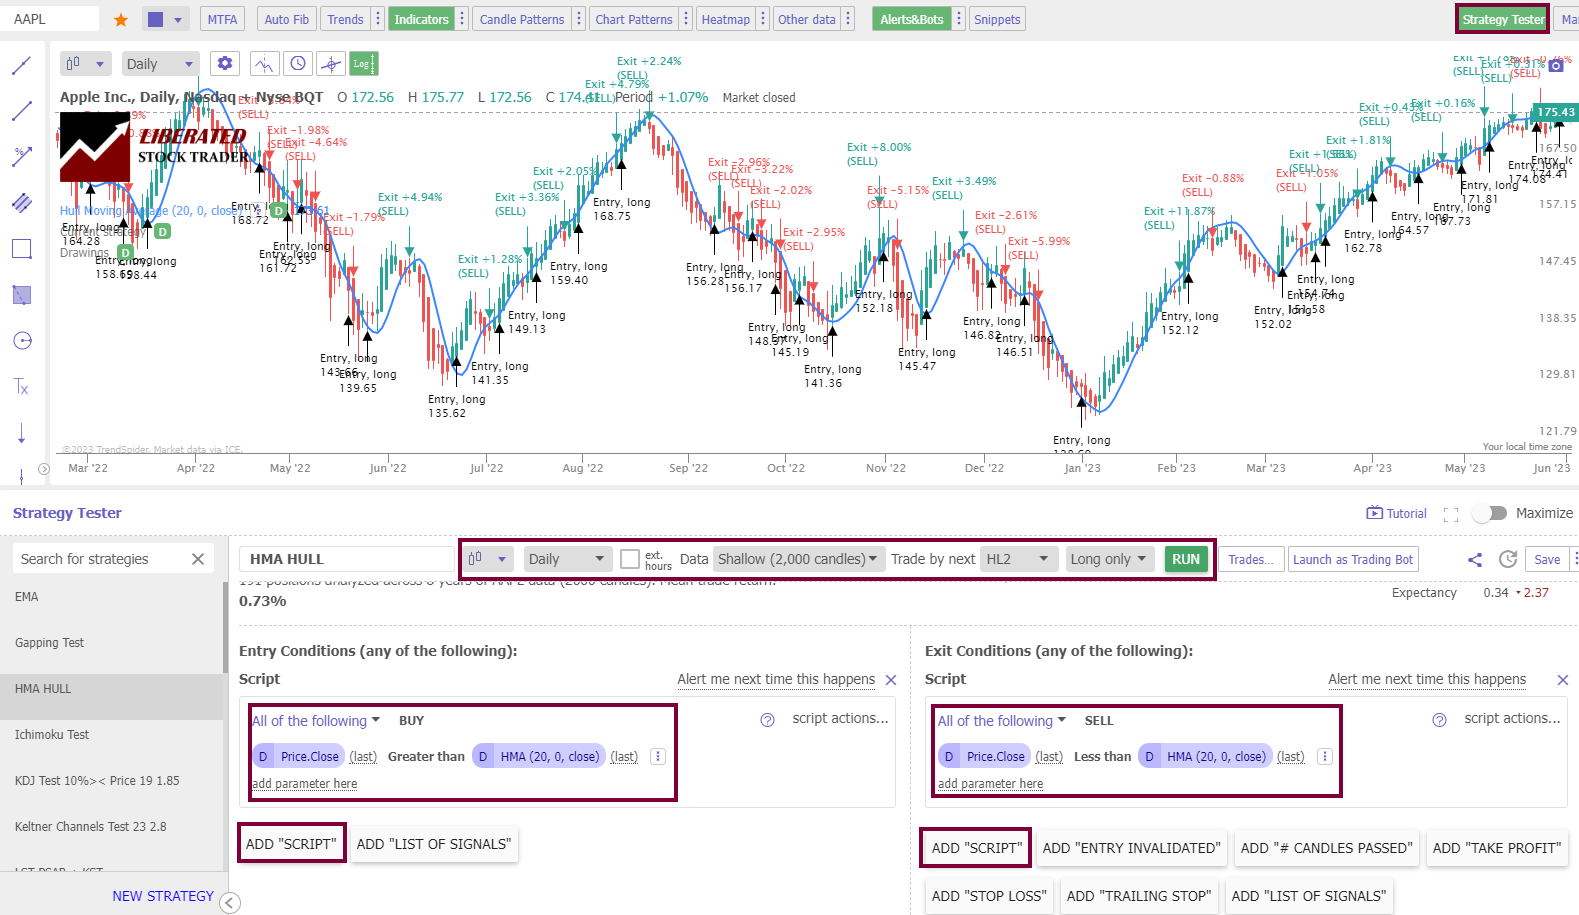
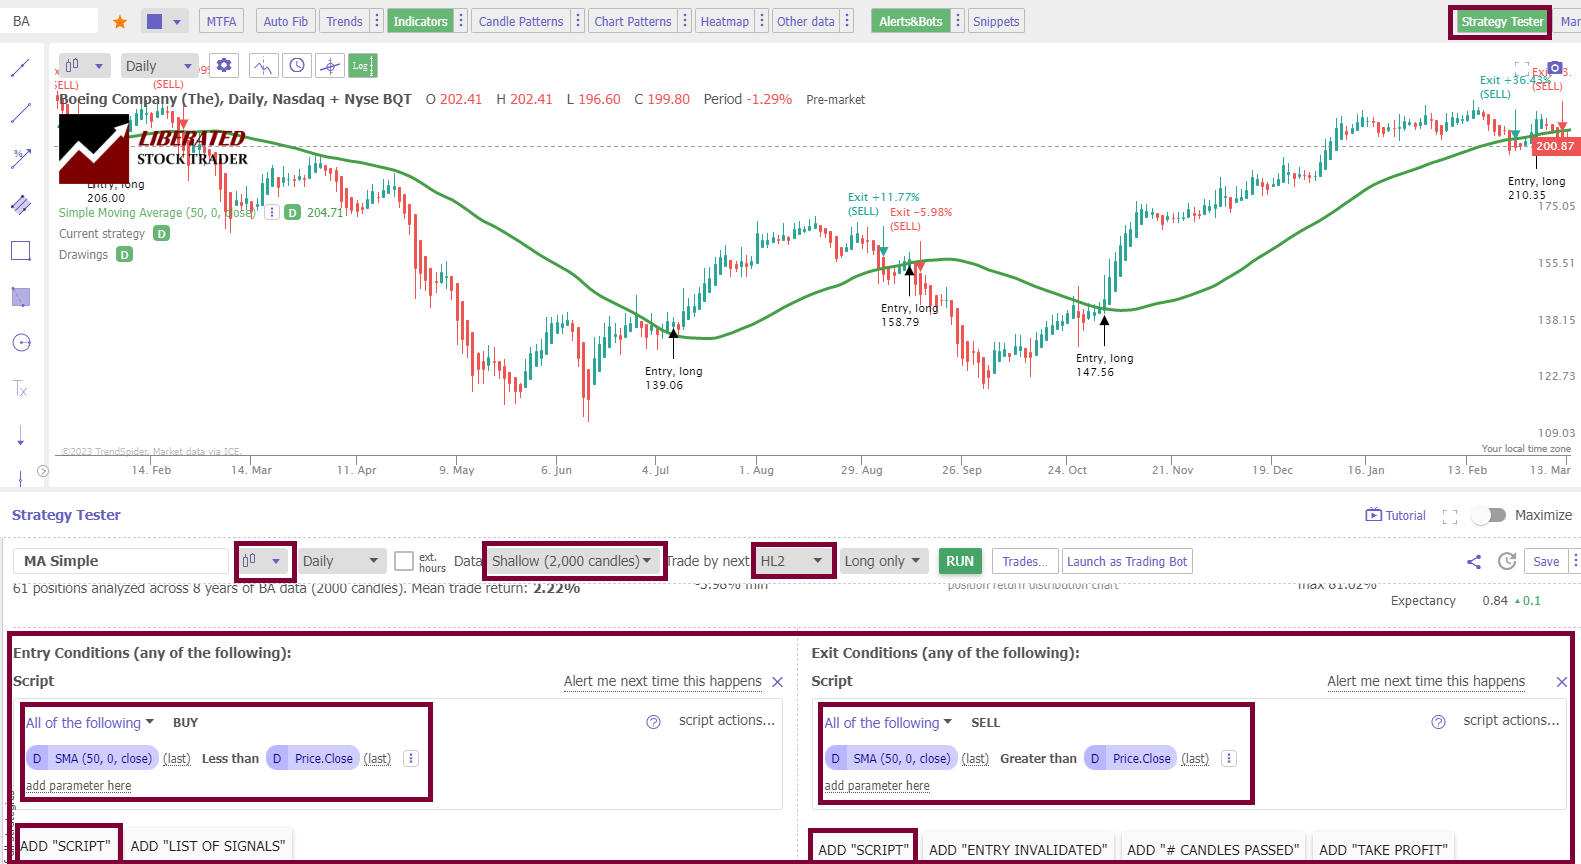
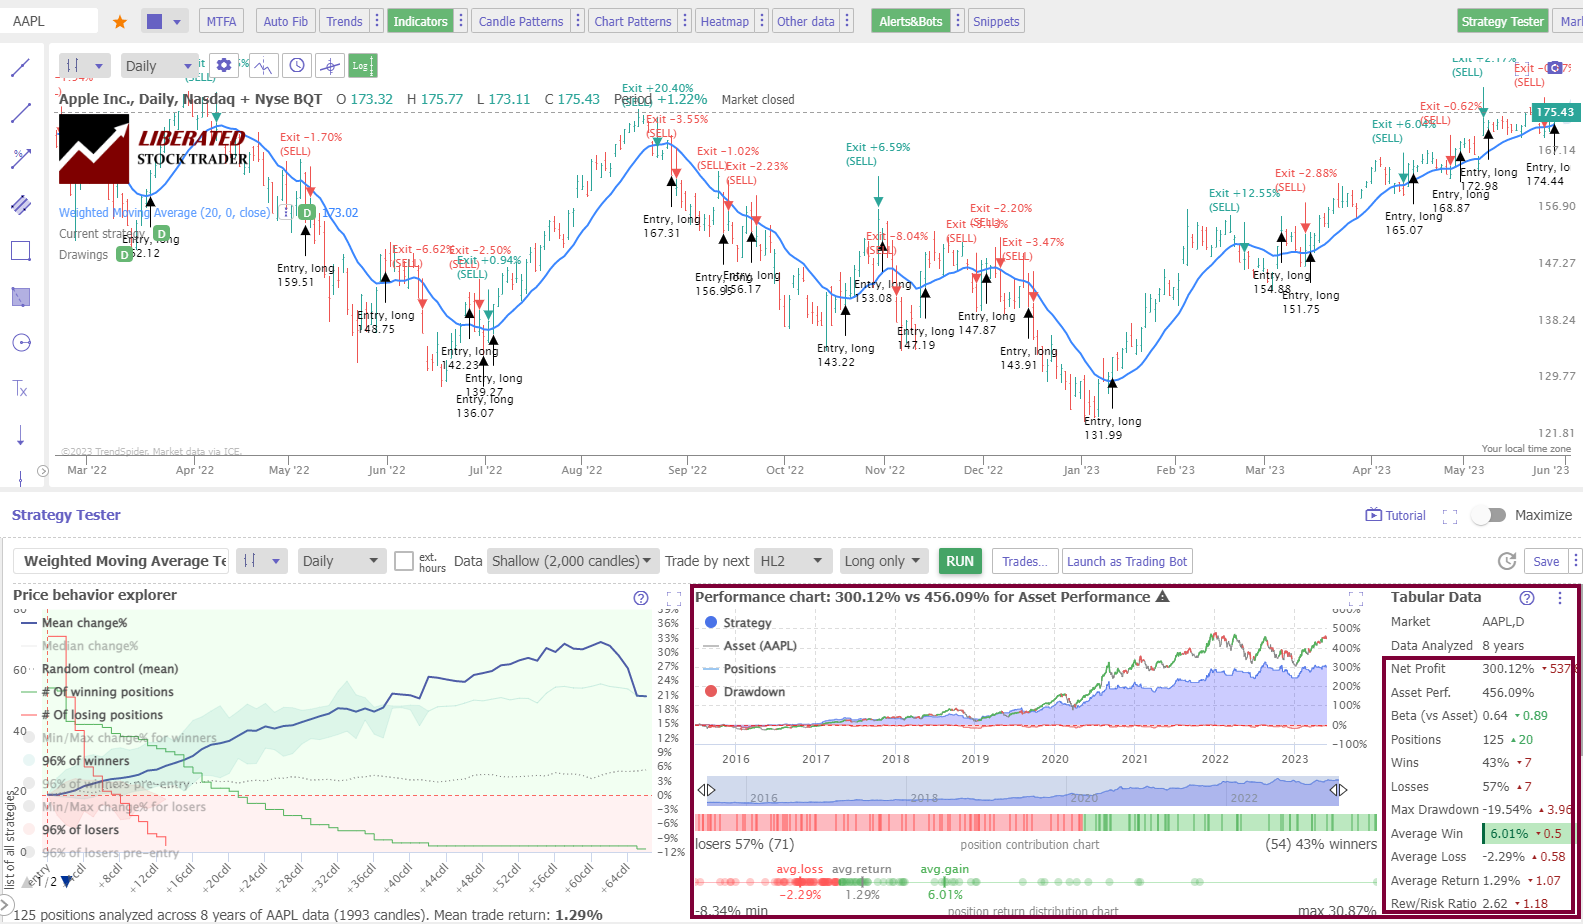
How to Set Up Moving Average Backtesting
To set up backtesting, I used TrendSpider, our recommended trading software for serious traders. The screenshot below shows the exact configuration for our SMA backtesting. To set up backtesting in TrendSpider, follow these simple steps:
- Register for TrendSpider
- Select Strategy Tester > Entry Condition > Add Script > Add Parameter > Condition > Price > Greater Than > Moving Average.
- For the Sell Criteria, select > Add Script > Add Parameter > Condition > Price > Less Than > Moving Average.
- Finally, click “RUN.”
Backtesting with TradingView
TradingView is a trading analysis platform that provides users with powerful charting tools, data analytics, and algorithmic backtesting. The platform has hundreds of indicators and drawing tools that allow traders to design automated strategies. These strategies can then be tested using historical data over predetermined time frames. To develop original strategies, you will need to learn Pine coding.
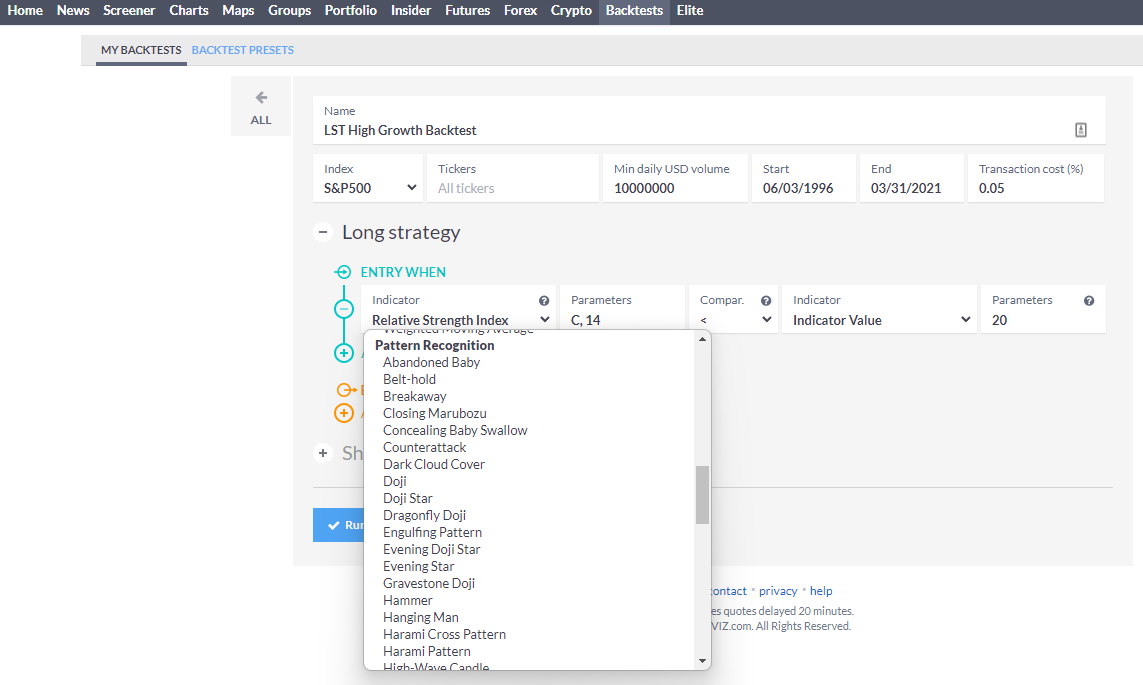
Backtesting with Finviz
Finviz is a cloud-based stock screening and analysis tool that allows users to test various strategies quickly. It includes a backtesting feature with data going back up to 15 years, allowing traders to analyze different stocks and compare their performance against different time frames or market conditions. Finviz also provides comprehensive charting tools for further exploring analyzed stocks.
Data Sources and Market Data
Quality market data is the lifeblood of backtesting. Traders must source historical price and volume information from a reliable data vendor. The data should be free of gaps and inaccuracies, which could skew backtest results. It’s critical to choose market data that matches the frequency and detail level of the strategy to be tested—whether it’s tick data or EOD (end-of-day) data.
Customization and Code
Customization is where backtesting becomes particularly powerful. Traders can customize strategies and backtest parameters to fit their unique goals and risk profiles. This often involves writing code in a programming language supported by backtesting software like Python or Pine Script. Through code, traders can incorporate custom indicators, risk management rules, and slippage models to approximate real-world trading conditions as closely as possible. Luckily, TrendSpider and Finviz allow you to construct powerful backtesting strategies without coding knowledge. If you can code, then TradingView and MetaStock are the most flexible and powerful backtesting software.
Video: Backtesting the HMA Indicator on 960 Years of Data
Developing a Trading Strategy
When developing a trading strategy, traders must establish clear buy and sell criteria, implement solid risk management techniques, and regularly optimize strategy parameters to adapt to changing market conditions.
Criteria for Buy and Sell Decisions
The foundation of any trading strategy hinges on well-defined criteria for entering and exiting trades. Buy signals might be triggered by technical indicators such as a moving average crossover or fundamental events like earnings releases that indicate a company’s growth potential. On the contrary, sell decisions could be predetermined by achieving a target price or a change in market conditions that invalidates the reason for holding the position.
Risk Management Techniques
Risk management is critical to the longevity of a trading strategy. It ensures that traders can survive in the market during unfavorable conditions. Techniques include setting stop-loss orders to limit potential losses, calculating the risk-to-reward ratio for each trade, and diversifying across different asset classes to mitigate sector-specific risks.
Optimization of Strategy Parameters
The success of a trading strategy is often found in its adaptability through optimization. Traders should periodically backtest and analyze their strategy against historical data to adjust parameters such as entry points, exit points, and the size of positions. This fine-tuning process helps traders improve their strategy’s performance and adapt to new market trends or volatility.
Performing the Backtest
Before delving into the specifics of backtesting, it is essential to recognize that the process entails rigorous simulations and scrutiny of profit/loss scenarios to ensure the validity of a trading strategy, all while diligently accounting for various biases that could skew results.
Running Simulations
Simulations serve as the cornerstone of any backtesting procedure. Traders or analysts deploy historical data to test how a particular strategy would have fared. This requires them to construct a virtual trading environment where historical prices trigger buy or sell signals as in real-time trading. Critical parameters are set, including initial capital, transaction costs, and entry and exit timing.
- Initial Capital: The amount allocated at the onset of the simulated trading period.
- Transaction Costs: These are often incorporated to reflect realistic trading conditions.
- Entry/Exit Timing: Precise rules determining when positions are entered and exited.
Analyzing Profit/Loss Scenarios
Once the simulation is complete, profit/loss outcomes analysis is fundamental. This step assesses the strategy’s potential financial performance by calculating net profits, the ratio of winning to losing trades, and the potential drawdowns—peaks to troughs in investment value—during the trading period.
- Net Profit: Total gains minus total losses and expenses.
- Win/Loss Ratio: The frequency of profitable trades relative to unprofitable ones.
- Drawdown: The measure of decline from a historical peak in the capital of the investment strategy.
Try the Best AI-Powered Backtesting with TrendSpider
Overcoming Backtesting Biases
Overcoming biases is imperative for an accurate backtest. Two noteworthy biases include look-ahead bias and survivorship bias. Look-ahead bias happens when a strategy inadvertently utilizes information that would not have been available during the simulated period, thereby inflating its effectiveness. Similarly, survivorship bias can occur if the test only considers stocks or assets that have ‘survived’ until the end of the test period, ignoring those that have dropped out, leading to an overestimation of historical performance.
- Look-Ahead Bias: Using future information in the simulation.
- Survivorship Bias: Excluding assets that failed or delisted during the test period.
Try TradingView, Our Recommended Tool for International Traders
Global Community, Charts, Screening, Analysis, Broker Integration, Financial Metrics, Ratios & Analysis with TradingView

Global Financial Analysis for Free on TradingView
Key Metrics for Evaluating Performance
When backtesting investment strategies, it is crucial to measure and understand a variety of performance metrics. These metrics encompass raw returns and evaluate risk exposure and the sustainability of a strategy under different market conditions.
Understanding Returns and Risk-Adjusted Return
Returns are the most basic performance measure, indicating how much an investment has gained or lost over time. To compare the performance of strategies with different risk levels, one must look at the risk-adjusted return.
- Annualized Return: This metric shows the compound growth rate of an investment’s earnings annually.
- Sharpe Ratio measures the performance of an investment compared to a risk-free asset after adjusting for its risk. It’s calculated as the difference between the investment’s returns and the risk-free rate divided by the investment’s standard deviation of returns.
Significance of Drawdowns and Ratios
Drawdowns reflect an investment’s risk by measuring the largest single drop from peak to trough during a specific period. They provide insight into the potential losses that could occur during a strategy’s implementation.
- Maximum Drawdown: This is a critical metric used to assess a strategy’s risk. It reflects the greatest loss from a high point to a low point before a new peak is achieved and is essential for understanding the strategy’s worst potential outcome.
- Recovery from Drawdown: Beyond the maximum drawdown, it’s important to consider how long a portfolio takes to recover from these drawdowns, as frequent and prolonged recoveries can significantly affect compound growth.
Effect of Volatility on Performance
Volatility is a statistic that represents the degree of variation of trading price series over time, usually measured by the standard deviation of logarithmic returns. High volatility is often equated with a higher degree of risk.
- Standard Deviation: A measure of how much returns change over time, providing a sense of the uncertainty or risk associated with a particular strategy.
- Beta: This measures a stock’s volatility relative to the overall market.
Using these metrics, investors can obtain a quantitative foundation for making informed decisions about the suitability of a trading strategy. A multi-dimensional view of performance, balancing reward with risk, allows for a more robust evaluation of an investment’s prospects.
Common Pitfalls in Backtesting
When backtesting trading strategies, it’s crucial to recognize that certain practices can lead to misleading results. Analysts looking to create robust and reliable strategies should be wary of the following common pitfalls.
Data Mining and Curve Fitting
Data mining occurs when an analyst repeatedly searches historical data to find patterns without a predefined hypothesis. This practice increases the risk of curve fitting, where a strategy appears effective in backtests simply because it is tailor-made to past data but often fails in real-world trading. Overfitting complicates the model with excessive parameters, reducing the strategy’s ability to generalize to new, unseen market conditions. Therefore, a strategy should be based on sound, statistical premises and avoid being over-optimized for historical trends that may not repeat.
Ignoring Transaction Costs
One might underestimate the impact of trading costs on a strategy’s profitability. Backtesting results can be significantly skewed if transaction costs, including commissions, spreads, and slippage, are omitted. They should incorporate all possible trading costs to reflect a strategy’s net profitability accurately. Incorporating these costs into the backtest helps one gauge the realistic performance of a trading strategy, accounting for the costs that inevitably come with each transaction in live market conditions.
Misinterpreting Past Performance
A common misconception is equating past performance with future returns. While backtesting provides a historical perspective, it often omits factors such as market impact, liquidity, and survivorship bias — the tendency to include only successful companies in the analysis while disregarding delisted or failed ones. Analysts should be cautious not to extrapolate past performance metrics without considering these variables and remember that statistical significance and economic rationale are the backbones of a dependable backtest.
Understanding Backtesting Metrics
Backtesting metrics are crucial for evaluating the potential success of a trading strategy. They provide quantitative measures that allow traders to assess performance and risk. Below is an overview of key metrics used in backtesting:
- Alpha: This represents the strategy’s ability to beat the market. It’s the excess return of a portfolio over the benchmark.
- Beta: Beta measures the portfolio’s volatility or risk compared to the market. A beta higher than 1 suggests greater volatility, while less than 1 indicates lower risk.
- CAGR (Compound Annual Growth Rate): CAGR is an investment’s mean annual growth rate over a period longer than one year.
- Reward/Risk Ratio: This ratio shows a trade’s potential return compared to its risk. A higher ratio is often preferable, indicating a better potential return for the risk taken.
- Average Win/Loss: This compares the average winning and losing trades. It helps determine if the strategy makes enough on winning trades to offset losses.
- Expectancy: Expectancy estimates the average profit or loss of a trade. It combines the win/loss ratio with the average win/loss.
- Sharpe Ratio: The Sharpe Ratio indicates risk-adjusted return. It shows how much excess return you receive for the extra volatility endured holding a riskier asset.
- Sortino Ratio: Similar to the Sharpe Ratio, it focuses only on the ‘bad’ volatility. It’s a measure of the risk-adjusted return that considers the downside risk.
Traders must analyze these metrics to gauge a strategy’s effectiveness. Each metric illuminates different risk and return aspects, forming a composite picture of a strategy’s performance. Utilizing them can lead to more informed investment decisions.
Adjusting Strategies Based on Backtesting Insights
Backtesting equips traders with data-driven insights, allowing for the refinement of investment strategies before they’re implemented in live markets. Key adjustments often stem from scenario analysis, risk management through position sizing, and controlling market exposure.
Scenario Analysis and Stress Testing
Scenario Analysis uses historical data to forecast future outcomes based on predefined conditions. Traders apply this to evaluate a strategy’s performance under different market conditions. For instance, they may test how an asset responds to sudden economic downturns or interest rate changes.
Stress Testing involves pushing a strategy to its limits by simulating extreme market trends and movements beyond typical averages. The goal is to understand the strategy’s robustness and potential points of failure, thereby allowing traders to make informed adjustments.
Position Sizing and Exposure
Position Sizing is critical in strategy adjustment, impacting risk management and potential returns. It determines the volume of capital allocated to a particular trade based on the strategy’s success rate and volatility during backtesting. Effective position sizing can help mitigate losses and capitalize on winning trades.
Exposure, or the degree to which a portfolio is affected by market changes, is adjusted according to backtesting insights. If backtesting reveals that a strategy underperforms during volatile market trends, a trader might reduce exposure to high-risk assets, aligning with a more risk-averse profile. Conversely, if a strategy historically captures gains from certain market trends, a trader might increase exposure to these trends to maximize profits.
The Transition from Backtesting to Live Trading
Changing from backtesting to live trading requires careful steps to ensure the viability of your strategy under real-world conditions. This involves understanding the impact of market conditions and incorporating measures to mitigate risks such as slippage.
Paper Trading as a Bridging Step
Paper trading is an essential bridge between backtesting and live trading. It allows traders to test their strategies in the market without financial risk. They simulate trades using real-time data, which helps them understand how their strategy would perform under current market conditions.
Real-time Market Conditions and Slippage
When transitioning to live markets, traders must account for real-time market conditions that can differ significantly from historical data. Slippage—the difference between the expected price of a trade and the actual price at execution—can affect trade outcomes. Traders must consider these factors and adjust their strategies accordingly.
Confirming Strategy Viability in Live Markets
Ultimately, the success of a strategy in live trading will confirm its viability. Traders should monitor performance meticulously and be prepared to make iterative adjustments. A strategy that has worked well in backtesting might require fine-tuning to adapt to the unpredictable nature of live trading conditions.
FAQ
The “Frequently Asked Questions” section addresses common inquiries about stock backtesting, providing clear and detailed answers designed to educate readers about this vital aspect of trading strategy evaluation.
What are the most reliable backtesting softwaree?
The most reliable backtesting software options include platforms such as MetaStock, TradingView, and TrendSpider. These are widely used for their comprehensive features and robust analytics capabilities.
What is the process to effectively backtest a trading strategy?
To effectively backtest a trading strategy, traders must first define the strategy's rules, acquire historical data, and then use backtesting software to simulate trades. This process helps in assessing the strategy's viability without risking actual capital.
How can you perform backtesting for free?
Backtesting can be performed for free using TradingView, which offers a basic free version, or by coding one's backtesting algorithms using open-source tools such as Python's backtrader library.
What are essential metrics to evaluate stock trading performance?
Essential metrics for evaluating stock trading performance include the Sharpe ratio, Sortino ratio, maximum drawdown, and compound annual growth rate (CAGR). These metrics provide insight into the risk-adjusted returns of a trading strategy.
To what extent should backtesting be performed for it to be considered sufficient?
Backtesting should be performed on a sufficiently large and representative sample of historical data that includes bull and bear market. This typically means spanning several years and thousands of trades.
What parameters are critical for a robust backtesting process?
Critical parameters for a robust backtesting process include realistic trading costs, slippage, minimum execution sizes, and accurate historical data. These factors ensure that the backtesting results closely replicate real trading conditions.