The Price/Earnings to Growth (PEG) ratio helps investors find growth at a reasonable price.
☆ Research You Can Trust ☆
My analysis, research, and testing stems from 25 years of trading experience and my Financial Technician Certification with the International Federation of Technical Analysts.
The PEG ratio is an incredibly valuable growth investing metric calculated by dividing the Price-to-Earnings (P/E) ratio by the company’s earnings growth rate. It highlights potential future stock price growth.
Traditional price-to-earnings (P/E) ratios fall short by neglecting a company’s growth potential, which could lead to undervaluing high-growth stocks or overvaluing those with stagnating prospects.
Key Takeaways
- The PEG ratio enhances stock valuation by integrating growth into the equation.
- Unlike the P/E ratio, PEG considers current earnings and future growth potential.
- Applicable across different industries, the PEG ratio adjusts valuation metrics to growth expectations.

An illustrative example of a PEG ratio application might involve a tech company with a high P/E ratio due to anticipations of rapid growth. While a pure valuation by P/E might deem the stock overpriced, adjusting the P/E by its projected earnings growth over a specific period, such as five years, may indicate that the stock is reasonably priced relative to its growth prospects.
The PEG ratio can be calculated and used in different ways, considering differing expected growth rates and accommodating various investor outlooks across industries.
Understanding PEG Ratio
The PEG Ratio combines a stock’s P/E ratio with its forecasted earnings growth rate to assess valuation.
Definition of PEG Ratio
The Price/Earnings to Growth (PEG) Ratio gauges a stock’s valuation by considering its current P/E Ratio relative to its anticipated earnings growth. It presents a more dynamic picture than the P/E ratio alone, as it accounts for the future earnings prospects of a company.
Components of PEG Ratio
Two key components constitute the PEG Ratio:
- P/E Ratio: The Price-to-Earnings (P/E) Ratio measures a company’s current share price relative to its per-share earnings.
- Earnings Growth: This is the expected annual growth rate of a company’s earnings over a specific period, typically forecasted for the next 3-5 years.
By dividing the P/E ratio by the earnings growth rate, investors get the PEG ratio, which ideally should be below 1 to suggest a stock is undervalued considering its growth prospects.
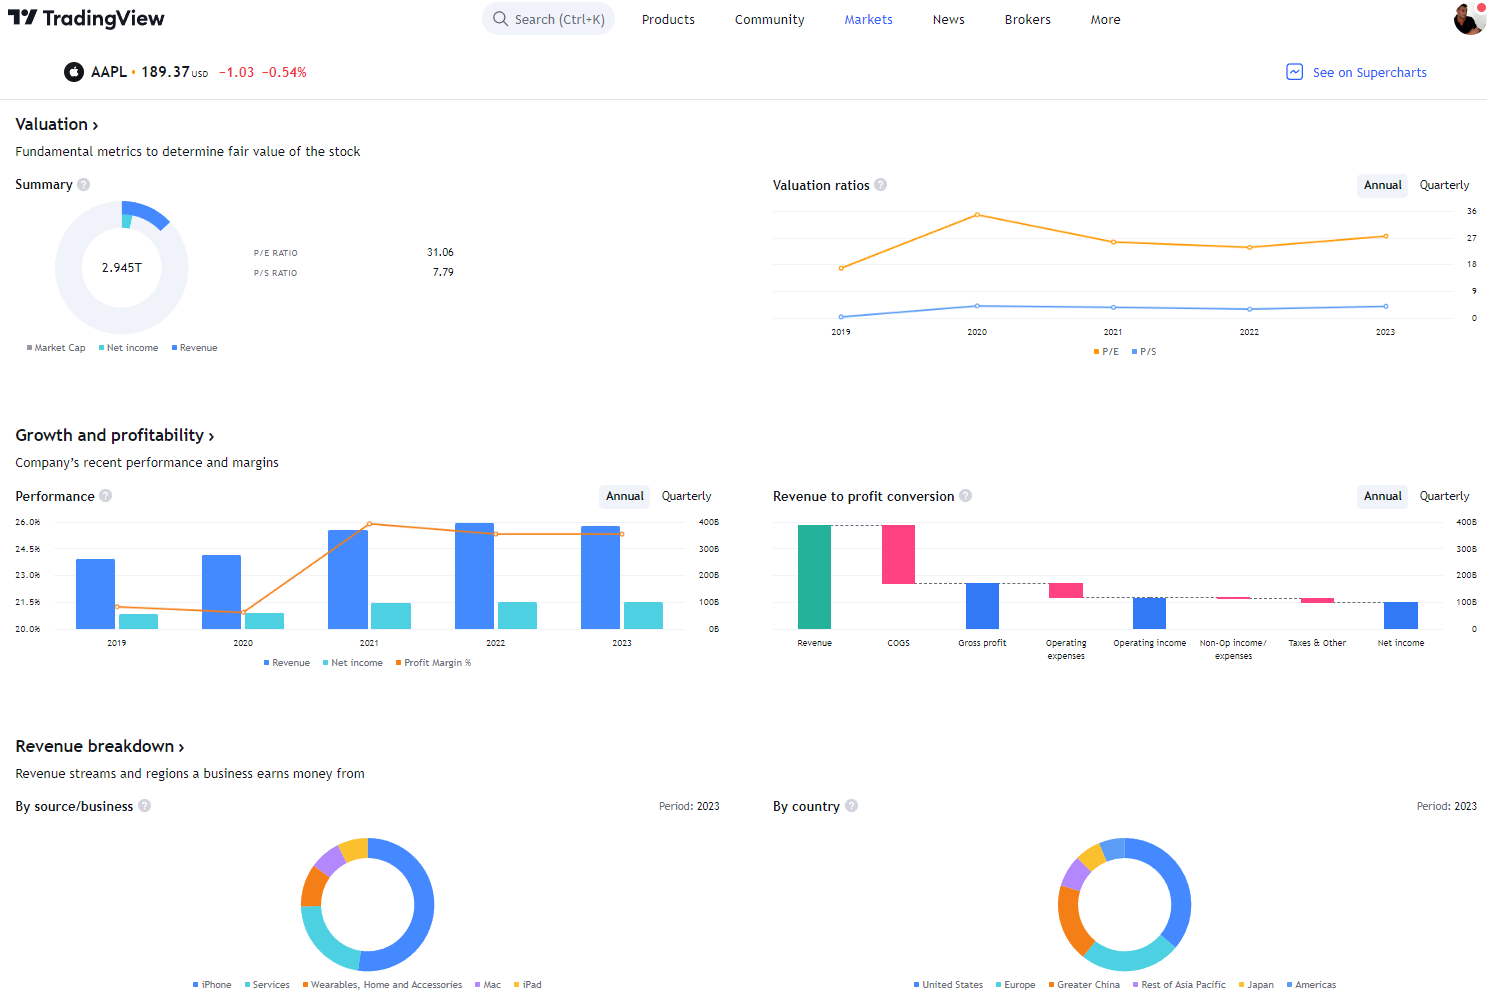
Global Financial Analysis for Free on TradingView
Calculating the PEG Ratio
Understanding the PEG Ratio allows investors to determine a stock’s relative value by considering its earnings growth rate. It’s an enhancement over basic P/E analysis that incorporates future earnings expectations.
PEG Ratio Formula
The PEG Ratio is computed by taking the Price-to-Earnings (P/E) ratio and dividing it by the company’s anticipated earnings growth rate. The basic PEG ratio formula is:
PEG Ratio = (Price per Share / Earnings per Share (EPS)) / Annual EPS Growth Rate
The earnings per share (EPS) figure can be either for the past 12 months (trailing EPS) or for the forecasted next 12 months (forward EPS).
The growth rate is typically an annual figure but can be adapted to match the EPS timeline. It is also possible to use average growth rates over different time frames, like three or five years.
Interpretation of PEG Ratio Values
The resulting PEG Ratio values indicate a stock’s valuation in context with its earnings growth. A PEG Ratio of 1 suggests the stock is fairly valued, a ratio below 1 implies it may be undervalued considering its growth prospects, and a ratio above 1 indicates a potential overvaluation.
However, the PEG Ratio doesn’t operate in isolation. It’s one of many valuation ratios investors might consider, and it’s vital to understand the growth estimate may not always be reliable, as future growth can change due to various market conditions. Interpretation should also consider sector norms, as differing industries can have varying standard PEG values.
PEG Ratio in Valuation
The PEG Ratio is a refined tool that builds upon the P/E ratio by introducing earnings growth into the valuation analysis, offering a more dynamic insight into stock valuation.
Comparison with P/E Ratio
The Price/Earnings (P/E) ratio is a snapshot of where a stock trades relative to its earnings per share (EPS), but it does not account for the company’s projected growth. The PEG ratio modifies this by dividing the P/E ratio by the earnings growth rate, thus adding a critical dimension of future expectations to valuation. This way, if two stocks have the same P/E ratio but different growth rates, the PEG ratio can provide a clearer comparison, indicating which may be undervalued or overvalued.
For example, a company with a P/E ratio of 15 and an expected annual earnings growth of 10% would have a PEG ratio of 1.5 (15/10). In contrast, another company with the same P/E ratio but a growth rate of 5% would have a PEG ratio of 3 (15/5), suggesting it may be overvalued relative to its growth or, conversely, that the first stock may be undervalued or more attractively priced.
Using PEG to Identify Stock Value
Investors utilize the PEG ratio to discern the value of a stock by comparing valuation ratios against growth rates. A PEG ratio of 1 is traditionally considered the benchmark, signifying a balance between the market value and growth prospects. A PEG ratio under 1 might hint at a stock being undervalued, given its earnings growth, while a higher PEG can indicate the possibility of an overvalued stock.
A company forecasted to grow at 15% with a P/E ratio of 30 would have a PEG of 2 (30/15), potentially implying that the stock’s price is at a discount to its growth rate. While PEG can help spot stocks that may be fairly valued, it is essential to consider that it is just one of several valuation ratios. Other factors, such as market conditions, sector performance, and the company’s financial health, must also be weighed.
Financial Analysis with PEG Ratio
The PEG Ratio is a nuanced metric that allows a more dimensional view of company valuation by considering earnings growth alongside traditional price-to-earnings assessment.
Earnings Growth and PEG
When investors look at the Price/Earnings-to-Growth (PEG) Ratio, they see a tool that combines the price-to-earnings (P/E) ratio with the earnings growth rate to understand how a stock’s valuation compares with its industry peers. Specifically, this ratio measures the relationship between the price of a stock, its current earnings per share (EPS), and the earnings growth prospects. A lower PEG ratio may suggest that a stock is undervalued based on its projected growth, while a higher ratio could indicate potential overvaluation.
- Formula: PEG Ratio = (Price/Earnings Ratio) / Annual EPS Growth
Analyzing Future Growth with PEG
The PEG ratio’s insight into future growth makes it a valuable tool for investors. By forecasting the earnings growth rate, investors can estimate how a company’s profitability may increase over time, which could influence the stock’s future market price. Analysts typically use various methods—from historical data to industry trends—to determine a reasonable forecast for earnings growth, often looking one to three years into the future. Considering these forecasts, the PEG ratio provides a clearer picture of a stock’s potential, helping investors make more informed decisions.
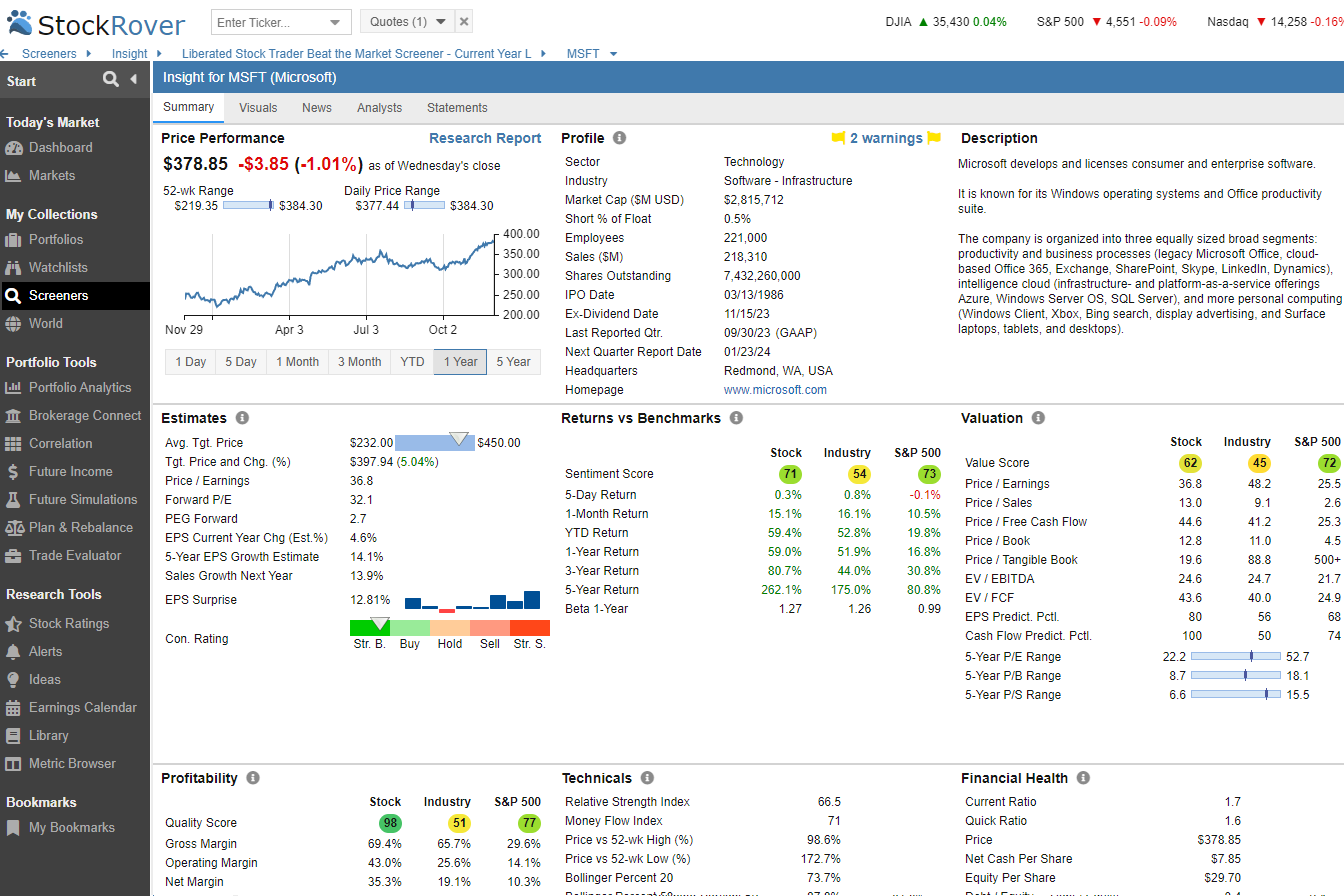
Try Powerful Financial Analysis & Research with Stock Rover
PEG Ratio in Different Industries
The PEG Ratio is widely used across different industries to compare entities with diverse growth rates and earnings, facilitating a more nuanced approach to valuation.
Industry-Specific Benchmarks
In every industry, the PEG ratio serves as a key indicator of value, considering not just the price and earnings but also the expected earnings per share growth. For instance, technology companies often boast high growth rates, leading to a different benchmark for a healthy PEG ratio than utility companies, which typically have more stable but lower growth rates.
- Technology: High growth rate; PEG ratio benchmarks may be higher.
- Utilities: Stable earnings growth; PEG ratios are often lower, indicating less volatile expectations.
Cross-industry comparisons of PEG ratios reflect the differing stages of growth and risk profiles inherent to individual sectors. Technology may have a higher PEG ratio norm, reflecting investors’ willingness to pay a premium for growth. Conversely, consumer staples might exhibit lower PEG ratios, aligning with their more predictable growth.
Cross-Industry Comparisons
When assessing valuation, the PEG ratio is instrumental as it adjusts for growth, providing a more equitable cross-industry comparison. It’s insufficient to compare just the P/E ratios of a fast-growing telecommunications company and a slow-growing industrial entity due to the vast differences in their respective earnings growth rates.
- Fast-growing Industries: Higher expected growth can justify higher PEG ratios.
- Mature Industries: Typically have lower PEG ratios, reflecting slower growth expectations.
Investors must consider that a low PEG ratio in a high-growth industry could signal undervaluation. In contrast, the same low PEG in a mature industry might reflect market expectations for modest growth.
Investor with the PEG Ratio
Investors often assess the PEG Ratio to determine a stock’s value relative to its growth expectations. The metric provides a more nuanced view of a company’s worth by considering future earnings in relation to current earnings and share price.
Investment Decisions Based on PEG
Investing based on the PEG ratio contrasts with the traditional P/E ratio by adding the dimension of growth rate. A lower PEG ratio may indicate a stock is undervalued, given its earnings prospects. Investors are attracted to stocks with a PEG ratio of less than 1, which suggests a company is undervalued relative to its expected earnings growth.
For instance, if Company A has a P/E ratio of 15 and a projected earnings growth rate of 20% per year, its PEG ratio is 0.75 (15 P/E divided by 20% growth). On the other hand, Company B, with a P/E ratio of 30 and the same earnings growth rate, will have a PEG ratio of 1.5, which might be seen as overvalued.
Another dimension that investors take into account is the timeframe. The growth rate considered can be past growth, extrapolations of past growth, or forward (future) growth estimates, which often consider analyst expectations. These considerations influence an investor’s assessment of an investment’s risk and potential return.
Our original trading research is powered by TrendSpider. As a certified market analyst, I use its state-of-the-art AI automation to recognize and test chart patterns and indicators for reliability and profitability.
✔ AI-Powered Automated Chart Analysis: Turns data into tradable insights.
✔ Point-and-Click Backtesting: Tests any indicator, pattern, or strategy in seconds.
✔ Never Miss an Opportunity: Turn backtested strategies into auto-trading bots.
Don't guess if your trading strategy works; know it with TrendSpider.
Understanding Analysts’ PEG Estimates
Analysts play a crucial role in calculating PEG ratios as they estimate earnings growth rates. They often use historical data, industry trends, and the broader economic outlook to estimate a company’s future earnings. The reliability of an analyst’s estimate can significantly impact an investor’s perception of a stock’s potential value.
For example, if most analysts foresee a technology company gaining market share in the next few years, their growth rate forecast might be higher. An investor examining this company’s PEG ratio may find it attractive if the price-earnings ratio is moderate compared to that high growth forecast. However, investors know that analyst predictions are not always accurate and include this in their risk assessment.
By scrutinizing the PEG ratio through the lens of analysts’ estimates, investors gain a clearer picture of whether current stock prices align with future earnings potential. A thorough investor will consider the consensus among analysts’ estimates to mitigate the risks of relying on overly optimistic or cautious projections.
Limitations of PEG Ratio
While the PEG ratio is a popular measure of value that adjusts the price-to-earnings (P/E) ratio for future expected growth, it carries several limitations. These must be considered to avoid relying on this metric alone when making investment decisions.
Common Criticisms
Reliance on Earnings Expectations: The PEG ratio depends heavily on the assumption that the analyst’s or company’s projected earnings growth is accurate. However, future expected growth is inherently uncertain, and if these predictions are off, the PEG ratio can be misleading.
Growth Consistency Over Time: It presumes that the company will grow steadily, which is seldom the case in dynamic markets. Companies often experience periods of rapid growth and slowdowns, which the PEG ratio cannot account for, potentially making the measure less reliable over the long term.
Contextual Use of PEG
Sector and Size Sensitivity: The ratio may not apply across different industries, as each sector has inherent growth rates that can skew the PEG comparison. For instance, a technology company typically grows faster than a utility company, making cross-sector PEG comparisons challenging.
Stages of Company Growth: A company’s life cycle stage can also affect the PEG ratio’s usefulness. For newer, high-growth companies, the PEG ratio might underestimate value as earnings could surge. In contrast, for mature companies with stable but slow growth, the PEG ratio might overvalue the stock since future growth potential is limited.
Advanced PEG Ratio Concepts
In evaluating stock investments, advanced PEG Ratio concepts assist investors in gaining a more nuanced understanding of a company’s growth relative to its earnings. Such analysis often requires comparing forward-looking projections with historical performance.
Forward PEG vs. Trailing PEG
Forward PEG looks into the future, evaluating a stock’s price-to-earnings ratio against its projected earnings growth. It considers analysts’ expectations for a company’s future earnings per share (EPS) rather than just past results. This forward-looking measure can give investors a sense of how the market values a company’s expected growth.
In contrast, Trailing PEG relies on historical data. It calculates the ratio using a company’s past earnings growth, grounding the assessment in actual performance rather than forecasts. Based on known, reported figures for EPS growth, trailing PEG may be considered more concrete.
Both types of PEG ratios require investors to consider the accuracy of earnings forecasts or the reliability of historical growth rates when evaluating stocks. Choosing between the two often depends on an investor’s confidence in the company’s prospects versus its established track record.
The Role of Dividends and Interest Rates
Dividends are crucial for PEG ratio considerations, particularly for investors seeking cash returns on their investments. Dividends paid out to shareholders can significantly affect a company’s cash flow, thus impacting the funds available for internal reinvestment and capital expenditures. A company paying high dividends might have lower growth rates, influencing the PEG ratio and the investor’s perception of a stock’s value.
Interest Rates are another external factor that can influence the PEG ratio. Rising interest rates, for instance, generally make borrowing more expensive, reducing a company’s ability to finance growth through debt. Simultaneously, higher rates can lead to increased cost of capital, potentially dampening expectations for future earnings growth. These dynamics should be carefully weighed, as they can distort a stock’s attractiveness when viewed through the PEG ratio lens.
Both dividends and interest rates need to be factored in when calculating a PEG ratio to accurately represent a company’s growth prospects in relation to its price. They can bridge the gap between raw numbers and the real financial environment in which a company operates.
Case Studies and Examples
In this section, we dissect the practical application of the PEG Ratio in evaluating stocks, showcasing real-life scenarios and strategic insights that can guide investors’ decisions.
Application in Real-World Scenarios
The PEG ratio serves as a nuanced indicator in stock valuation, contextualizing the Price/Earnings (P/E) ratio with the company’s historical growth rates. For instance, a technology firm may boast a steep P/E ratio due to expected market expansion. By examining the PEG ratio, which incorporates projected earnings growth, investors gain insight into whether the high P/E is justified.
Consider a company with a P/E of 30 and an anticipated earnings growth rate of 15%. The PEG ratio would be 2 (30/15), suggesting that the stock may be overvalued if we assume a PEG value of 1 indicates a fair trade-off between price and growth prospects. Conversely, a PEG ratio below 1 often flags an undervalued stock, presuming the growth estimates are reliable.
Strategic Considerations for Investors
When investors scrutinize the PEG ratio, they should consider current earnings and the reliability of growth forecasts. A low PEG based on overly optimistic projected earnings growth can mislead. Thus, it’s essential to assess the credibility of the projections.
Historical performance is also telling. A company with proven historical growth resilience may warrant a higher level of confidence in its forward-looking statements. For example, an established pharmaceutical company has historically grown earnings by 10% annually. If analysts project a similar rate for the future, and the company’s forward P/E is 20, the PEG ratio would be 2. Unless industry-specific factors suggest otherwise, this would typically doubt the stock’s growth-justified valuation.
In comparing stocks, investors should consider the PEG ratio as one of several tools that ensure a holistic approach to valuation, including an analysis of market conditions, competitor growth rates, and individual business models.
Adaptation by Famous Investors
Some of the world’s most acclaimed investors have adopted and tailored various investment metrics, with the PEG ratio as a significant example. The PEG ratio combines a stock’s price-to-earnings (P/E) ratio with its earnings growth rate to provide a more nuanced valuation measure. Among such investors, Peter Lynch is notably recognized for his approach to this financial tool.
Peter Lynch’s Approach to PEG
Peter Lynch, the renowned former manager of the Magellan Fund at Fidelity Investments, popularized the PEG ratio to identify stocks that might be undervalued or overvalued. He sought companies whose PEG ratio was below 1, indicating that the stock price was favorable relative to the company’s earnings growth.
- Favorable PEG: When Lynch identified a PEG ratio of less than 1, he considered the stock potentially undervalued, assuming the earnings growth estimates were reliable. He reasoned that a lower PEG ratio signified an investor paid less for each unit of future earnings growth. This could lead to better investment returns if the projected earnings growth materialized.
- Unfavorable PEG: Conversely, a PEG ratio above 1 might suggest the stock was overvalued, as the price-earnings were high relative to their growth rates. Lynch was cautious with stocks showing such characteristics, often believing they posed higher risks for investors.
- Negative PEG: In cases where the future earnings growth was expected to be negative, the conventional PEG ratio might not apply or be meaningful. Lynch would typically avoid stocks with negative growth prospects since they did not align with his investment philosophy, which was focused on growth at a reasonable price.
Lynch’s approach to the PEG ratio has inspired countless investors to seek stocks that may offer sustainable growth at a price that appears rational and justifiable when considering the company’s future potential. By incorporating this strategy, investors aim to make informed decisions that balance the risk of overpaying for a stock against the potential for robust financial performance.
The Future of PEG Ratio
The PEG Ratio will continue to evolve and adapt to market changes. It holds a significant place in investment analysis for estimating the fair market value of a stock, factoring in its anticipated earnings growth.
Evolution of Valuation Techniques
Valuation techniques adjust over time as analysts seek more accurate methods to estimate a company’s intrinsic value. The PEG ratio, being a dynamic valuation tool, reflects not just the current earnings of a company but also incorporates expected growth rates. In assessing the future utility of the PEG ratio, one can expect further refinement to better account for variables like company type and sector-specific growth patterns. Analysts may start integrating more nuanced fiscal data and forward-looking statements from management, improving the precision of future growth forecasts.
Companies will continue to be categorized by their growth patterns, with the PEG ratio serving as an essential barometer for growth stock analysis. As fiscal years ebb and flow, the PEG ratio adapts, considering historical and projected earnings to maintain its relevance in ever-evolving markets.
Impact of Market Changes
Market dynamics have a profound impact on valuation metrics. The PEG ratio’s flexibility allows it to remain pertinent in a fluctuating economy by accounting for changing growth rates. For instance, during market downturns, investors might place a premium on stocks demonstrating resilient growth, underpinning the importance of a tool that can discern these qualities.
Furthermore, as the market’s appetite for risk fluctuates, the PEG ratio allows investors to compare market value relative to forecasted earnings growth, thus aiding in distinguishing between overvalued and undervalued stocks. It’s reasonable to expect that the PEG ratio will continue to be tailored to better suit industry-specific fiscal cycles and market conditions, granting analysts a more robust framework for investment decisions.
FAQ
This section aims to clarify common queries regarding the PEG ratio with brief examples to aid understanding.
How is the PEG ratio calculated?
The Price/Earnings to Growth (PEG) ratio is calculated by taking the Price-to-Earnings (P/E) ratio of a stock and dividing it by the annual earnings per share (EPS) growth rate. For a detailed example, consider a company with a P/E ratio of 15 and an expected annual EPS growth of 10%. The PEG ratio would be PEG = P/E ÷ Annual EPS Growth = 15 ÷ 10% = 1.5. This suggests the stock is valued at 1.5 times its earnings growth rate.
What does a PEG ratio of less than 1 mean?
A PEG ratio less than 1 potentially indicates that a stock might be undervalued relative to its earnings growth rate. It suggests that the stock's price has not kept pace with its expected earnings growth, which could attract investors looking for growth at a reasonable price.
What does a negative PEG ratio signify?
A negative PEG ratio results when a company has a negative earnings growth rate, which implies that the company's earnings are expected to decrease. For example, if a company has a P/E ratio of 20 but its earnings are projected to decline at -5% per year, its PEG ratio would be -4. This could be a warning sign for investors that the company's future earnings potential is in question.
What is a 'good' PEG ratio for growth stocks?
When determining whether a PEG ratio is 'good' for growth stocks, investors should consider industry standards. Generally, a PEG ratio around 1 might indicate fair value, but this can vary widely based on the context, and future growth expectations must be realistic and well-founded.
How to calculate the 5-year earnings growth rate to determine the PEG ratio?
The 5-year earnings growth rate can be calculated by analyzing the compound annual growth rate (CAGR) of a company's earnings over the past 5 years. This involves taking the fifth root (if annual data is used) of the end value of earnings divided by the beginning value and subtracting one. Investors then express this figure as a percentage. This rate can then calculate the PEG ratio, comparing long-term growth expectations to the current valuation.
In what way does a high P/E ratio affect a stock’s PEG ratio?
A high P/E ratio can indicate that a stock is potentially overvalued in the market unless a correspondingly high growth rate justifies it. When assessing a stock's PEG ratio, a high P/E ratio diminishes its attractiveness if the earnings growth rate doesn't provide a favorable balance. Generally, a high P/E ratio necessitates a high growth rate to maintain a low and desirable PEG ratio.


