A rectangle is a technical analysis stock chart pattern in which stock prices fluctuate between horizontal support and resistance levels. Traders should look for this pattern because it signals a clear breakout or breakdown in asset price.
Decades of trading research show the rectangle pattern has an 85% success rate in bull markets and an average profit potential of +50%.
Most traders do not realize this pattern is reliable, occurs frequently, and generates a stellar win probability.
I will show you how to automatically identify and trade the rectangle pattern to improve your trading results.
Auto-detect Chart Patterns with TradingView
What Is a Rectangle Chart Pattern?
A rectangle is a well-established technical analysis pattern with a predictive accuracy of 85%. The pattern is flexible, can break out up or down, and is a continuation or reversal pattern. A rectangle can be bearish or bullish, depending on the direction of the price breakout.
This pattern is also known as “rectangle consolidation,” “box,” and “rectangular formation.”
The rectangle chart pattern usually develops after a strong price move, forming a period of consolidation or rest. It can also form after a range-bound market or during a period of low volatility.
Research Highlights
- The rectangle has two horizontal lines: a support line connecting the lows and a resistance line connecting the highs.
- If the price breaks out of the rectangle in the direction of the previous trend, it is a continuation pattern.
- If the price breaks out of the rectangle in the opposite direction of the previous trend, it is a reversal pattern.
- A rectangle occurring during a price uptrend, with a price breakout above the resistance line, is considered a bullish continuation pattern. (See chart below)
- Conversely, a rectangle occurring during a price downtrend, with the price breaking above the resistance line, is considered a reversal pattern.
How to Identify a Rectangle Pattern?
The rectangle chart pattern can be identified by looking for two horizontal parallel lines that act as support and resistance levels. The support and resistance levels are usually drawn horizontally, connecting the price highs and price lows.
These two lines should be relatively equal in length, with at least two touches on each side of the parallel lines before a breakout.
Look for horizontal support and resistance lines to identify a rectangle chart pattern. The pattern should be visible on an intraday and daily chart, but rectangles occur more frequently on 15-minute and hourly charts.

Find This Pattern with TradingView
After identifying the rectangle, look for a trend confirmation by watching for a breakout either up or down out of the rectangle. If the security price breaks out above the rectangle resistance, especially with volume increases, it signals a potential 85% chance of going higher. The Amazon Inc. (AMZN) chart above shows a bearish reversal rectangle as the price breaks lower.
Bullish Rectangle
A bullish rectangle usually forms after a strong price increase. It is known as a “rectangle top” because it appears at the top of the uptrend. The bullish rectangle is confirmed when the price breaks out of it upwards.
The bullish rectangle chart below has been autodetected using TradingView’s pattern recognition algorithms. Notice how the target price is automatically calculated.

Auto-detect this Chart Pattern with TradingView
Bearish Rectangle
A bearish rectangle forming after a price decrease is known as a “rectangle bottom” because it appears at the bottom of the downtrend. The bearish rectangle is confirmed when the price breaks out of it downwards through the support line.

This rectangle pattern has been autodetected using TradingView’s powerful pattern recognition algorithms.
What the Rectangle Indicates
The psychology behind the rectangle pattern indicates traders who initiated long positions at the start of the uptrend are losing confidence and are exiting their positions, resulting in a sideways movement. This can also occur when neither buyers nor sellers have an advantage. However, once one side gains control over the other and the price breaks out of the range, it signifies strength in one direction. A downward breakout of the rectangle means sellers have gained control and are pushing the price down.
This pattern typically appears in strongly trending markets, where the bulls (buyers) and bears (sellers) battle each other until, eventually, one side gains more strength.
How Reliable is a Rectangle Pattern?
A rectangle chart pattern has an 85% success rate on an upside breakout, achieving an average 51% profit in a bull market. If the price breaks downwards, the move is 76% successful, with an average price decrease of -16%.
| Chart Pattern | Success Rate | Average Price Change |
| Rectangle Upward Breakout | 85% | +51% |
| Rectangle Downward Breakout | 76% | -16% |
Source Research Courtesy of Tom Bulkowski@The PatternSite.com
The rectangle chart pattern is considered a reliable continuation or reversal point in the market, with an 85% success rate on an upward breakout in bull markets. This is because buyers begin to take control of the market when the price breaks above the rectangle.
Trading a Rectangle
When trading a rectangle chart pattern, be prepared to trade in the direction of the price breakout. Generally speaking, waiting for at least three consecutive candles before entering the trade is important.
When trading this chart pattern, it is important to set your stop loss inside the rectangle pattern and adjust your target level based on the size of the breakdown. You can expect a target of 50% up to 100% of the distance from the entry point to the rectangle resistance line.

TradingView 4.8/5⭐ : The Best Trading Platform I’ve Tested in 20+ Years
With lightning-fast charts, powerful pattern recognition, smart screening, backtesting, and a global community of 20+ million traders — it’s a powerful edge in today’s markets.

If you want one platform that gives you an edge, this is it.
Traders should pay attention to volume when trading a rectangle chart pattern. Higher volume on the upward breakout is often considered a trend confirmation. This means traders should be vigilant and wait for higher volumes before entering a trade on any breakout situation.
Entry and Exit Points
The entry point for a rectangle pattern is at the price breakout of the rectangle, either up or down. Traders should place a stop-loss order below or above the breakout to protect against potential losses. The exit point can be determined by placing an initial target at 50% of the rectangle’s height. (See Chart Above)
It is also important to remember that rectangles can fail at a rate of 15%, and traders should always have an exit strategy in case of a failed pattern. Furthermore, managing risk during any trade is essential, as the potential for loss is still real. Using proper risk management techniques, traders can maximize profits while limiting losses.
Timeframe
Rectangles can form in any timeframe but occur more frequently in hourly charts. Clean rectangles are often found on intraday charts and 15– or 60-minute time frames, making them a great pattern for day traders.
A rectangle pattern can take months to form on a daily time frame. Traders should monitor the stock over a medium-term period on an hourly or daily chart and be prepared to enter at any time to maximize potential profits.
The chart above shows two rectangle patterns for Alphabet Inc. (Ticker: GOOG). The first rectangle took 12 months to complete and reached its target. The second rectangle took two months and failed to meet its target. The longer the timeframe of the rectangle, the better the chance of success.
It is important to consider volume as an additional indicator when attempting to identify and trade the rectangle pattern.
What Happens After a Rectangle Pattern?
Two decades of research by Tom Bulkowski show that after a rectangle pattern is confirmed on a break of either the resistance line, there is an 85% probability of a 51% price increase.
Once the rectangle pattern is confirmed, traders should consider opening a long or short position depending on the direction of the price move.
What Happens with a Failed Rectangle Pattern?
A rectangle pattern fails 15% of the time in a bull market. When a rectangle pattern fails, the stock price fails to achieve the price target or reverses after a move. At this point, it makes sense to discard the pattern.
A Rectangle Pattern in an Uptrend
The rectangle often forms within an existing uptrend in a bull market. This is usually a sign of strength and often results in the continuation of the uptrend. Traders should be aware that this pattern may provide false signals, as it does not guarantee that the trend will continue, and prices could reverse at any time.
How to Measure a Rectangle & Set a Price Target.
If the distance from the rectangle peak to the horizontal support is 10%, the logical price target should be 10% above the breakout. It is calculated by adding the pattern’s height to the breakout point. This gives traders a good indication of where to expect prices to move following a successful breakout. Once the rectangle breakout is confirmed, traders should set their stop-loss order just below the breakout zone.
In the chart above, you can see the height/depth of the rectangle is equal to the price target.
How to Automatically Identify Rectangles
You can automatically identify rectangle patterns using TradingView. Go to TradingView and click Indicators > Technicals > Patterns. Next, select Rectangle Chart Pattern. Now, a chart with a rectangle pattern will be marked.

Auto-detect this Chart Pattern with TradingView
Rectangles Rules?
- The rectangle pattern can appear anytime during bull or bear markets.
- There must be four distinct touches on the inside of the rectangle.
- The support line should be horizontal with almost equal low price points.
- Price can break out higher or lower.
- When trading with rectangle patterns, traders should set their stop loss below/above the breakout line.
Rectangle Pattern Scanners
There are currently two trading platforms offering rectangle scanning and screening. TrendSpider and FinViz enable complete market scanning for rectangles. Finviz is a good free pattern scanner, whereas TrendSpider enables full backtesting, scanning, and strategy testing for chart patterns.
TrendSpider Rectangle Scanning in Action
Scanning for rectangle patterns with TrendSpider is easy. Visit TrendSpider, select Market Scanner > All of the Following >Chart Pattern > Channel Horizontal > Scan. You will be presented with a list of stocks with rectangle patterns.
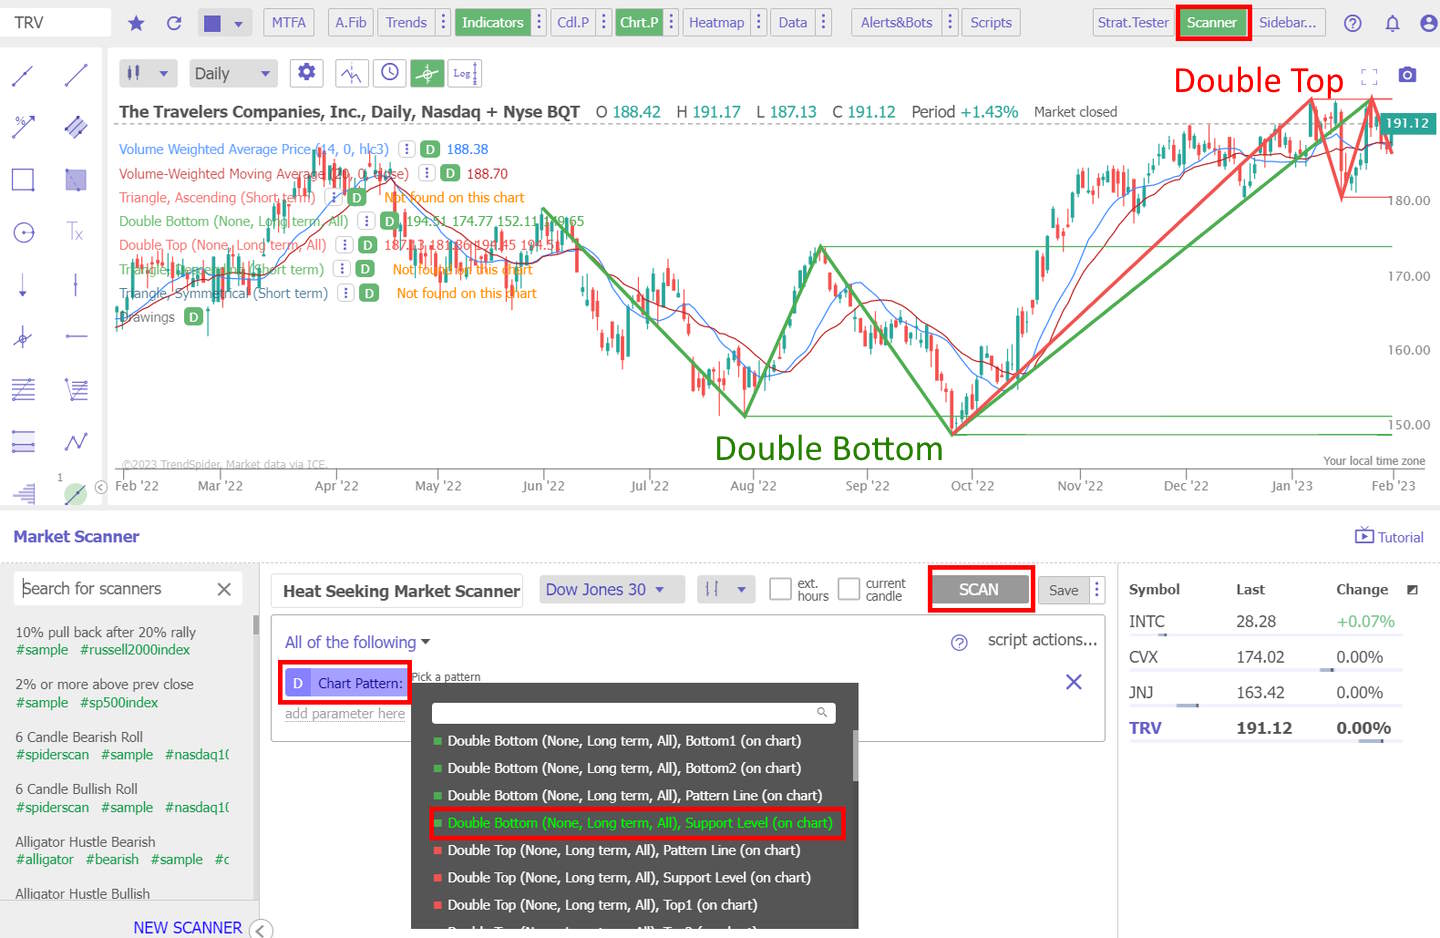
Scan for this Chart Pattern with TrendSpider
Using AI-Driven Rectangle Pattern Detection
One of the major benefits of using AI-driven technical analysis tools like TrendSpider is the ability to backtest historical data. This allows traders to compare the performance of their strategy over different periods and markets. With TrendSpider, you can go back in time to find stocks exhibiting rectangle patterns and then use the platform’s advanced analytics tools to analyze how effective this pattern was for trading at any given time. TrendSpider’s AI-driven algorithms also help traders identify the most reliable entry and exit points for rectangle patterns.
With features such as automated alerts, backtesting, and real-time market data, you can quickly spot and take advantage of rectangle patterns as they emerge.
Find Rectangle Pattern Stocks with Finviz
FinViz has a great feature for scanning for rectangle patterns. You can easily find stocks exhibiting this pattern by selecting a rectangle as your scan criteria. This is especially useful to traders who want to monitor potential trading opportunities.
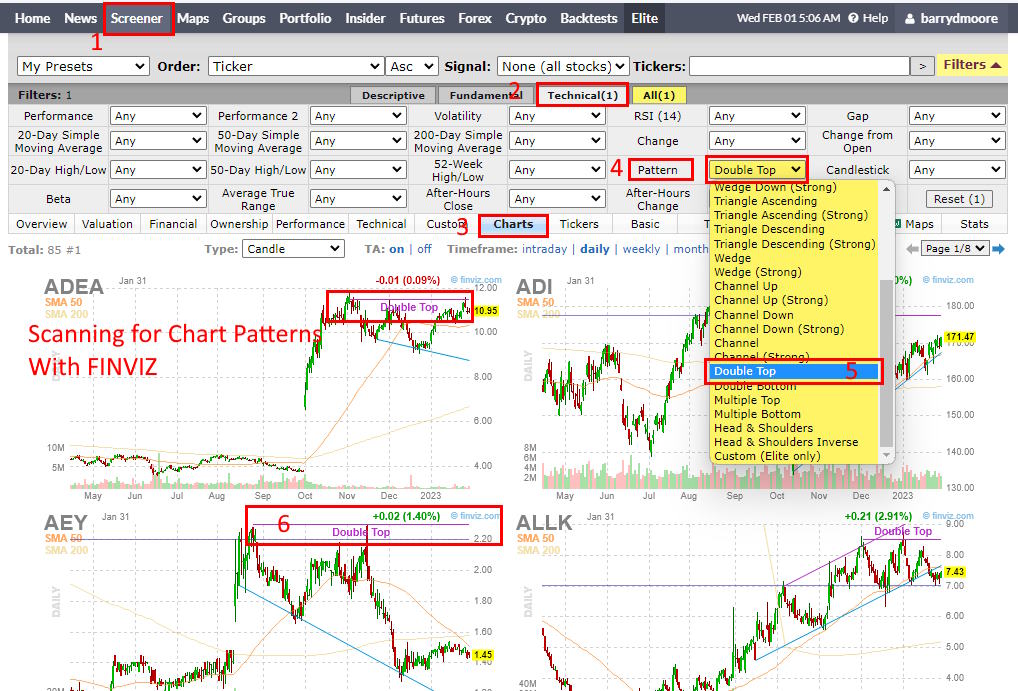
Scan for this Chart Pattern with FinViz
The first step to finding stocks with potential rectangle patterns is to select a set of criteria. FinViz offers a range of pre-defined filters and sorting options, enabling traders to quickly narrow their search by sector, industry, market capitalization, and more. After selecting the desired criteria, traders can apply the filter to the Finviz screener.
Once the filter has been applied, traders can then view the results on a chart interface. Depending on the complexity of their search criteria, several stocks may meet the criteria and appear to have potential rectangle patterns. By clicking on each stock name, traders can open up a chart.
FAQ
How accurate is a rectangle pattern?
Rectangle patterns are 85 percent accurate on an upward breakout in a bull market. If the pattern breaks down through support, it is 76 percent successful.
Why is a rectangle bearish?
A rectangle is bearish when it occurs in a bear market during a price downtrend. In this case, the pattern acts as a continuation pattern. When formed in an uptrend during a bull market, it can be either bullish or bearish, resulting in a reversal or continuation of the trend. It all depends on how the stock responds when the price reaches support.
Can a rectangle be bullish?
Yes, a rectangle can be bullish. When formed in an uptrend during a bull market, it can result in either a reversal or continuation of the trend. To determine which way the price will go, traders should watch how the stock responds when it reaches support and breaks out above or below the rectangle.
Is a rectangle pattern good or bad?
A rectangle is neither good nor bad; it depends on the context. When a rectangle is formed during a bear market, it typically signals a continuation of the downtrend. It usually signals a continuation if it is formed in an uptrend during a bull market. Traders should watch how the stock responds when it reaches support and breaks out above or below the rectangle to determine whether they should enter long or short positions.
What is the success rate of a rectangle?
According to Tom Bulkowski's research, the success rate of a rectangle is an 85 percent chance of a 51 percent price increase in a bull market on a continuation of an uptrend. Traders should remember that there is still a 15 percent false signal risk associated with this strategy.
How do you target a stop loss in rectangle patterns?
Traders should set the approximate target stop loss level in a rectangle at the point above or below the breakout of the rectangle. The exact percentage stop loss depends on the price target expectations and the timeframe.
What are the benefits of trading rectangles?
The primary benefit of trading rectangles is the high success rate for a price move. Additionally, traders can easily identify and measure their trade's risk/reward ratio. Rectangles also help to reduce emotion from trading decisions by creating clear entry and exit points.
What are the risks of trading a rectangle?
The biggest risk of trading a rectangle is that the price may not break out in the direction predicted. This could result in losses if an incorrect position is taken and insufficient stop-loss orders are placed.
Can a rectangle fail?
Rectangles fail approximately 15% of the time during a bull market. Therefore, it's important to understand the risks associated with this strategy. Always use stop losses and take profits when trading patterns to minimize risk and maximize profit potential.
How reliable is a rectangle pattern?
The rectangle pattern is a reliable chart indicator, with success rates of 85 percent during a bull market on an upward breakout. During a bear market in an uptrend price, rectangles are much less reliable.
Do rectangles hold?
Yes, rectangle patterns hold 85 percent of the time, according to decades of research compiled by Tom Bulkowski in his book The Encyclopedia of chart patterns.
How to identify rectangles?
Rectangle patterns can be identified automatically with TradingView or TrendSpider. Alternatively, you can manually identify it by looking for two horizontal trendlines acting as support and resistance that form over weeks.
How to measure a rectangle pattern?
TradingView can automatically measure a rectangle pattern to set a price target. Alternatively, to measure manually, use an arithmetic chart and plot the distance between the rectangle's support and resistance lines. This distance will be the future price target which you should annotate on the chart in the direction of the breakout.
What is the success rate of the bullish rectangle pattern?
According to published research, the bullish rectangle pattern has an 85% success rate on an upward price breakout. With a perfect trade, the average price increase is 51%.
What is the strongest bullish pattern?
The most bullish pattern is the inverse head and shoulders bottom. In a bull market, this pattern has an 89 percent success rate with an average price increase of 45 percent.
What is a bearish rectangle?
A bearish rectangle is a chart pattern in which the upper and lower boundaries of price action form two parallel lines. If the price breaks down through the support line, this completes the bearish rectangle, which has a 75% chance of a price decrease of 16%.
What is a rectangle top pattern?
A rectangular top pattern occurs at the apex of a price uptrend. The pattern forms when there has been a significant price increase, and investors are consolidating their gains. Thus, the price appears to consolidate and move sideways.
What is a rectangle bottom pattern?
A rectangle bottom pattern is a consolidation of prices occurring at the bottom of a downtrend. The pattern forms when there has been a significant price decrease, and buyers start to see value in the stock at these lower prices, thus halting the downtrend. Thus, the price begins to move sideways.
Is a rectangle a continuation or reversal pattern?
Contrary to popular belief, a rectangle is both a continuation and a reversal pattern. If the price breaks out of the rectangle in the direction of the previous trend, it is a continuation pattern. If the price breaks out of the rectangle in the opposite direction of the previous trend, it is a reversal pattern.
What are the best rectangle pattern scanners?
The best rectangle pattern scanners are TrendSpider and Finviz. TrendSpider enables rectangle scanning, backtesting, and strategy development. Finviz enables quick and easy rectangle scanning and charting.
Learn the Success Rates of 65 Chart Patterns
The Encyclopedia of Chart Patterns by Tom Bulkowski details the reliability and success rates of 65 chart patterns and shows you how to trade them. It is an indispensable resource for traders and investors seeking to enhance their profitability by leveraging stock chart patterns. This comprehensive reference book provides in-depth explanations and detailed illustrations of over 65 different patterns, including Head and Shoulders, Double Tops, Wedges, Flags, Gaps, and more.
