Why does price slam the brakes at some levels and slice like butter through others?
Volume Profile maps where trading actually happened—plotting volume at each price to reveal the Point of Control and the 70% Value Area, the real zones of acceptance and rejection.
Volume profile provides a detailed overview of volume distribution across price levels, offering traders valuable insights into market structure and identifying key supply and demand zones.
In this guide, you’ll learn to read high-volume “strongholds” and low-volume “air pockets” to time trades with conviction.
Key Takeaways
- The volume profile indicates trading activity across price levels, identifying key trading zones.
- High-Volume and Low-Volume Nodes highlight support and resistance areas.
- Due to its imperfect signals, the volume profile must be combined with additional technical indicators.
- There are many flexible implementations of volume profiles to suit different trading strategies.
Traders use volume profiles to analyze market dynamics, assessing whether the market accepts or rejects a price level.
Understanding Volume Profile
The Volume Profile Indicator lets you see trading activity at certain price levels over a specific period. It’s typically represented as a histogram on the y-axis of a price chart. This histogram displays the amount of trading activity at each price level, giving you insight into significant price areas of interest.
Here’s a breakdown of the Volume Profile Indicator:
- Volume Profile: The aggregated volume at distinct price levels.
- Price Level: The y-axis on the histogram where volume data is mapped.
- Time Period: Customizable range for which the Volume Profile is visualized.
How it Works:
You view the Volume Profile as a vertical histogram next to the price levels on your chart. Each bar represents the amount of volume traded at a corresponding price level.
- High-Volume Nodes (HVN): Bold areas on the histogram indicate where heavy volume has been traded.
- Low-Volume Nodes (LVN): Light areas show where less trading activity has occurred.
This tool is helpful because it identifies regions where the market has spent most of its time, reflecting potential areas of support or resistance. Prices may gravitate towards HVNs as these levels can indicate fair value, while they might move quickly through LVNs, which could represent imbalance or transitional areas.
Trading with Volume Profile
Volume Profile is an advanced charting tool that offers insight into trading activity at specific price levels. This tool can inform your trading decisions by revealing potential buying and selling pressure zones.
Identifying Support and Resistance Levels
By analyzing the Volume Profile, you can identify where the most trading activity took place, often indicating support (a price level where buying is thought to be strong enough to prevent the price from declining further) and resistance (a level where selling is thought to be strong enough to prevent the price from rising higher). Key areas are highlighted where the volume is noticeably higher than surrounding levels, suggesting strong market interest.
- High-Volume Nodes (HVN): Areas with significant volume, potential support, or resistance.
- Low-Volume Nodes (LVN): Areas with little volume and price may move through these quickly.
- Point of Control (POC): The price level where the most volume was traded. It often acts as a strong support or resistance level.
Volume Profile as a Trading Strategy
When using Volume Profile as a part of your trading strategy, it’s important to assess how volume distribution correlates with price movements.
- Consider entering trades near HVNs, as they might act as pivot points.
- Use LVNs to identify breakout or breakdown points, as prices can move swiftly past these levels.
TradingView 4.8/5⭐ : The Best Trading Platform I’ve Tested in 20+ Years
With lightning-fast charts, powerful pattern recognition, smart screening, backtesting, and a global community of 20+ million traders — it’s a powerful edge in today’s markets.

If you want one platform that gives you an edge, this is it.
Strength of Trends and Reversals
Volume Profile can give you clues about the strength of a trend based on the volume at varying price levels. If a trend is accompanied by increasing volume at new price levels, it could indicate a strong trend.
- Uptrend confirmation: Sustained high volume at higher price levels.
- Downtrend confirmation: Sustained high volume at lower price levels.
Look for points where the volume drops significantly to signal a potential trend reversal.
Volume Profile in Retracements
During retracements, Volume Profile can help you determine the likelihood of a retracement turning into a reversal.
- Watch how the volume behaves as price retraces to HVNs; strong volume at these levels could support the primary trend.
- As price approaches these levels, a drop in volume might signal a weakening trend.
Utilize these insights to refine your entries and exits, manage risk, and understand market dynamics more effectively.
Key Components
The Volume Profile indicator provides detailed insight into trading activity at specific price levels. Understanding its key components can help you better interpret market dynamics.
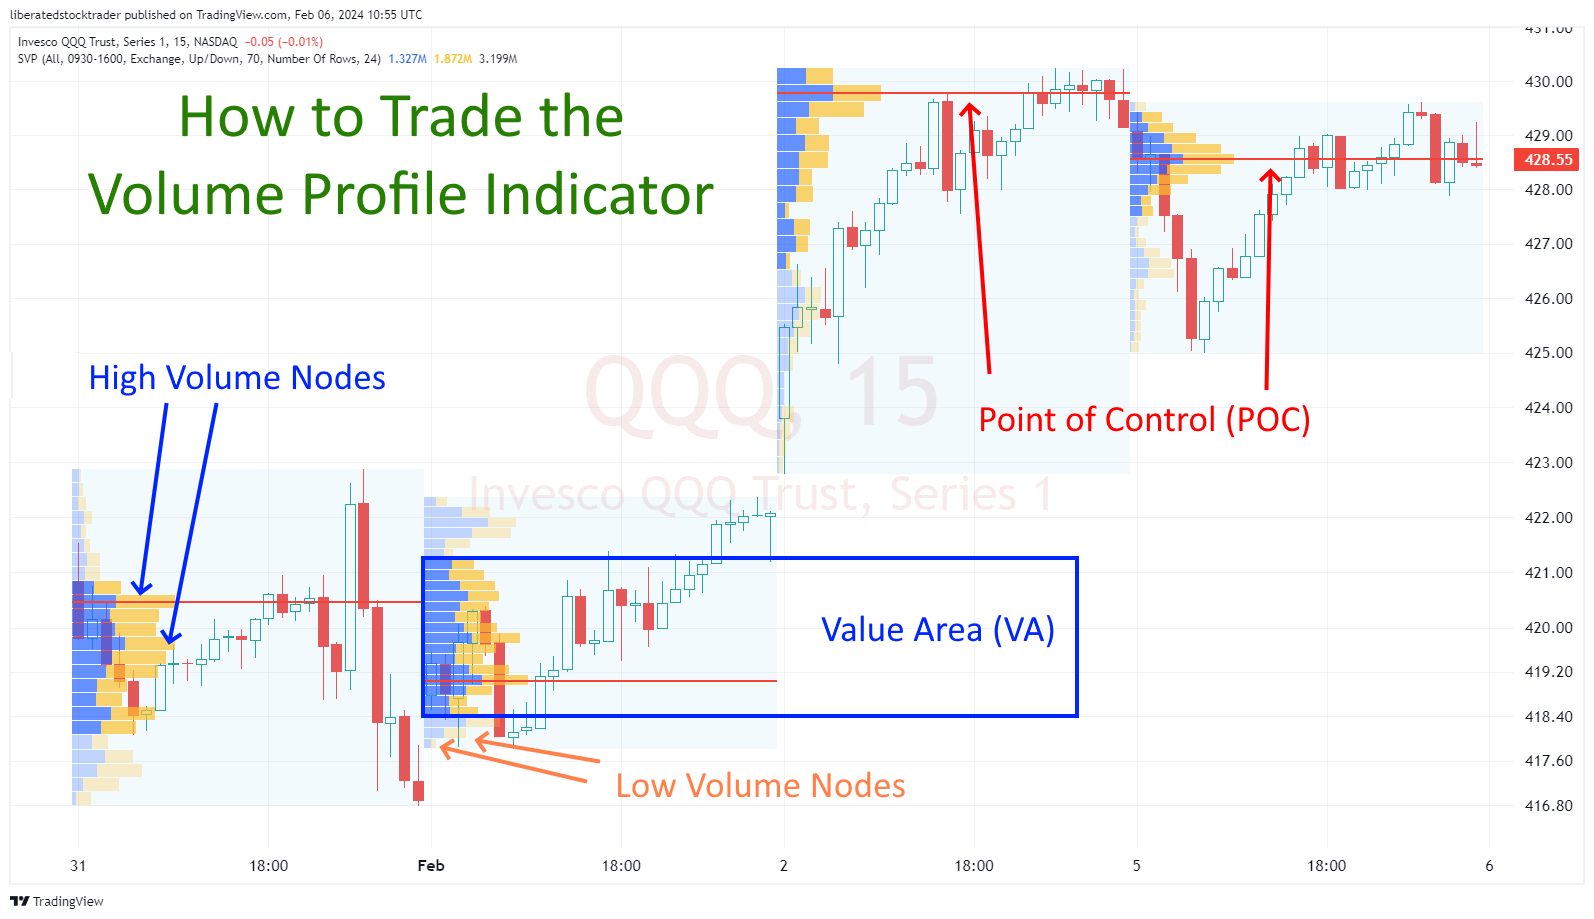
Value Area
The Value Area (VA) represents the range of price levels where a certain percentage of trading volume has occurred, typically around 70%. This area is where most trading activity has occurred and is essential for identifying market acceptance or rejection levels.
Point of Control
The Point of Control (POC) is the price level within the value area with the highest trading volume. This level indicates where the most trade has occurred, serving as a key reference for traders. The POC can act as a potential level of support or resistance.
Volume Nodes
Volume Nodes are specific price levels that represent significant trading volumes. The Volume Profile indicator visually identifies these nodes as peaks or valleys in trading volume.
- High Volume Nodes (HVN): Areas where trade activity is heavily concentrated; often, these levels can act as strong support or resistance.
- Low Volume Nodes (LVN): These are price levels with minimal trading activity and may indicate a price level where the market has spent little time.
Understanding these components can give you a deeper perspective on market sentiment and potential price movements.
Volume Profile Types
Volume profiles are essential for traders, providing an X-ray view of market activity at specific price levels. By understanding the different types of volume profiles, you can apply the most relevant one to your market analysis.
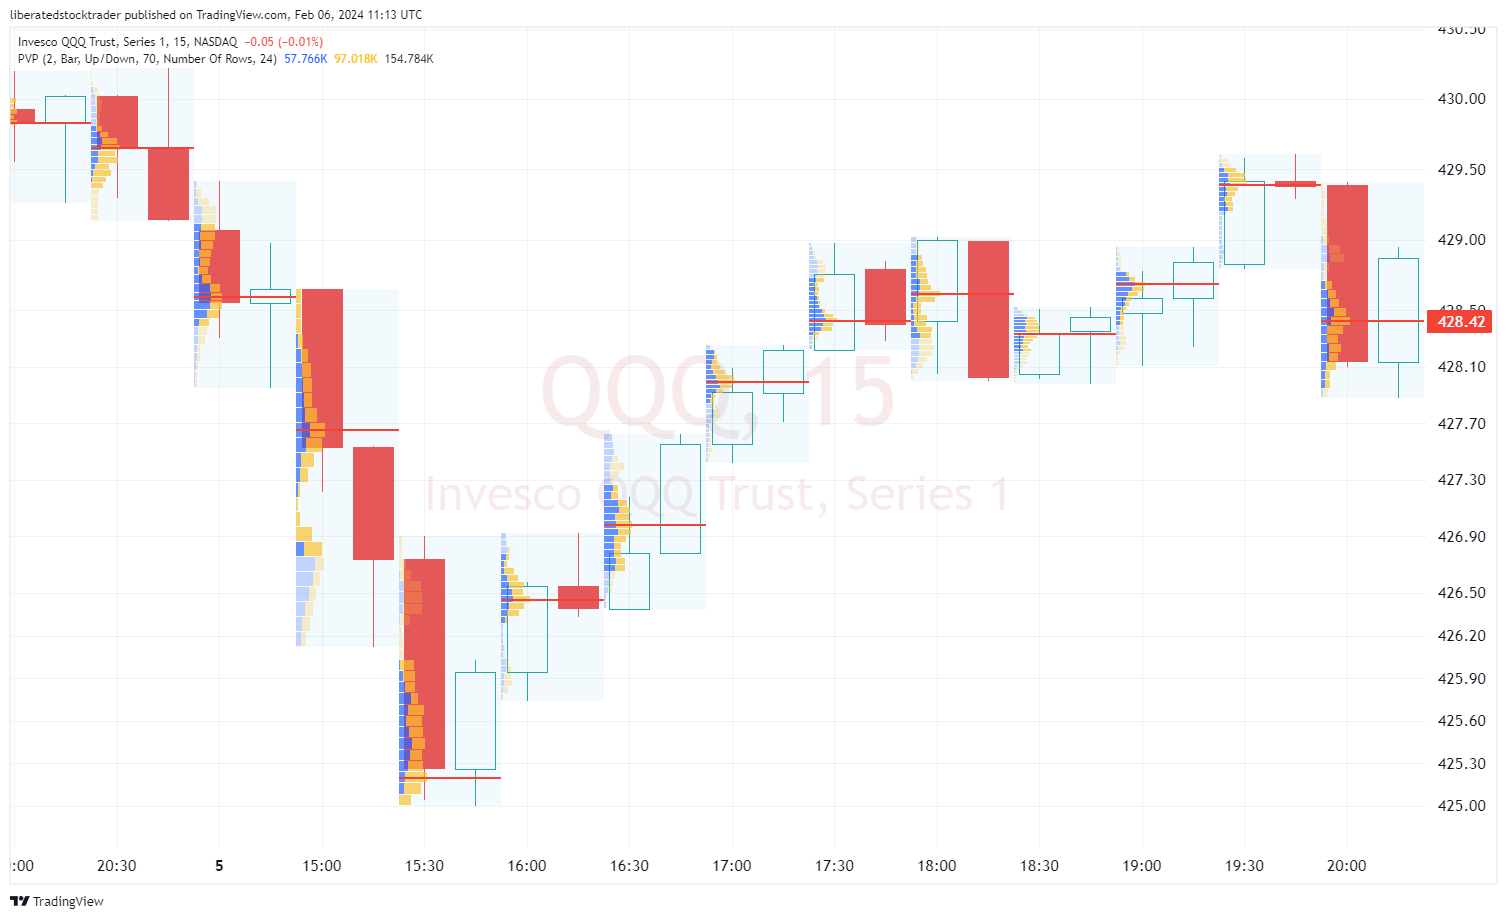
Fixed Range/Periodic Volume Profile
Periodic Volume Profile (PVP) offers a broader view by compiling volume data over a set period, such as hourly, weekly, monthly, or quarterly. PVP helps you to identify longer-term trading ranges and the dominant market areas within the specified period. In this example, I have configured PVP for two periods on a 30-minute chart, which gives a unique insight, especially when trading during the power hour.
- Compiles volume over weekly, monthly, or quarterly periods.
- Identifies longer-term interest areas and trading ranges.
Fixed Range Volume Profile (FRVP) allows you to select a specific range of price data and analyze the volume that has traded within this window. With FRVP, you can pinpoint market interest in distinct areas and evaluate the strengths or weaknesses at certain price levels.
- Analyzes volume over a specified range of data.
- Identifies key price levels based on historical volume.
Session Volume Profile
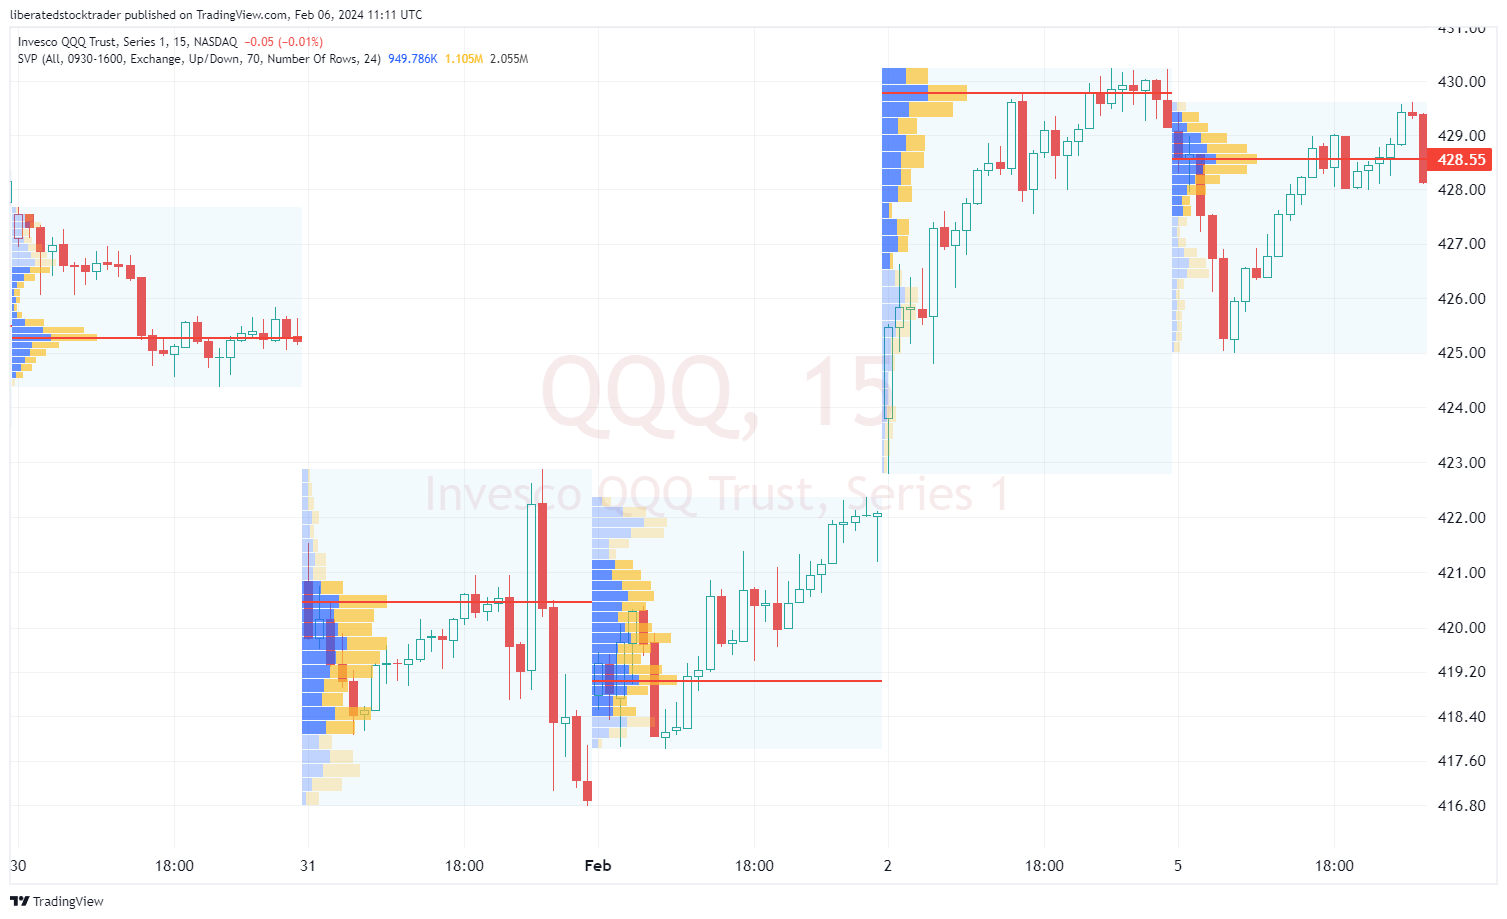
Session Volume Profile (SVP) breaks down volume data for individual trading sessions. It’s useful for identifying intraday volume patterns and can reveal how volume is distributed throughout a trading day.
- Examines volume in single trading sessions.
- Highlights intraday volume distribution and interest.
Visible Range Volume Profile
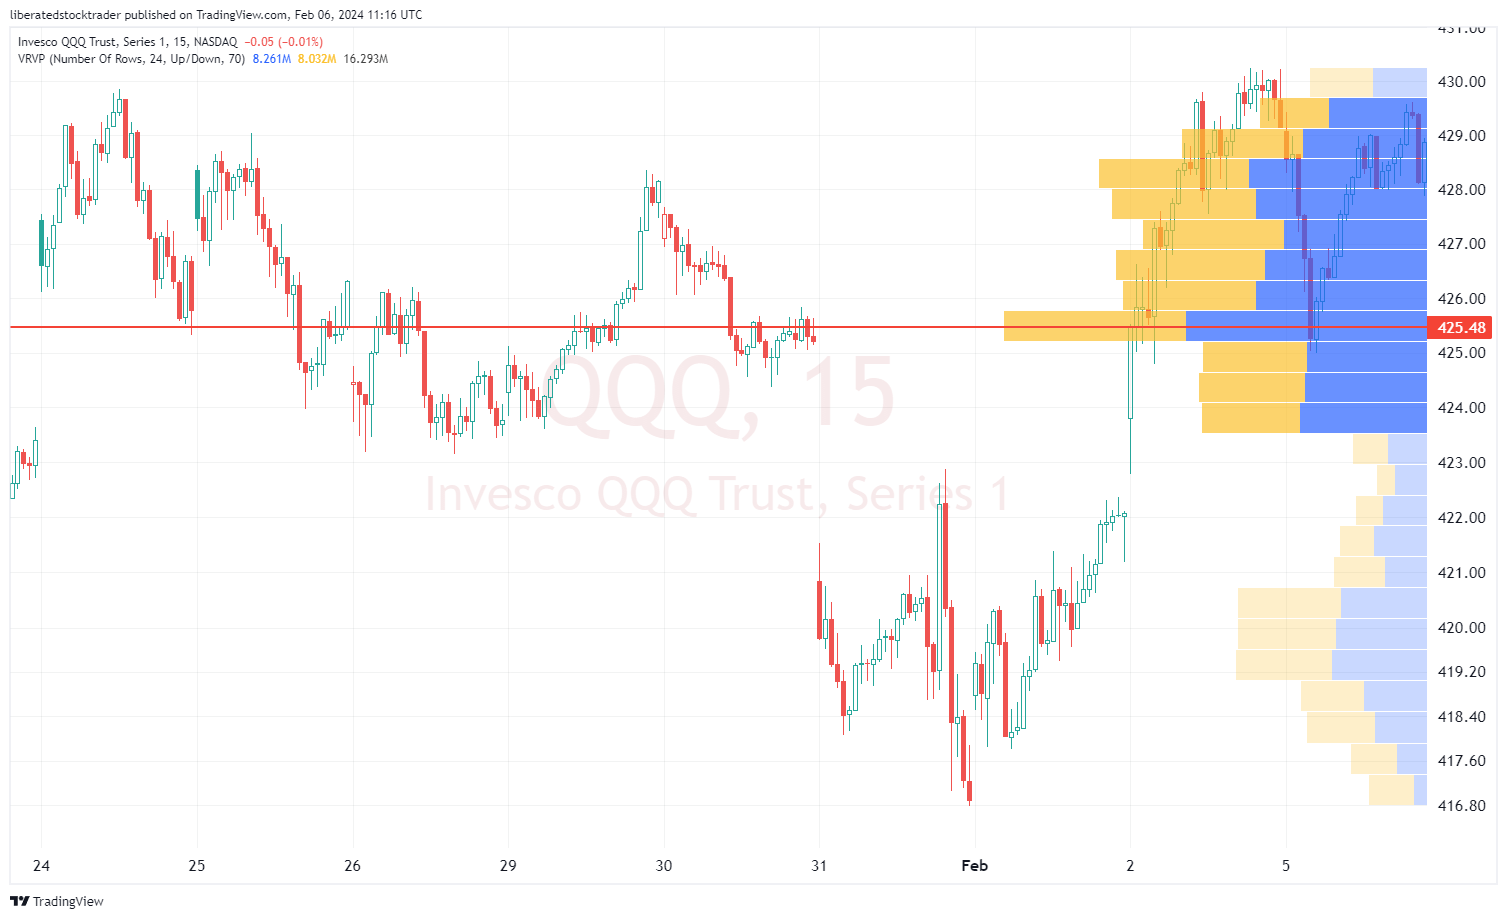
Visible Range Volume Profile (VRVP) takes a different approach by analyzing volume across the price levels currently visible on your chart. VRVP adjusts dynamically as you scroll through different price data, providing a real-time perspective of volume activity.
- Analyzes volume across visible price levels on the chart.
- Adjusts dynamically with chart scrolling for a real-time view.
Anchored Volume Profile
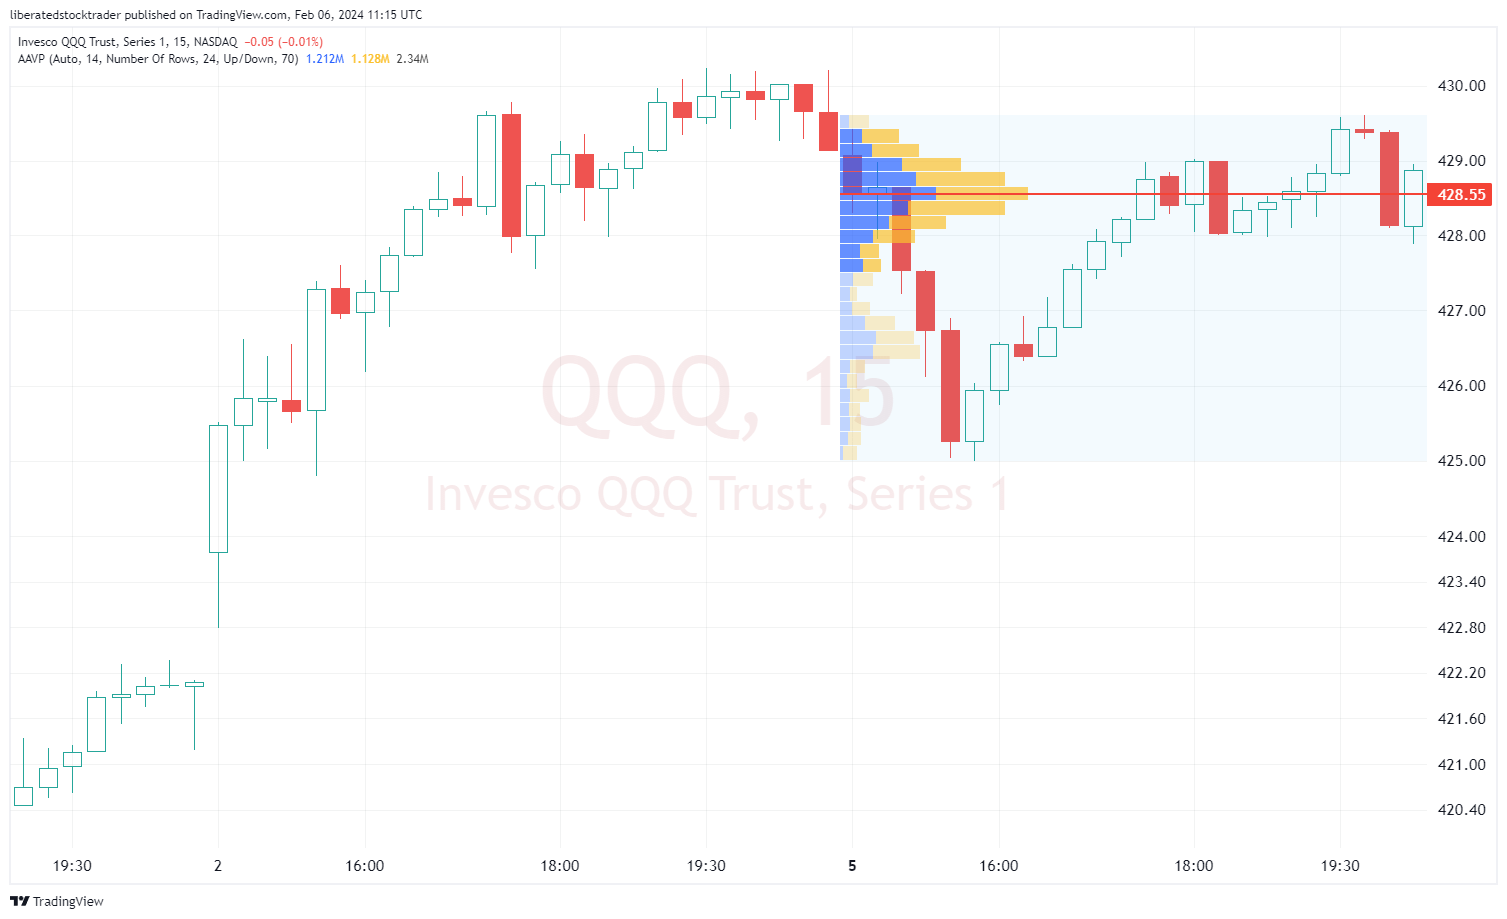
Anchored Volume Profile (AVP) allows the user to select a point to anchor the indicator onto. For example, you can select the high or low price for a week, month, or year period. In the example above, we are auto-anchoring to the highest trade volume for the latest session.
- Allows analysis of volume within a specific time or price range.
- Useful for identifying support/resistance levels and potential breakouts.
Calculating Volume Profile
To calculate the Volume Profile indicator, you start by identifying trading volume at distinct price levels over a selected period.
1. Choose Your Time Frame:
Begin by selecting an appropriate time frame for your analysis. It could be within a single trading day (intraday) or extend over several days, months, or even years.
2. Determine Price Levels:
Divide the price range into evenly spaced segments, often called ‘bins’ or ‘buckets.’ These represent distinct price levels.
3. Assign Volume to Price Levels:
Aggregate the total volume traded at each price level for your selected time frame. Each bin will now hold a total volume figure.
4. Create the Volume Profile:
Collecting all bins, with their respective volumes, forms your Volume Profile indicator. It visually represents a histogram on a chart adjacent to price levels.
5. Analyze the Data:
- High-Volume Nodes (HVN): These are price levels with significantly high volume, suggesting a consensus of value by market participants.
- Low-Volume Nodes (LVN): These levels have low trading volume, indicating less interest or agreement on price.
The shape and range of your Volume Profile provide insights into market dynamics. Notice where the volume peaks and where it tapers. These are potential areas of support, resistance, and likely zones of price consolidation or breakout.
Remember, while the total volume is critical, its distribution across the price levels brings depth to your analysis.
Try TradingView, Our Recommended Tool for International Traders
Global Community, Charts, Screening, Analysis, Broker Integration, Financial Metrics, Ratios & Analysis with TradingView

Global Financial Analysis for Free on TradingView
Volume Profile and Market Profile
When you examine a Volume Profile, you are looking at a histogram usually plotted along the y-axis of a price chart that reveals the quantity of traded volume at various price levels over a specified time frame. It differs from a Market Profile, which is more concerned with the price range and time spent at each price level, forming what is known as a TPO (Time Price Opportunity) chart. The two profiles together often provide a comprehensive picture, allowing you to pinpoint where trades are executed and where the market may spend significant time.
Price Levels and Liquidity
Price levels represent specific prices where historically significant trading volumes have occurred, which could suggest areas of high liquidity. You can think of liquidity as the ease with which an asset can be bought or sold in the market without affecting its price. High volume levels typically indicate stronger support or resistance as more traders are willing to buy or sell at these prices.
| Price Level | Significance |
|---|---|
| High Volume | Potential support or resistance: high liquidity |
| Low Volume | Less significant; low liquidity |
By recognizing these critical price levels through volume profiles, you can better understand market dynamics and make more informed trading decisions.
Breakouts and Value Area Volume
The Value Area, encompassing approximately 70% of the day’s trading volume, signifies a price range where the bulk of trading occurs. Breakouts typically occur when the price moves beyond the Value Area with increased volume, signaling a potential for continuation.
- Spotting Breakouts: Watch for a high-volume node moving outside the Value Area.
- Confirmation: Look for increased trading volume to confirm the breakout’s strength.
Using Volume Profile During Trading Sessions
Volume Profile is a roadmap to understand real-time market dynamics during your trading sessions. You can predict potential support and resistance levels by identifying areas with high-volume trading.
- Intraday Trading: Use shorter-timeframe Volume Profiles to identify intraday support and resistance levels.
- Swing Trading: Aggregate data can pinpoint strong longer-term price levels from past sessions that might influence current trades.
Customizing Volume Profile for Different Timeframes
Tailoring the Volume Profile for different timeframes allows for precision in identifying key market levels that other traders might overlook.
- Intraday Timeframes: A Volume Profile set to a 30-minute chart may reveal short-term trading opportunities.
- Long-term Timeframes: Configure the Volume Profile on a daily or weekly chart to understand larger trend dynamics and significant levels.
To implement Volume Profile in your analyses, consider these specific features and settings:
- Adjustability: Adapt the Volume Profile parameters to suit your strategy for quick scalps or long-term position trades.
- Visibility: Ensure the profile is clear and distinguishable on your chart for easy interpretation.
By integrating these specific aspects of the Volume Profile into your trading practice, you sharpen your ability to make informed decisions in line with prevailing market sentiments.
Technical Aspects of Volume Profile
Understanding the technical aspects of the Volume Profile is essential for effective market analysis. This section will guide you through the mechanics of Point of Control (POC) and Value Area (VA) calculations, the differences between tick volume and Volume Profile, and how to adjust the period multiplier for different timeframes.
POC and VA Calculations
The Point of Control (POC) represents the price level with the highest traded volume over a specified time. To calculate the POC, observe where the greatest volume of trades occurred. The Value Area (VA) designates the range where a certain percentage of the market action has taken place, typically around 70%. It is bound by the Value Area High (VAH) and Value Area Low (VAL).
- VA Calculation:
- Value Area High (VAH): The highest price level within the VA.
- Value Area Low (VAL): The lowest price level within the VA.
The VA is determined by identifying the price levels encompassing approximately 70% of the cumulative volume.
Comparing Tick Volume and Volume Profile
Tick Volume measures how often the price ticks up or down within a given period. In contrast, the Volume Profile displays the total volume traded at specific price levels over a selected timeframe.
- Differences:
- Tick Volume: Counts ticks without providing price-specific data.
- Volume Profile: Offers detailed insights into the traded volume at each price.
The Volume Profile provides a more granular view of the market action than tick volume.
Adjusting Period Multiplier for Different Timeframes
The Period Multiplier assigns weight to the volume depending on the timeframe. You need to adjust the multiplier based on the chart period you are analyzing to obtain an accurate Volume Profile.
- Adjustment Guide:
- Shorter timeframe (e.g., 1-minute bars): Lower period multiplier.
- Longer timeframe (e.g., daily bars): Higher period multiplier.
Choosing the right period multiplier ensures the Volume Profile reflects the trading activity relevant to your analysis.
Volume Profile with Other Indicators
Combining the volume profile indicator with other analytical tools can enhance your market analysis when trading. Using various techniques will provide a multi-dimensional view of market dynamics.
Trading tools often have built-in capabilities to overlay volume profile data onto price charts. To construct a layered analysis, you can combine this information with indicators such as moving averages or the Relative Strength Index (RSI).
- Moving Averages: Look for alignment between significant volume profile levels and moving averages to identify trend strength or reversal signals.
- RSI: When RSI divergences occur near HVNs or LVNs, it might signal a potential reversal point.
- OBV: When On-Balance-Volume (OBV) diverges from price action around key volume profile levels, it can indicate a shift in market sentiment.
- Heikin Ashi Charts: The Heikin Ashi chart, according to our testing, improves the performance of many indicators by smoothing out the volatility on candlestick charts.

Indicators provide different layers of market understanding, and when you sync them with volume profile data, your perspective on market behavior sharpens. Remember to perform thorough backtesting with historical data to validate the efficacy of this integrated approach before applying it to live trading scenarios.
FAQ
Which software has the best selection of volume profile indicators?
According to my research, TradingView has the broadest selection of volume profile indicators. Its six volume profile indicators include anchored, session, periodic, fixed, and visible volume.
How do you interpret the Volume Profile?
You look for areas of high volume that can indicate significant support or resistance levels. When a price level shows a high volume node, heavy trading activity occurred at that level.
What are the best trading strategies for Volume Profile?
One of the key strategies using Volume Profile is identifying high-volume nodes (HVNs) and low-volume nodes (LVNs). HVNs can act as barriers to price movements, potentially being areas of support or resistance. LVNs, on the other hand, can signal price levels where assets might move quickly due to a lack of interest.
Can Volume Profile indicators predict bullish or bearish trends?
Volume Profile indicators do not predict trends but provide a map of historical trading activity. This can indicate potential areas where price trends may stall or reverse based on previous volume concentrations, helping you anticipate and react to market movements.
How does the Volume Profile Visible Range work?
The Volume Profile Visible Range (VPVR) displays volume data only for the range of price action visible on the chart. This helps you assess the current range of trading activity, identifying key volume levels that could serve as future points of interest.
What's the difference between Session and Standard Volume Profile?
Session Volume Profile shows volume distribution for a single trading session, providing insights into intraday trading activity. Standard Volume Profile is longer-term, giving a broader view of volume distribution.
How does a Volume Profile indicator assist in identifying key levels of support and resistance?
A Volume Profile indicator highlights areas where significant trading activity has occurred, which are often key levels traders watch. High-volume areas could indicate strong support or resistance, while transitions from high to low-volume areas could show where the price might break through these levels.