Dividend investing is a popular strategy among long-term investors looking to build wealth and generate passive income. It involves investing in companies that pay out regular dividends, which are a portion of the company’s profits distributed to shareholders.
One of the key benefits of dividend investing is its potential for consistent returns. While stock prices fluctuate greatly, dividends are more stable and reliable. This makes dividend stocks particularly attractive for those seeking a steady income stream from their investments.
Our step-by-step guide covers four dividend strategies: high yield, safe dividends, long-term dividend growth, and dividend value stocks. It also shows you the tools and screening criteria you need to find high-quality dividend stocks.

Understanding How Dividends Work
When you invest in a dividend stock, you essentially buy a portion of the company and its profits. Dividends are distributed quarterly or annually, depending on the company’s policy. The dividends received are based on how many shares you own and your share price at the time of distribution.
A dividend is an offer from the company, confirmed by the board of directors, to pay out a portion of its income (after-tax profits) to its shareholders.
What Are Dividends?
A dividend is a payment from a company to its shareholders. These payments are usually made quarterly or annually, but this varies depending on the company’s policy. Dividend payments are typically a percentage of the current share price and can be used as income for investors seeking to generate regular returns.
Of the 7000+ stocks currently available on the major U.S. indexes, circa 2800 companies offer a dividend payout.
These companies tend to be well-established with a stable income stream, enabling them to offer a constant & consistent dividend.
The dividend is essentially a reward to the shareholder for holding the stock.
Choosing Software to Manage a Dividend Portfolio
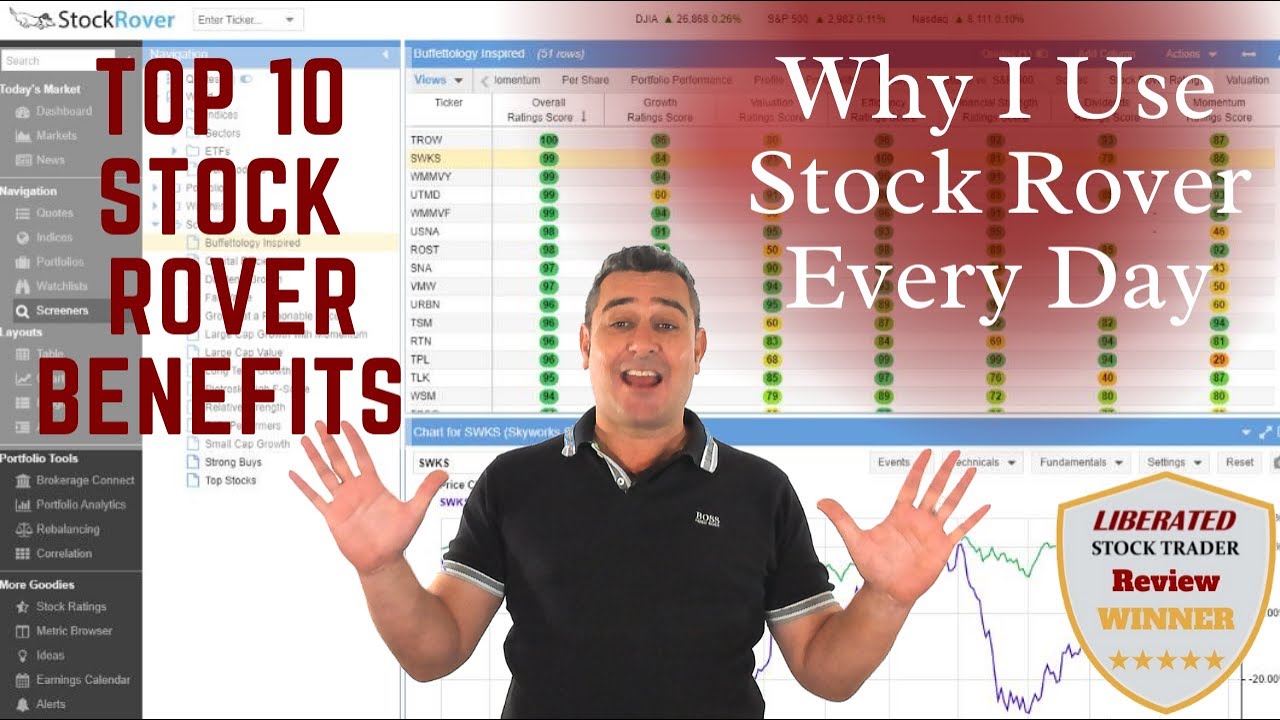
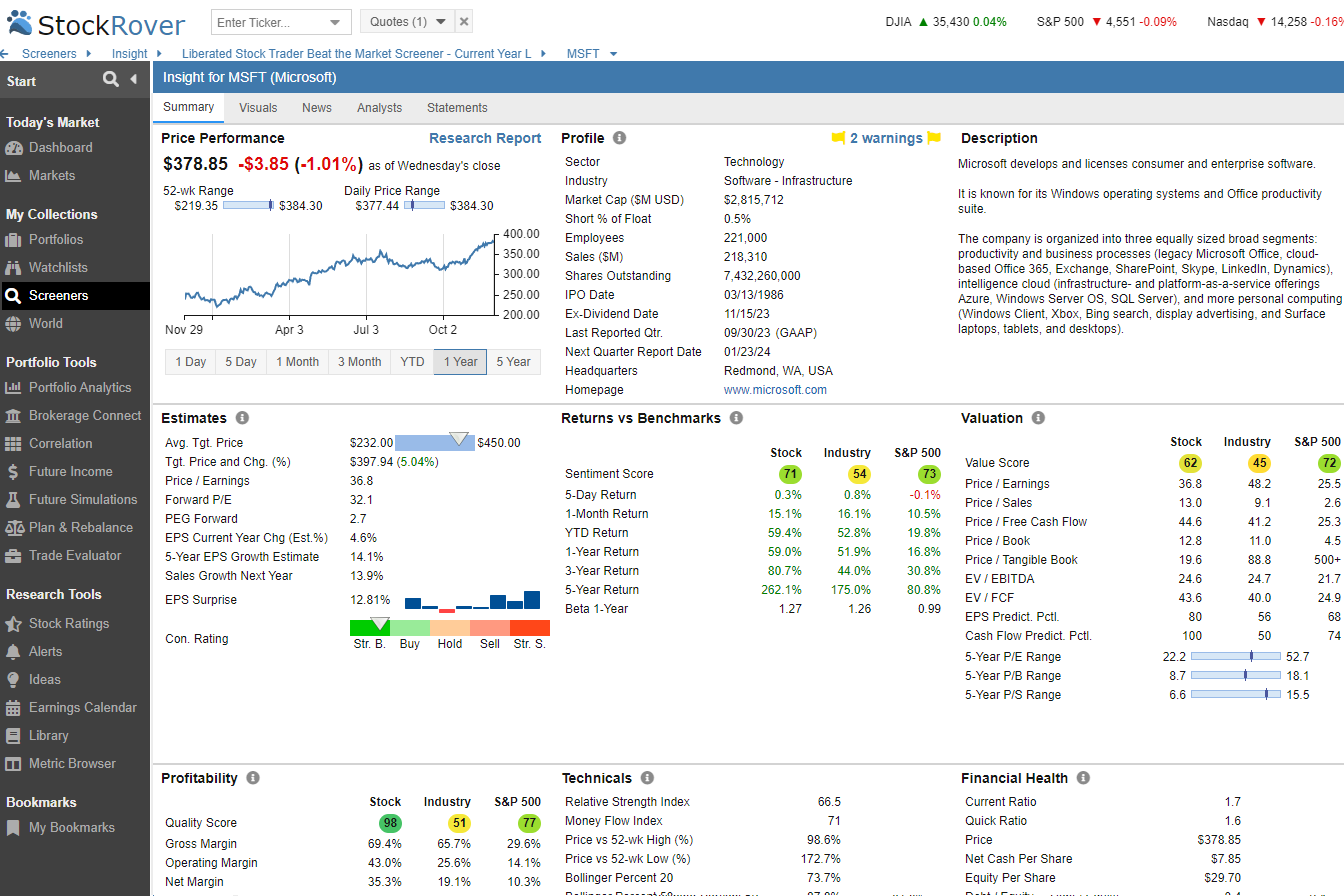
Our detailed testing shows that Stock Rover is the best software for testing, developing, implementing, and managing a dividend portfolio.
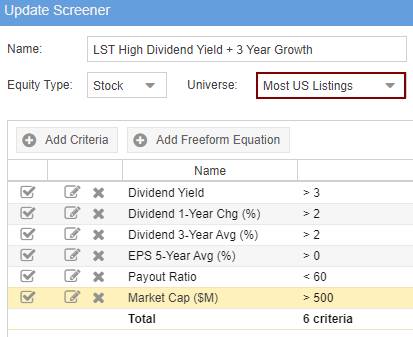
In particular, Stock Rover offers advanced screening capabilities that enable investors to quickly narrow their list of potential dividend stocks. For example, you can search for stocks by yield, payout ratio, 5-year dividend growth rate, and more.
Stock Rover also provides powerful charts and research tools, allowing investors to analyze potential dividend stocks further.

Get Stock Rover for Free with a Premium Trial
Ultimately, using Stock Rover, investors can create a robust and diversified dividend portfolio tailored to their risk tolerance and investment goals.
What Types of Dividends Are There?
There are 11 types of dividends: Cash, Stock, Property, Scrip, Special, Interim, Final, Extra, DRIP, Preferred, and Qualified.
- Cash Dividend – a payment made to shareholders in cash, usually via bank transfer or cheque. This is the most common type of dividend payment, usually released quarterly.
- Stock Dividend – a bonus issue of shares proportional to the shareholder’s existing holding.
- Property Dividend – a dividend paid in the form of assets, such as property or shares in another company.
- Scrip Dividend – similar to a stock dividend, but shareholders receive documents that they can use to purchase additional shares in the issuing company at a discounted price.
- Special Dividends are often one-off payments that can be in the form of cash or other assets.
- Interim Dividend – this type of dividend is a regular, short-term dividend paid after each reporting period.
- Final Dividend – is usually a larger payment than the interim dividend and is paid once at the end of the financial year.
- Extra Dividend – an additional dividend that can be declared at any time during the accounting period.
- Dividend Reinvestment Plan (DRIP): With this type of dividend, shareholders can choose to reinvest their dividends into buying more shares in the company. This allows them to benefit from larger returns over time as their holdings increase due to compounding growth.
- Preferred Dividend – is paid out to preferred dividend.
- Qualified Dividends – apply to both Common Stock Dividend and Preferred Stock Dividend.
Regular dividends can also become Qualified Dividends and are subject to lower Capital Gains Tax rather than Higher Income Tax. If you are serious about investing in dividend income, you will want to read What Is Qualified Dividend? How can you take advantage?
Investing In Stocks Can Be Complicated, Stock Rover Makes It Easy.
Stock Rover is our #1 rated stock investing tool for:
★ Growth Investing - With industry Leading Research Reports ★
★ Value Investing - Find Value Stocks Using Warren Buffett's Strategies ★
★ Income Investing - Harvest Safe Regular Dividends from Stocks ★

"I have been researching and investing in stocks for 20 years! I now manage all my stock investments using Stock Rover." Barry D. Moore - Founder: LiberatedStockTrader.com
What is a Dividend Payment?
A dividend payment is a portion of a company’s profits paid to shareholders. When a company generates a profit, it can reinvest that money into the business or distribute it as dividends. Dividends are often paid in cash but can also be paid in stock.
The dividend payment is usually expressed in dollars per share. If I own 100 shares of a company whose stock price is $200, if the company pays out $5 per share, I will receive 100 X $5 = a $500 payment. Usually, this is distributed quarterly, meaning I will receive $125 per quarter.
Dividend Payment = Number of Shares X Payment per Share.
What is the Dividend Yield?
Here’s an illustration of the Dividend Yield. I currently hold 1000 shares of ABC Company, purchased at $10 per share. ABC consistently pays out a dividend of $0.50 per share. With each share valued at $10, this translates to a dividend yield of 5%.
Dividend Yield = Annual Dividend Paid / Stock Price.
This 5% is essentially what you earn on your money regardless of stock price growth. Of course, if the stock price deteriorates during the period you hold the stock, your net profit may reduce. For example, you make a 5% profit in dividend yield, yet the stock price has depreciated 5%. This means your net profit if you were to sell would be Zero.
What is the Dividend Payout Ratio?
The dividend payout ratio is the amount of money a company pays out in dividends to shareholders compared to its net income or profits. It’s calculated by dividing the total dividends paid over some time (usually one year) by the company’s net income. The result gives you an idea of how much money that company will pay back to shareholders as dividends.
The higher the payout ratio, the more money a company pays out to shareholders compared to their net income or profits. This can be beneficial for investors looking for stocks with high dividend yields. Still, it can also be risky, as a high payout ratio may indicate that a company is having difficulty retaining and reinvesting its earnings back into the business.
Dividend Payout Ratio Example
This is the proportion of the Earnings per Share (EPS) paid out in dividends. For example, if a company earns $2.50 for every outstanding start and pays out $0.50 per share in dividends, then the dividend payout ratio is 20%.
Dividend Payout Ratio = Dividends per Share / Earnings per Share
What is the Ex-Dividend Date?
This is the date two business days before the dividend payment is scheduled.
For example, if you purchase a stock on April 24th and the company announces the dividend payment date is April 30th, you will be entitled to the dividend. However, the previous owner will receive dividends if you purchased the stock on April 29th.
What kind of Dividend Payouts Can You Expect?
Of the 7000+ stocks currently on the major U.S. Indices, approximately 40% of the companies pay dividends. Of the stocks that do pay out a dividend, those yields range from 1% to over 5%. For example, if a stock trades at $50 and pays out $0.50 per share in dividends, the dividend yield is 1%. On the other hand, if the same stock were trading at $10 with the same $0.50 dividend payout, the dividend yield would be 5%.
Another factor to consider is how often a company pays out a dividend. Some companies pay dividends quarterly, while others may have semi-annual or annual payments. Payouts can also differ yearly, depending on a company’s performance and financial position.
Finally, it’s important to remember that some stocks do not pay dividends. That means no matter how much the stock price increases, you won’t receive any money from the company as a dividend. Instead, you would have to sell your shares to realize any profits.
Interesting Dividend Payout Facts.
- 2800 companies are paying a dividend.
- Less than 0.5% payout a dividend of more than 10%
- 25% of the companies pay out a dividend yield of between 5% and 10%
- Less than 1% of companies pay a dividend of less than 1%
- This means approximately 74% of the companies pay between 1% and 5%
- A reasonable expectation is to receive a dividend of around 3% annually.

Try Powerful Financial Analysis & Research with Stock Rover
10 Factors in Creating a Good Dividend Investing Strategy?
When choosing a dividend investing strategy, you should consider yield, consistency, growth, risk, diversification, taxes, and reinvestment.
- Dividend Yield: Look at stocks with high dividend yields ( greater than 5%), providing more income from your investments.
- Consistency: Choose companies with a consistent history of paying dividends and that are likely to continue doing so in the future.
- Growth: Look for companies that pay increasing dividends over time, as these will provide you with a larger income stream.
- Risk: Consider the company’s risk profile when selecting stocks for your portfolio, as this will help you manage potential losses from dividend cuts or stock price declines.
- Diversification: It is important to diversify your investments across different sectors and industries, as this will help you mitigate risks.
- Long-Term Investing: When investing in dividend stocks, it is important to think long-term, as this will allow you to benefit from compounding interest over time.
- Tax Efficiency: Look for tax-efficient companies when choosing dividend stocks, which will help maximize your returns.
- Research: Do your research before investing in any individual stock or funds. This will help you make informed decisions and minimize risks.
- Patience: Don’t expect overnight riches with dividend investing; it takes time for companies to pay dividends, so have patience when investing in dividend stocks.
- Reinvest: Consider reinvesting some or all of your dividends back into the market to take advantage of compounding interest.
Choose a Dividend Strategy According to your Risk Profile
We have developed, researched, and tested four dividend strategies suitable for all risk profiles: High Yield, Safe, Growth, and Value Dividends.
1. High Yield Dividend Strategy
When looking to maximize gains through dividends, one primary strategy is to seek out companies with the highest dividend yield. A company displaying a current yield of 10% may suggest a potential 10% income from your investment for that year. However, it’s important to note that while a 10% yield is considerably high, it could be attributed to various factors.
For instance, the decline in stock price might have greatly impacted the dividend yield, making it appear much higher as the yield is calculated by dividing the dividend payment per share by the price per share. Hence, besides adopting a high-yield approach, it’s crucial to ensure the company can sustain dividend payments in the future. To do so, one should consider a payout ratio that isn’t excessively high, ideally less than 60.
2. Safe Dividends Strategy
To safeguard the dividends you rely on, it’s essential to consider additional factors that support the continued receipt of dividends. Seek out well-capitalized companies, ideally valued above $2 billion. Adjust your dividend yield expectations to a minimum of 1.5% to identify companies with sustainable dividends. Lower your criteria for 1-year, 3-year, and 5-year dividend averages to >0% to ensure long-term dividend payments.
Ensure the stocks you choose to trade on major, well-regulated exchanges like LSE, DAX, NYSE, or NASDAQ. Additionally, refine your payout ratio criteria to <50% to avoid companies that already distribute an excessive portion of their earnings as dividends.
Lastly, focus on companies experiencing sales growth surpassing the dividend averages or growth. This acts as an extra level of security, ensuring that growing sales will not negatively impact future dividends.
3. Long-Term Dividend Growth Strategy
The Dividend Kings or Dividend Aristocrats strategy involves investing in companies with a proven track record of consistent dividend payments and growth. To execute this strategy effectively, it is crucial to have access to a comprehensive stock screener that offers an extensive historical database of earnings and dividends, such as Stock Rover.
By utilizing such a tool, investors can make informed decisions and capitalize on the potential of these financially stable and reliable companies.
A 5 Step Screening Strategy To Find Top Dividend Growth Stocks
- Find Out More: A Long-Term Dividend Growth Strategy & Criteria to Use
4. Value Stocks with Dividends Strategy
When it comes to investing, a smart strategy is to look for dividend-paying and value stocks. This approach, championed by Warren Buffett and Ben Graham, is like buying extra insurance and helps to minimize unnecessary risks. While dividends are appealing, it’s important to consider the potential decline in stock price during your holding period, as dividends alone may not offset the loss.
To identify value stocks, focus on traditional metrics such as low price-to-earnings, price-to-sales, and price-to-book ratios. However, comparing these ratios within the same industry or sector is crucial, as different industries have varying valuation standards. For instance, high-tech growth stocks like Netflix typically have higher price-to-earnings ratios, while utility companies tend to have lower ones.
Consider using a stock scanner like Stock Rover to streamline your search for value stocks. This tool allows you to select companies with the lowest price-to-earnings ratios relative to their peers in the industry or sector. It also offers an exclusive set of criteria based on Warren Buffett’s value investing principles, such as Fair Value/Intrinsic Value and Margin of Safety.
By following this approach, you can enhance your investment strategy, optimize your returns, and align with the wisdom of renowned investors like Buffett and Graham.
How to build the ultimate dividend strategy.
FAQ
What is the Best Software for Dividend Investing?
Stock Rover is the best software for dividend investors. It helps you analyze stocks and ETFs, track your investments, compare dividend yields across different assets, uncover new ideas, and optimize your portfolio. You can also create custom watchlists to monitor stocks that meet your criteria.
What is the difference between dividend and income investing?
The difference between dividend and income investing is that dividend investing focuses on companies that pay dividends. In contrast, income investing focuses on investments with a steady income stream, such as bonds and real estate.
What is dividend investing?
Dividend investing involves buying stocks of companies that pay dividends, which are regular cash payments to shareholders.
Why should I consider dividend investing?
Dividend investing can provide a steady income stream and the potential for long-term wealth accumulation through compounding. Dividend payments are also generally less volatile than stock prices, making dividend investing an attractive option for investors who want to reduce their risk exposure.
What should I look for when selecting dividend-paying stocks?
When selecting dividend-paying stocks, it is important to consider a company's history of dividend payments, the stability of its income sources, and its potential for long-term growth. Additionally, investors should compare dividend yields between stocks and assess the tax implications of any dividend payments they receive.
How do I identify companies that pay dividends?
Using professional yet easy-to-use software like Stock Rover, you can look for companies with consistent dividend payments and stable financial positions.
What is a dividend yield?
The dividend yield is the annual dividend payment divided by the stock price, expressed as a percentage. It indicates the return on investment from dividends.
What is dividend reinvestment?
Dividend reinvestment allows you to automatically use your dividends to purchase additional shares of the same company's stock. This allows you to increase your position size without making additional investments.
How can I calculate my dividend income?
To calculate your dividend income, multiply the number of shares you own by the dividend per share amount. This will give you the total dividend income from a particular stock. You can then add all your dividend incomes to get your total income.
How can I assess the sustainability of a company's dividends?
To assess the sustainability of a company's dividends, analyze its financial health, cash flow, and dividend payout ratio to determine if it can maintain its dividend payments.
Should I focus on high-yield or dividend-growth stocks?
It depends on your investment goals. High-yield stocks provide immediate income, while dividend-growth stocks offer the potential for increasing dividends over time.
What is a dividend aristocrat?
A dividend aristocrat is a company that has consistently increased its dividend for at least 25 consecutive years.
Are dividends taxed differently?
Yes, dividends can be subject to different tax rates, such as qualified dividends that receive favorable tax treatment.
What risks should I be aware of when investing in dividend stocks?
The main risks include dividend cuts, economic downturns, and industry-specific challenges.
How can I diversify my dividend portfolio?
Invest in companies from different sectors and industries to reduce the risk of relying on a single company for dividends.
What is the ex-dividend date?
The ex-dividend date is the cut-off date for determining who can receive a company's upcoming dividend payment.
Should I reinvest dividends or take them as cash?
It depends on your investment strategy and whether you prefer to reinvest for potential growth or receive cash for income.
How can I manage a dividend portfolio?
To effectively manage a dividend portfolio, you should use Stock Rover to track dividend yields, invest in quality stocks that have demonstrated consistent growth, and diversify across industries. Additionally, you should monitor the value of your investments regularly.
How often should I review my dividend portfolio?
It is recommended that investors review their dividend portfolios at least quarterly to ensure they are adequately diversified and meeting their investment goals.
