My comparative testing of TradingView vs. StockCharts reveals that TradingView is a powerful global stock charting platform with 20 million active users, whereas StockCharts.com, although offering expert commentary, primarily covers US markets.
As a certified financial technician, I am uniquely positioned to compare the key important differences between the TradingView and StockChart chart analysis tools.
TradingView vs. StockCharts Summary
This comparison of TradingView vs. StockCharts shows that TradingView is best for trading, social community, news, backtesting, and screening. StockCharts’ new ACP charting platform is a significant improvement, but it still lags behind TradingView.
| TradingView vs. StockCharts Ratings | TradingView | StockCharts |
| 🏅 Rating | 4.8/5.0 | 3.8/5.0 |
| 💸 Pricing | ★★★★★ | ★★★★✩ |
| 💻 Software | ★★★★★ | ★★★★✩ |
| 🚦 Trading | ★★★★✩ | ★★★✩✩ |
| 📡 Scanning | ★★★★✩ | ★★★★✩ |
| 💡 Pattern Recognition | ★★★★✩ | ★★★★✩ |
| 📰 News & Social | ★★★★★ | ★★✩✩✩ |
| 📈 Chart Analysis | ★★★★★ | ★★★★★ |
| 🔍 Backtesting | ★★★★✩ | ★★✩✩✩ |
| 🖱 Usability | ★★★★★ | ★★★★★ |
🏅Ratings Summary
TradingView scores 4.8/5 because it has the best community, charts, backtesting, news, and screening. StockCharts scores 3.8/5 because it lacks social community, financial news, and backtesting capabilities. StockCharts’ new advanced charting platform, ACP, represents a significant improvement, but it still lags behind TradingView’s range of charts, indicators, and drawing tools.
StockCharts does provide market commentary from leading technical analysts, such as John Murphy, but TradingView offers a social community of 10 million users and talented chartists who constantly share ideas.
Let’s compare the outstanding features head-to-head.
⚡Features
TradingView and StockCharts both cover stocks, indexes, and cryptocurrencies; the primary difference is that StockCharts is limited to the US, while TradingView is global. TradingView features a news stream and a vibrant and active social community of 10 million users sharing charts and ideas. StockCharts has no news or social component.
| Features | TradingView | StockCharts |
| ⚡ Features | Charts, News, Watchlists, Screening | Charts, Watchlists, Screening |
| 🏆 Unique Features | Trading, Backtesting, Community | Members Commentary |
| 🎯 Best for | Stock, FX & Crypto Traders | Stocks Only |
| ♲ Subscription | Monthly, Yearly | Monthly, Yearly |
| 💰 Price | $0-$59/mo | $0-$39/mo |
| 💻 OS | Web Browser | Web Browser |
| 🎮 Trial | Free 30-Day | Free 30-Day |
| 🌎 Region | Global | USA, UK, Canada |
| ✂ Discount | $15 Discount + 30-Day Pro Trial | -8% With Annual Subscription |
| 🏢 Visit | Try TradingView Free | Try StockCharts |
💸 Pricing
TradingView and StockCharts offer free access to their platforms; however, TradingView’s free service has more functionality than StockCharts. TradingView offers free scanning and screening, backtesting, watchlists, and candlestick chart recognition, whereas with StockCharts, these benefits are only available to paying members.
TradingView pricing starts at $0 for the basic ad-supported plan, with Pro costing $14.95, Pro+ costing $29.95, and Premium costing $59.95 per month. Opting for a yearly subscription will reduce those costs by 16%, representing a significant saving. There is an additional $2 cost per exchange if you want real-time data. I recommend the Pro or Pro+ services to strike the right balance of power and price.
StockCharts pricing starts at $15/month for the Basic plan, with Additional costs of $25/month for the Extra plan, and $40/month for the Pro plan. Opting for a yearly subscription will give you one free month and an 8% discount. With StockCharts, real-time data costs an additional $10 per month, compared to $2 for TradingView.
TradingView Discounts
You can get up to a 60% discount on TradingView by following simple steps. Find out more in our dedicated TradingView discounts article.
💾 Software
Both TradingView and StockCharts offer excellent, stable, and reliable platforms that are easy to use. Both companies offer HTML5 software that lives in the cloud, so you don’t need to install software or configure exchange data stream downloads; it works across multiple devices.
| Key Features | TradingView | StockCharts |
| Market Data | Global | USA |
| Powerful Charts | ✔ | ✔ |
| Stocks | ✔ | ✔ |
| Futures | ✔ | ✘ |
| Forex | ✔ | ✘ |
| Cryptocurrency | ✔ | ✔ |
| Social Community | ✔ | ✘ |
| Real-time News | ✘ | ✘ |
| Screeners | ✔ | ✔ |
| Backtesting | ✔ | ✘ |
| Automated Analysis | ✔ | ✔ |
🚦 Trading
TradingView supports 30 high-quality brokers, meaning tight integration, so you can directly trade from charts and view your profit and losses directly in TradingView. StockCharts integrates with one broker, Tradier, which offers $0 commission stock trading and free stock options trading for a flat monthly fee of $25.
TradingView integrates TradeStation, an excellent broker offering zero-commission stock trades, as well as other brokers for trading futures, forex, and cryptocurrencies.
🎥 TradingView Review Video
📡 Scanning
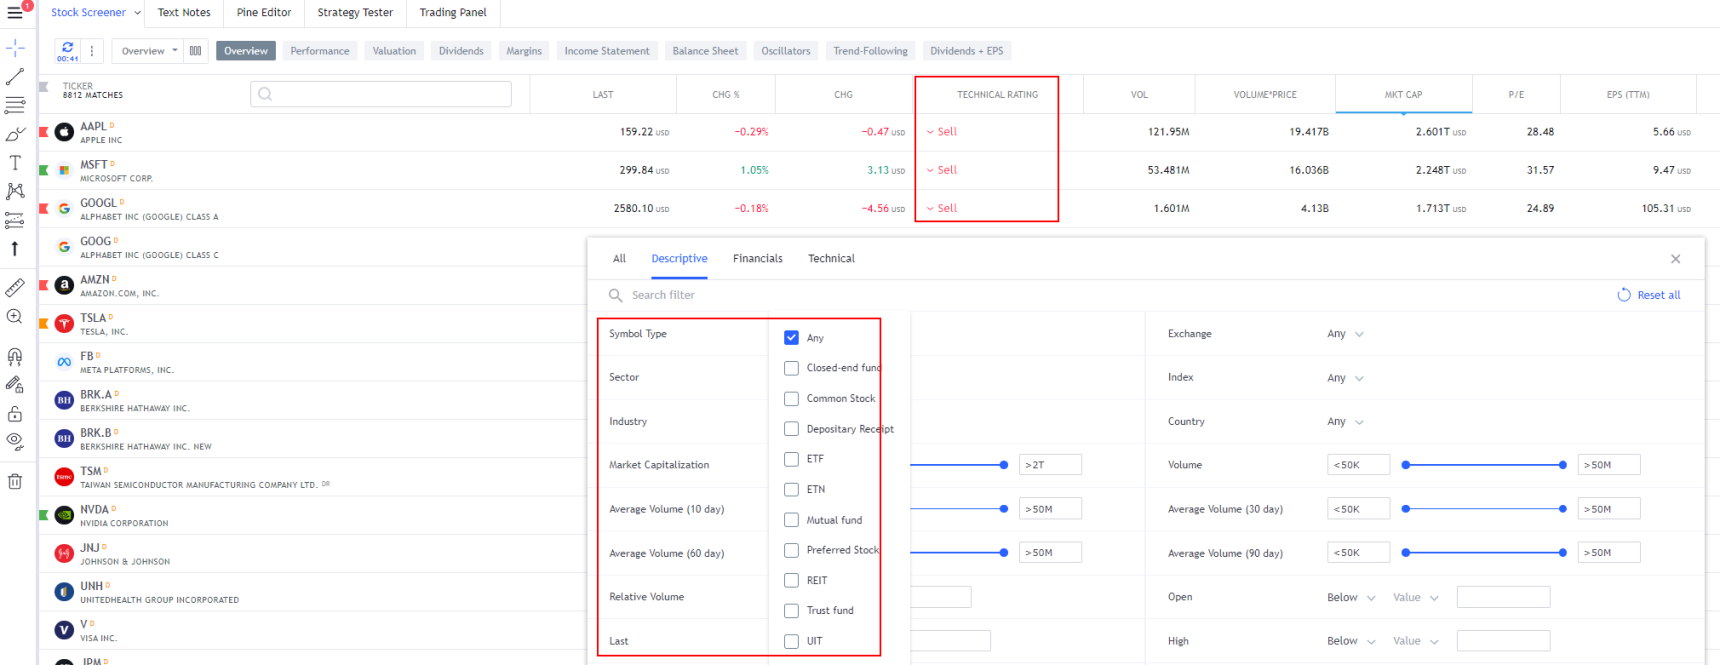
TradingView has integrated stock, forex, and crypto screeners, as well as heatmaps, covering fundamental analysis and price/volume indicator scanning. StockCharts primarily focuses on the technical screening of price, volume, and indicators, including price pattern scanning for Candlestick and Point and Figure charts.
The TradingView stock screener comes complete with 160 fundamental and technical screening criteria. All the usual criteria are present, including EPS, Quick Ratio, Pre-Tax Margin, and PE Ratio. However, it also delves into more depth with esoteric criteria, such as the number of employees, goodwill, and enterprise value.
StockCharts’ advanced scan workbench offers a wide selection of technical indicators, including MACD, Moving Averages, and RSI. StockCharts also has a coding window for customizing scans, but it is not as flexible or powerful as TradingView’s Pine script coding engine.
🎥 StockCharts Video Overview
💡 Chart Pattern Recognition
StockCharts enables paying members to scan for point-and-figure chart patterns and candlestick chart patterns. TradingView enables automated candlestick recognition in its free service, and you can scan for 28 different Candlestick patterns. TradingView also has thousands of community-developed indicators and systems.
📰 News & Social
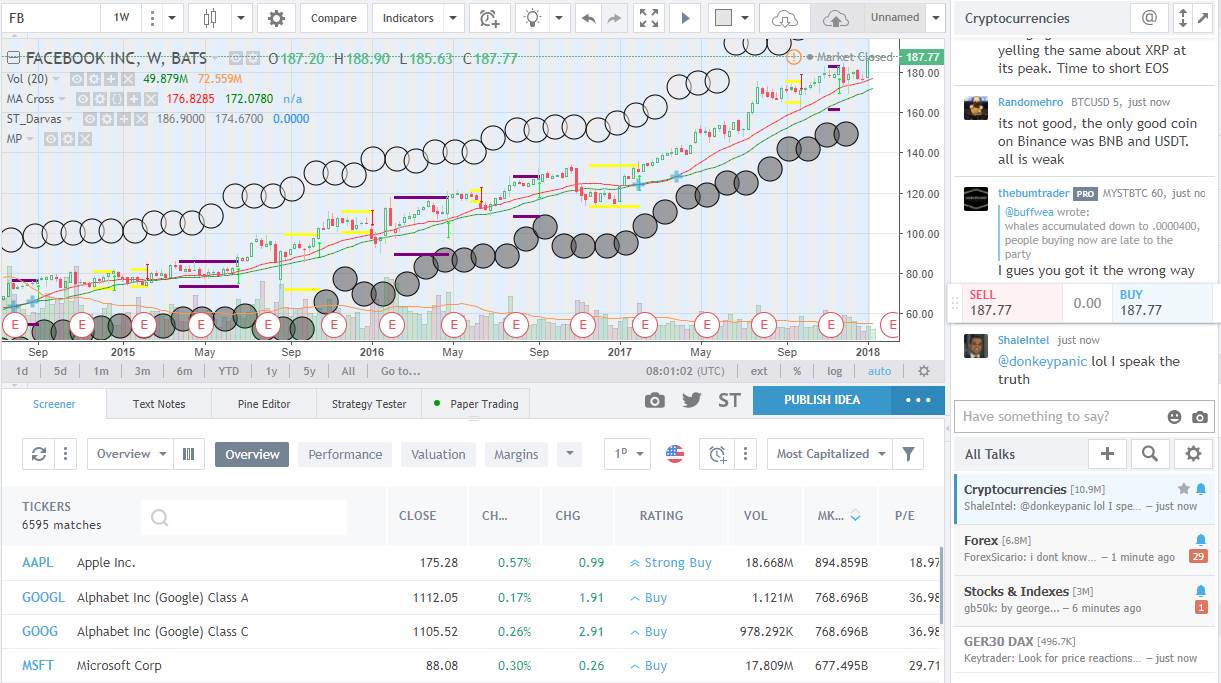
TradingView is built with the community at the forefront and is best for social sharing and learning; forget StockTwits, TradingView is the best. TradingView’s fully integrated chat forum and publishing system are excellent ways to share your charts and ideas. StockCharts does not have an interactive social community or a newsfeed.
Check out my published ideas on TradingView and follow me for stock market and stock analysis ideas and commentary.
Chart, Scan, Trade & Join Me On TradingView for Free
Join me and 20 million traders on TradingView for free. TradingView is a great place to meet other investors, share ideas, chart, screen, and chat.
📈 Chart Analysis
Both StockCharts and TradingView offer a broad range of powerful features for chart analysis. TradingView offers 160 different indicators, while StockCharts provides only 66. TradingView offers 12 stock chart types, including unique specialty charts like LineBreak, Kagi, Heikin Ashi, Point & Figure, and Renko.
StockCharts has 12 chart types, including Candlesticks, Heiken Ashi, and the unique Elder Impulse system.
TradingView offers 65 drawing chart annotation tools, including capabilities not available on other platforms, such as extensive Gann & Fibonacci tools, as well as hundreds of icons for your charts, notes, and ideas. StockCharts offers 32 different chart annotation tools.
StockCharts recently released the Advanced Charting Platform (ACP), a significant improvement over the outdated charts of the past. Still, ACP is not as flexible and powerful as TradingView’s charting platform.
TradingView’s innovative Buy and Sell gauges save you time by providing an instant readout of which stocks are bullish, bearish, or neutral; StockCharts does not have this functionality.
TradingView’s stock indicator ratings are well-implemented because they incorporate two critical technical analysis indicators: moving averages based on price and oscillators based on price and volume. Based on my observations, the TradingView buy and sell indicators are a good measure of sentiment and are featured in my Fear & Greed Index Dashboard.
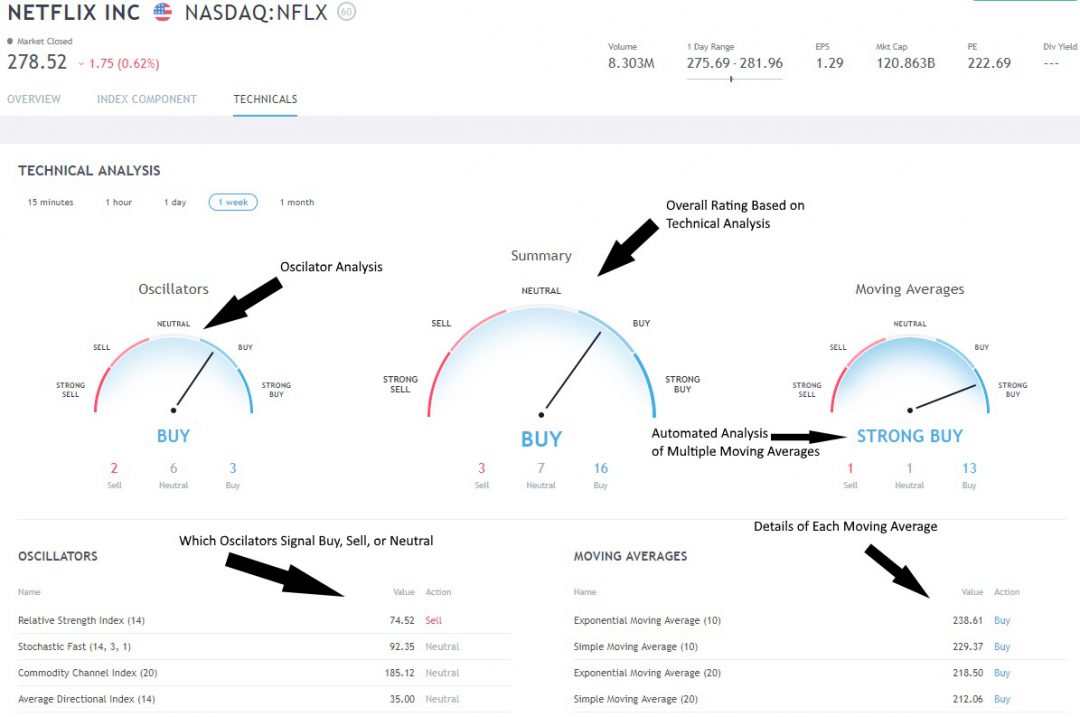
You can click on “Technicals,” and you are presented with three gauges when you view a chart. The left gauge displays oscillating indicators, including relative strength, stochastics, and the Average Directional Index. On the right, you have a selection of Moving Averages, Simple, Exponential, and even Ichimoku Cloud.
Although TradingView offers more indicators and annotation tools, StockCharts ACP is a solid platform with promising future potential.
🔍 Backtesting
TradingView has implemented powerful backtesting features, whereas StockChart does not have backtesting functionality. Scanning for chart patterns and indicator conditions in a specific historical timeframe with StockCharts is possible, but that is not the same as backtesting.
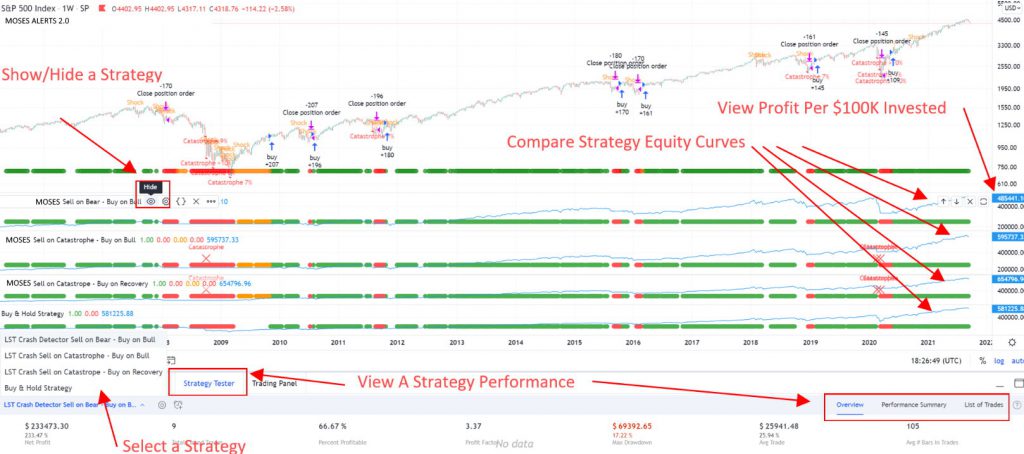
TradingView offers robust backtesting reporting, including trades, profit, loss, and capital drawdown, whereas StockCharts does not.
TradingView offers a backtesting system called Strategy Tester, but to develop original backtesting systems, you must acquire scripting skills using the proprietary Pine code. I have even implemented my MOSES ETF Trading strategy into TradingView; I am no developer, but the Pine Script language is so natural that anyone can do it.
🖱 Usability
TradingView and StocksCharts ACP are incredibly easy to use, requiring zero installation or configuration. Both platforms are easy for beginners and offer advanced features for more experienced traders.
🏁 Final Thoughts
TradingView is the best overall stock analysis and trading software, suitable for both beginners and experienced traders, with a vibrant community and excellent charting tools, as well as features like backtesting, scanning, and screening available globally. The rating section shows that TradingView equals or beats StockCharts in every category. The primary reason to use StockCharts is to access its market commentary from leading technical analysts and watch StockCharts TV videos.
If you need real-time news, the best backtesting, and stock chart indicators, I recommend MetaStock. Stock Rover is the best software for building long-term value, income, and growth portfolios. Ultimately, if you wish to leverage the power of AI for short-term day trading, Trade Ideas is the ideal choice.
FAQ
Is TradingView or StockCharts better for stock trading?
TradingView is better for stock trading from charts than StockCharts. TradingView integrates with over 50 brokers globally, whereas StockCharts does not have broker integration.
Is StockCharts better at pattern recognition than TradingView?
TradingView surpasses StockCharts in chart pattern recognition by detecting and scanning for 36 candlestick patterns and over 25 profitable chart patterns like double bottoms, head and shoulders, and wedges.
TradingView or StockCharts, which is better?
TradingView is better than StockCharts because it has 13 million active users, powerful interactive charting, flexible backtesting, and covers the global markets. Stockchart has none of these features.
Which is easier to use, StockCharts or TradingView?
Both StockCharts and TradingView are elegantly designed and intuitive to use. TradingView is more responsive and covers more assets and markets. StockCharts is easier to use but more basic in its application.
What is the big difference between TradingView and StockCharts?
The biggest difference between TradingView and StockCharts is that TradingView offers more features, including interactive charts and backtest strategies, while StockCharts focuses more on basic charting functions. TradingView boasts a greater range of assets and global markets covered than StockCharts.
Which is better for charting TradingView or Stockcharts?
TradingView offers much more in terms of charting capabilities than StockCharts with its interactive charts, broader selection of indicators and drawing tools and the ability to backtest strategies.
Does Tradingview cover more global markets than Stockcharts?
Yes, it does. Tradingview covers global markets compared and Stockcharts US only. TradingView provides access to over 30 stock, currency, and crypto exchanges, including the US, UK, Canada, Germany, Australia, and India. Stockcharts.com is for US stocks only.
Is TradingView or Stockcharts better for beginners?
Both platforms have their advantages for beginner traders, but TradingView is better for beginners due to its huge community sharing educational ideas. Stockcharts.com is also suitable for new traders because it offers basic, easy-to-use charting capabilities.
Is TradingView or Stockcharts better for stock screening?
TradingView is better for stock screening than Stockcharts because the experience is interactive, realtime, and covers global markets. TradingView screening auto-refreshes every minute, while Stockcharts.com is a manual process.