Welcome to this stock trading training course covering technical analysis. Technical analysis studies what has happened, what is happening, and what will happen in the future with asset prices. Analysis and prediction are performed using stock charts.
Technical analysis of stocks is a methodology used to study the price movement of securities over time to forecast future prices.
-
103-01 What is technical analysis of stocks?
Stock Market Technical Analysis is the study of supply and demand in the stock market, by comparing the history of stock price movements & volume.
-
103-04 Advanced Stock Charts Used By Pros
There are a few other types of charts that you probably have never heard of before. They are very useful; you would be required to learn them to become a certified Technical Analyst. Point and Figure (P&F) Charting A point and figure chart is a price chart that ignores time and focuses solely on price…
-
103-06 How To Do Stock Market Trend Analysis
Stock market trend analysis is the application of mathematics and charts, to imply a historic trend and potential future probability of the trend’s direction.
-
103-08 Elliott Wave Theory
Elliott Wave Theory is a way of predicting the movement of the stock market. It says that prices move in waves, and by understanding these waves you can better predict where prices are going to go.
-
103-09 Ichimoku Cloud Trading Strategy
Ichimoku clouds are a technical analysis tool used in stock trading and other investment fields. The clouds are composed of five lines that can be used to identify current trends, support and resistance levels, and price targets.
-
103-10 – 5 Important Stock Chart Indicators
The most popular and important stock chart indicators are moving averages, rate of change, relative strength, MACD, and stochastic. Using these indicators can provide insights into stock price trends and direction.
-
103-11 Moving Averages: How to Use & Calculate Moving Averages
Moving average indicators are used to automatically plot a moving trendline on a chart, which enables the analysis of stock trends and direction. Moving averages are a simple and popular stock chart indicator.
-
103-12 Volume – An Important Stock Chart Indicator
What is volume in stock charts? Volume is the number of securities traded within a certain time frame. It is usually represented by the size of the bars on a stock chart and can be used to measure the intensity of buying or selling pressure. Generally, a high volume indicates strong buying or selling pressure,…
-
103-13 MACD Explained: What Is MACD & How To Use It For Trading?
The MACD indicator is a technical analysis tool that is used to identify trend reversals and to measure the strength of a trend. It can be used on all time frames, from intraday to long-term charts.
-

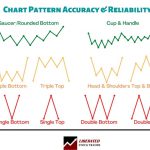
103-20 Do Chart Patterns Work? The Truth About Accuracy & Reliability
Chart patterns in technical analysis can be reliable and accurate, but they never work 100% of the time. Undoubtedly, stock chart patterns are a popular technical analysis tool, but do they actually work? Many traders swear by the accuracy and reliability of stock chart patterns, while others say they are nothing more than random noise.…
-
103-22 What Are Gaps in Stock Charts & How To Trade Them?
Gaps in stock charts are an incredibly predictive way to assess the possible direction of stock prices. Gaps show extreme fear or greed in investor sentiment and provide a unique buying or selling opportunity.
-
103-23 Fibonacci Trading: Using Fibonacci Strategy in Stocks
The Fibonacci sequence is a series of numbers that describe the natural world and are used in technical analysis to plot stock chart patterns. Italian mathematician Leonardo Pisano Fibonacci (1170-1250) introduced the Fibonacci sequence to the Western world, and his work was adopted by financial traders in the late 19th century.
-
103-28 Course 103: Technical Analysis in Stock Trading Summary
Course 103 Summary Summary In this course, we covered all of the core components of technical analysis. You now know all the significant stock chart types, how to configure a stock chart, and what indicators to use. You know how to plot trendlines, visualize price patterns, and the meaning of gaps and volatility. Congratulations on…
-
Course 101 Summary & Next Steps
Congratulations on completing Course 101 – Introduction to Investing. Over these lessons you have built a clear, structured understanding of how the investing world fits together. You have seen how stocks, funds, bonds, commodities, real estate, money markets, and currencies each play a different role in a portfolio, and how risk management and clear goals…
-
Course 103 – Stock Market Charting & Technical Analysis Course
Welcome to this stock trading training course covering technical analysis. Technical analysis studies what has happened, what is happening, and what will happen in the future with asset prices. Analysis and prediction are performed using stock charts. Technical analysis of stocks is a methodology used to study the price movement of securities over time to…
-
Our Free Stock Trading & Investing Training
Liberated Stock Trader offers free stock investing courses covering value, growth, dividend investing, and technical chart analysis. Our courses are developed by IFTA member and certified financial technician Barry D. Moore.


What does this technical analysis course cover?
Our training course on technical analysis of stocks covers various topics to help you better understand the stock market and how to trade successfully. We’ll start by looking at what technical analysis is and why it’s so important.
We’ll then discuss different types of stock charts and how to interpret them. Volume is another key consideration when trading stocks, so we’ll spend some time discussing using volume stock charts.
Next, we’ll look at the market direction and trends and introduce you to some of the most popular technical analysis theories, including Dow Theory, Elliott Wave Theory, and Ichimoku Cloud Trading Strategy.
Finally, we’ll wrap up with a look at some of the most important stock chart indicators, including moving averages, MACD, stochastic, and RSI.
By the end of this course, you’ll have a much better understanding of how to read and trade stocks using technical analysis. So let’s get started!
The purpose of this course is to provide an introduction to the basics of technical analysis, including how to read stock charts and use volume indicators to make informed investment decisions.
In addition, we will explore various market trends and theories that can be used for predicting future stock prices. By the end of this course, students should have a strong understanding of technical analysis and be able to apply it to their investment strategies.
What is technical analysis?
Technical Analysis is the study of supply and demand in the stock market by comparing the history of stock price movements and volume (the number of shares traded).
Understanding how the price moves in relation to the Open, High, Low, and Closing prices on a given minute, hour, day, week, month, or even year; then comparing the stock price movements to the volume can give an insight into future market direction.
The data required is usually displayed in a stock chart, so it is easily consumed and visualized.
In this course, you will learn:
- Exactly what is technical analysis?
- What charts are and how to use them
- How to draw trends lines
- How to use indicators and what the indicators mean
You will also learn how to evaluate market direction; this is very important.
This is a thorough Technical Analysis training course that will help you to get a good grasp of supply and demand and have a solid understanding of technical analysis.