The best technical analysis books leading industry bodies recommend are Technical Analysis of the Financial Markets, Technical Analysis Explained, Cloud Charts, and Forecasting Financial Markets.
We review 14 of the best technical analysis books that Chartered Market Technicians (CMTs) and Certified Financial Technical Analysts (CFTEs) study to qualify as professional technical analysts.
To master stock market technical analysis, sentiment, and stock charts, you must study the books used by professional technical analysts. These books help analysts land high-paying jobs with investment banks and advisory firms.
 The Best Technical Analysis Books
Do you want to successfully attempt to trade stocks, commodities, and foreign exchange currencies? If so, you need to study Technical Analysis (TA). TA is essentially the study of Supply and Demand, Volume, and Price through various lenses called stock charts.
Professional Market Technical Analysts like myself study for an IFTA (International Federation of Technical Analysts) exam or the Chartered Market Technician (CMT) exam, which are industry-recognized certifications.
1. The Encylopedia of Chart Patterns
The Encyclopedia of Chart Patterns by Tom Bulkowski details the reliability and success rates of 65 chart patterns and shows you how to trade them. It is an indispensable resource for traders and investors looking to increase profitability by taking advantage of stock chart patterns. This comprehensive reference book contains in-depth explanations and detailed illustrations of more than 65 pattern types, including how to trade highly profitable patterns like the Head and Shoulders, Double Bottoms, Wedges, Flags, Triple Bottom, and Triangle.
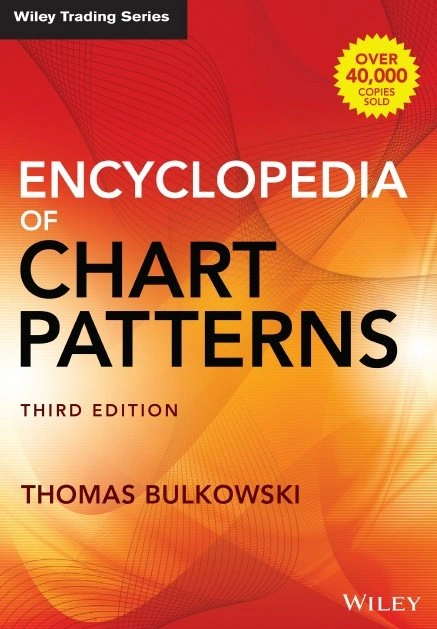
The book begins with an introduction to charting basics, including recognizing trends, support, and resistance levels and other technical analysis tools. It then discusses the various pattern types, offering clear descriptions of how to identify them in the markets and practical advice on when it is appropriate to act.
Complete with decades of chart pattern testing, The Encyclopedia of Chart Patterns is a critical resource for trading success.
2. Technical Analysis of the Financial Markets
John Murphy’s “Technical Analysis of the Financial Markets” is a comprehensive guide to using technical analysis to trade stocks, bonds, and commodities.
The book covers everything from interpreting charts and trend lines to advanced techniques such as Elliott Wave analysis. Murphy provides real-world examples to illustrate how technical analysis can be used to identify and trade market opportunities.
He also includes several helpful appendices, including one that lists all the indicators and oscillators used in the book.

This book is a precious contribution to understanding technical analysis of the financial markets. It is a must-have for learning technical stock charts, patterns, and indicators.
This book is a prerequisite reading for any serious or professional technical analyst and is a core IFTA exam syllabus for the (International Federation of Technical Analysts).
One of my favorite Technical Analysis reference books published by the New York Institute of Finance, this book is well presented and easy to understand.
It is a mind-blowing amount of information; however, it does not backtest the indicators to show their effectiveness in the practical world.
My thorough testing awarded TradingView a stellar 4.8 stars!
With powerful stock chart analysis, pattern recognition, screening, backtesting, and a 20+ million user community, it’s a game-changer for traders.

Whether you're trading in the US or internationally, TradingView is my top pick for its unmatched features and ease of use.
Explore TradingView – Your Gateway to Smarter Trading!
3. Technical Analysis Explained
This is one of the bibles of technical analysis. The author, Martin Pring, is a famous technical analyst, and the depth of its value is unmistakable.
This book is a prerequisite read for any serious or professional technical analyst. It is a core IFTA exam syllabus for the (International Federation of Technical Analysts) of which I am certified.

With 600 pages of detailed Technical Analysis, the content’s quality and quantity can be overwhelming.
Combining the best of this book and covering some fundamental analysis would provide an improved and more efficient way to learn. See the Liberated Stock Trader Book for this combination.
[Related Article: The 10 Best Stock Market Analysis Software Programs]
4. Cloud Charts
“Cloud Charts: Trading Success with the Ichimoku Technique” is the best book for trading with Japanese Ichimoku charts. Author David Linton is a trader and the author of two other books on technical analysis.
The Ichimoku Technique is a technical analysis method that relies on four indicators to determine when to buy or sell a security. The Ichimoku Technique can be used to trade stocks, futures, commodities, and forex.
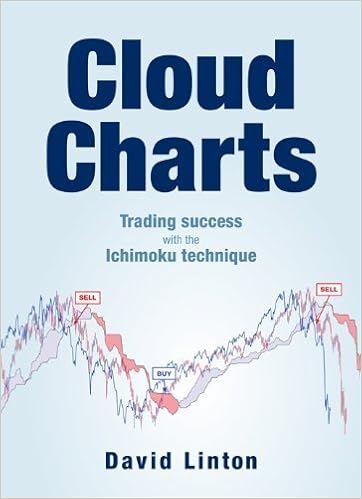
The book provides a detailed description of how cloud charts work and how they can be used together to make trading decisions.
It also includes case studies of how the technique is used for trading various securities. Overall, the book provides a comprehensive guide to using the Ichimoku Technique for trading success.
Recognized as an authority on Cloud Charts, David Linton’s book on Ichimoku Techniques is core IFTA reading.
5. Forecasting Financial Markets
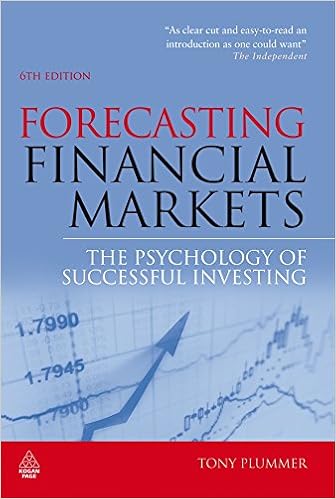
“Forecasting Financial Markets” by Tony Plummer is a guide to forecasting financial markets intended for individual and institutional investors. The book begins by discussing the importance of forecasting and describes different forecasting methods, including technical, fundamental, and sentiment analysis.
Each method is explained in detail, with examples of how it can be used to predict market trends. The book also includes a risk management section covering position sizing, risk tolerance, and hedging. Overall, “Forecasting Financial Markets” provides a comprehensive overview of financial forecasting and is a valuable resource for investors of all levels of experience.
6. Technical Analysis
The book “Technical Analysis: The Complete Resource for Financial Market Technicians” by Kirkpatrick & Dahlquist is a comprehensive guide to technical analysis. The book covers everything from the basics of technical analysis to more advanced concepts.
The authors provide real-world examples to help illustrate how technical analysis can be used in practice.

Overall, the book provides a thorough overview of technical analysis and is a valuable resource for anyone interested in this subject.
Uniquely and importantly, the book focuses on the flow of funds, system trading, money management, sentiment, and a brief look at statistics.
The book also covers backtesting and includes various academic studies to back up assertions—lots of charts and indicators and core reading for the CMT (Chartered Market Technician) Exam.
Try TradingView, Our Recommended Tool for International Traders
Global Community, Charts, Screening, Analysis & Broker Integration
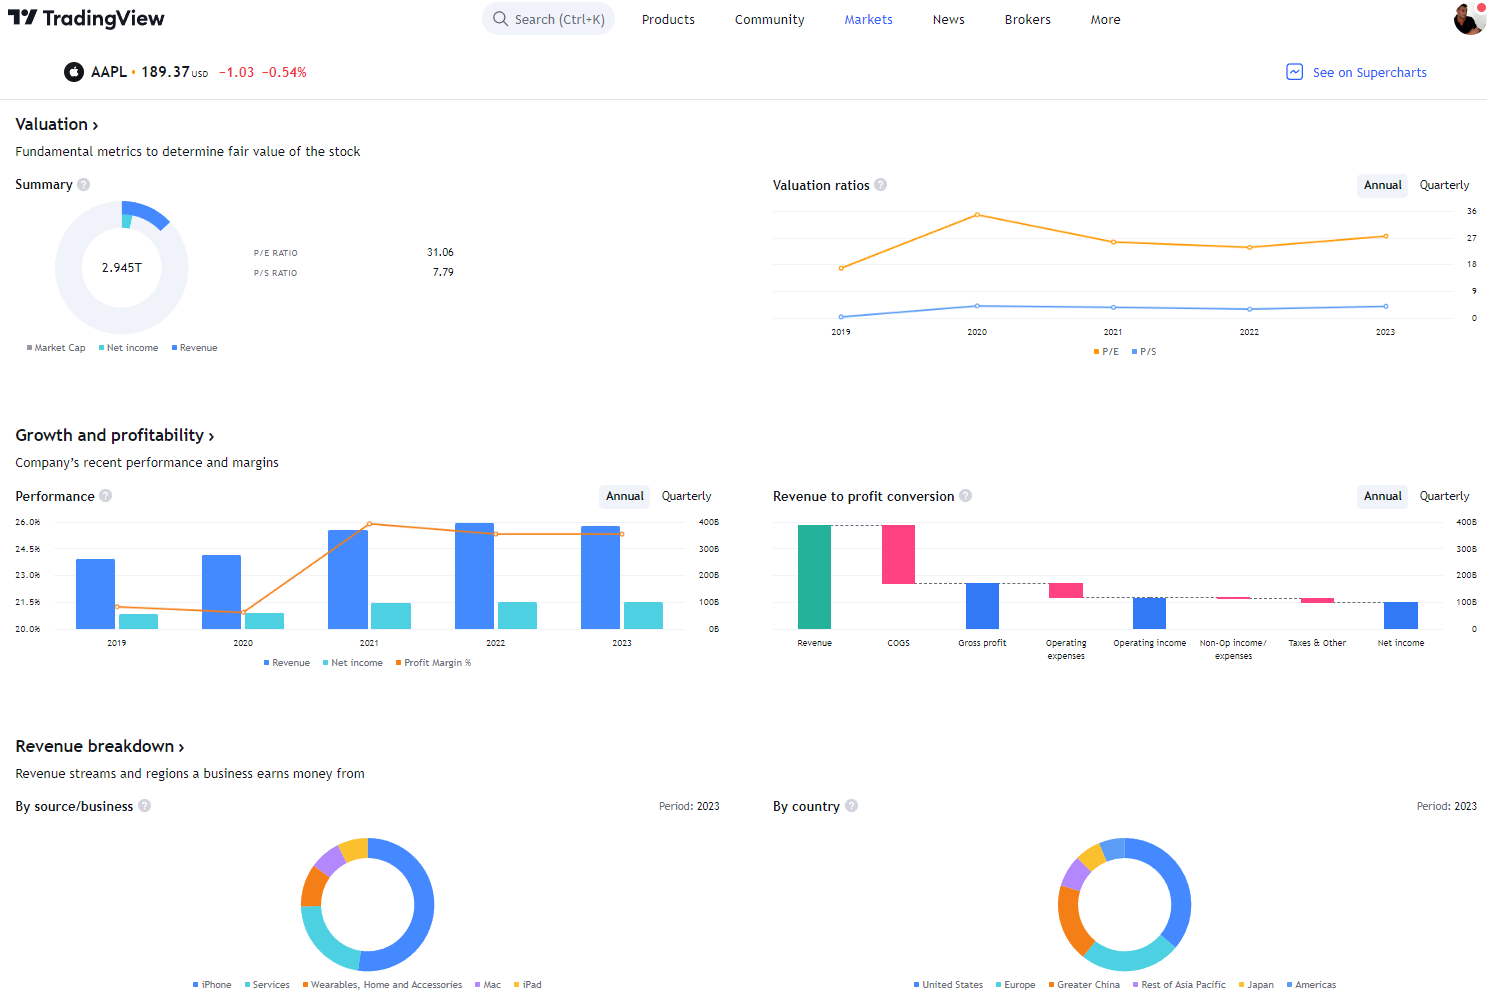
Global Financial Analysis for Free on TradingView
7. Japanese Candlestick Charting Techniques
From the man who introduced candlestick charting to the West, this is the updated 2nd edition of the original.
The book “Japanese Candlestick Charting Techniques” by Steve Nison is a guide to understanding and using candlestick charts to predict stock prices. The book introduces candlesticks and explains each candle’s different parts.

It then discusses using candlesticks to identify trends, reversals, and price patterns. The book includes several case studies to help illustrate how candlesticks can be used in real-world trading situations.
Candlestick charts are used routinely today and are an essential part of building your charting methodology.
Candlesticks give insights into short-term supply and demand scenarios and enhance the speed of pattern recognition.
8. The Definitive Guide to Point and Figure
The Definitive Guide to Point and Figure by Jeremy du Plessis is a book about the point and figure charting method. The book covers everything from how to set up a chart to identifying trendlines and formations.
It also includes several case studies demonstrating how point and figure can be used to spot opportunities in the market.
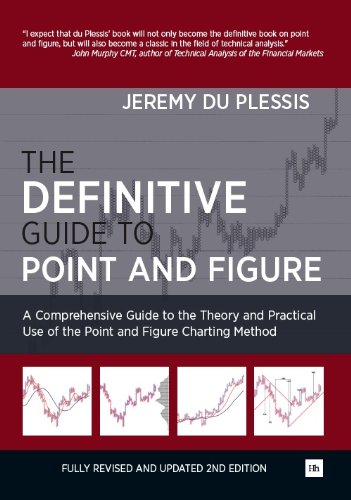
Understanding point and figure charting is essential to the IFTA certification, and there are questions in the exam paper on this topic. Point & Figure (P&F) was a real eye-opener for me.
A few major stock market analysis software offer P&F charts now as standard, which is a welcome resurgence of the technique. To see which software has P&F charts, read the article: What is Point & Figure Charting?
9. R N Elliott’s Masterworks
The book “R N Elliott’s Masterworks, the Definitive Collection by Robert Prechter” is a compilation of the work of R N Elliott, the father of Elliott Wave Theory. The book contains Elliott’s most important articles and covers everything from the basics of Elliott Wave Theory to advanced topics.
Overall, the book provides a comprehensive overview of Elliott Wave Theory and is a great resource for anyone interested in learning more about this unique approach to market analysis.

I had the pleasure of hearing Robert Prechter speak on socioeconomic theory at the IFTA World Conference in 2014, and he is a giant in the industry. This book compiles R.N. Elliott’s original writings on the Wave Principle and presents it to you in a single, all-inclusive book.
Devour the three ground-breaking works, long out of print, in which Elliott first described the Wave Principle to the world.
10. Ichimoku Charts
Ichimoku Charts is a book that teaches traders how to use Ichimoku Kinko Clouds technical analysis. The book is written by Nicole Elliott, a trader and technical analyst who has been using the Ichimoku method for over a decade. The book introduces Ichimoku Kinko Clouds, including what they are and how they are used.

Elliott then teaches readers how to interpret the various signals generated by the clouds, including crossovers, trendlines, and divergence indicators. The book concludes with a section on trading strategies that can be used with Ichimoku charts.
Overall, Ichimoku Charts is an in-depth guide to using the Ichimoku Kinko Clouds technique for technical analysis.
11. Breakthroughs in Technical Analysis
David Keller’s “Breakthroughs in Technical Analysis” is a guide to understanding and using technical analysis to trade the financial markets. The book begins by explaining the basics of technical analysis, including price charts, trendlines, and momentum indicators.

It then discusses more advanced topics such as chart patterns, Elliott wave analysis, and Fibonacci retracements. The book includes numerous real-world examples to illustrate how technical analysis can be used to identify trading opportunities.
It is a comprehensive guide for traders of all levels of experience.
The recommended section in this book is the GANN theory section developed by W.D. Gann.
This is usually a critical piece of the exam, but it can also be challenging to learn as the esoteric concepts, in theory, are more like taking a step into the twilight zone.
12. Mastering Hurst Cycle Analysis
Christopher Grafton’s “Mastering Hurst Cycle Analysis” provides an in-depth exploration of Hurst cycle analysis, a tool used to predict and trade financial market cycles.
The book introduces readers to the basics of Hurst cycle analysis, including defining a cycle, identifying cycles in data, and the four types of cycles.

Grafton then moves on to more advanced topics, such as cycle decomposition, statistical testing for cycles, and using Hurst cycle analysis for forecasting.
Throughout the book, Grafton provides numerous real-world examples to help illustrate the concepts being discussed.
Beat The Market, Avoid Crashes & Lower Your Risks
Nobody wants to see their hard-earned money disappear in a stock market crash.
Over the past century, the US stock market has had 6 major crashes that have caused investors to lose trillions of dollars.
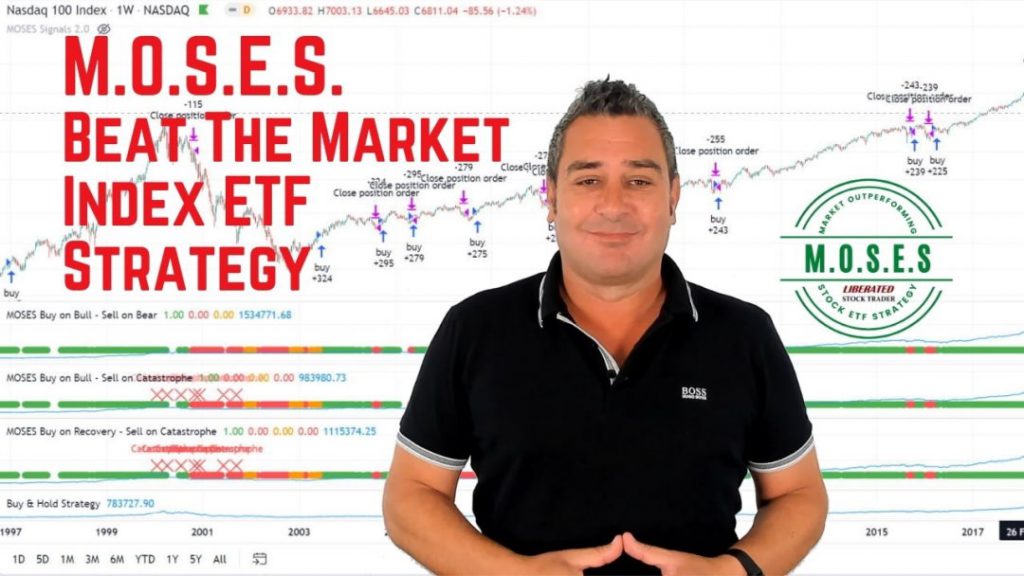
The MOSES Index ETF Investing Strategy will help you minimize the impact of major stock market crashes. MOSES will alert you before the next crash happens so you can protect your portfolio. You will also know when the bear market is over and the new rally begins so you can start investing again.
MOSES Helps You Secure & Grow Your Biggest Investments
★ 3 Index ETF Strategies ★
★ Outperforms the NASDAQ 100, S&P500 & Russell 3000 ★
★ Beats the DAX, CAC40 & EURO STOXX Indices ★
★ Buy & Sell Signals Generated ★
MOSES Helps You Sleep Better At Night Knowing You Are Prepared For Future Disasters
13. 21st Century Point & Figure
21st Century Point & Figure by Jeremy du Plessis is a guide to understanding and using point and figure charting in today’s markets.
Du Plessis covers the basics of reading point and figure charts and more advanced techniques like trendlines and breakouts. He also explains how to use point and figure charts in conjunction with other technical indicators to improve your trading results.
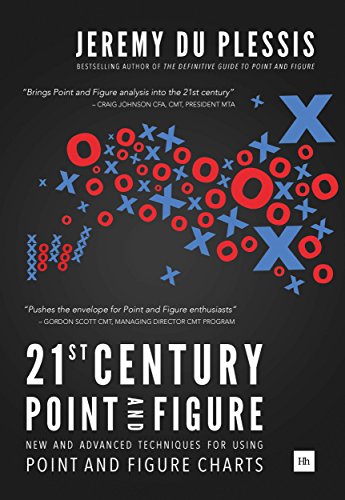
Overall, I found 21st Century Point & Figure a well-written, informative book. Du Plessis does a good job of explaining the mechanics of point and figure charting and provides plenty of real-world examples to help illustrate his points.
If you want a comprehensive guide to using point and figure charts in today’s markets, this book is for you.
14. Quantitative Trading Systems
Practical Methods for Design, Testing, and Validation.
Building a robust trading system is essential to success. This is precisely what Quants (Quantitative Analysts) do for their day job.
Quantitative Trading Systems by Dr. Howard B. Bandy is a book about developing and using quantitative trading systems in the financial markets. The book covers many topics, from basic concepts to more advanced strategies.

One of the key points made by the author is that a successful quantitative trading system is not simply a set of mechanical rules but must be tailored to the individual trader’s risk tolerance and investment goals. The book includes numerous examples and case studies to illustrate the concepts discussed.
FAQ
How to best learn technical analysis?
The best ways to learn technical analysis are through books or trading courses taught by industry-certified professionals. To get started, it's important to charting and indicators such as moving averages, trend lines, and support and resistance levels. Also, you need to understand strategic concepts such as risk management, trading psychology, and market timing.
What are the must-read books for technical analysis?
The must-read technical analysis books recommended by industry professionals are Technical Analysis of the Financial Markets by John J. Murphy and Technical Analysis Explained by Martin J. Pring.
What is the best book to learn technical analysis?
If I had to choose the best book on technical analysis, it would have to be John Murphy's Technical Analysis of the Financial Markets. This book is required CMT reading and a comprehensive guide to using technical analysis to trade stocks, bonds, and commodities.
Which book is called Bible of technical analysis?
The book commonly referred to as the "Bible of Technical Analysis" is none other than Technical Analysis of Stock Trends by Edwards & Magee. This book is widely regarded as the definitive text on technical analysis and provides an in-depth look at the fundamentals.
Does Warren Buffett use technical analysis?
No, Warren Buffett does not use technical analysis in his investing strategies. He has famously said on several occasions that he believes technical analysis is a "zero-sum game," meaning that it doesn't add any value to the market. Instead, Buffett relies solely on fundamental analysis when assessing stocks and companies. He is a long-term investor and does not make short-term trades based on technical indicators or trends.
Does technical analysis actually work?
Yes, technical analysis does work, and my extensive testing shows a good technical analysis strategy can achieve a win ratio of up to 70%. This means that 70 percent of trades you make should be profitable. The MOSES technical analysis system has a 70 percent win ratio.
Does JP Morgan use technical analysis?
Yes, JP Morgan uses technical analysis in its trading strategies. While the bank's traders are heavily focused on fundamental research and analysis, technical analysis is used to identify short-term market opportunities. JP Morgan also leverages quantitative methods, such as algorithmic trading, incorporating technical analysis.
Does anyone make money with technical analysis?
Yes, it is possible to make money with technical analysis. While there is no guarantee of success when using technical analysis, many traders have found success by focusing on longer-term trends and incorporating risk management strategies into their trades.
However, without proper technical analysis training and experience, it can be difficult for anyone to make profitable trades using this method consistently.
How often is technical analysis correct?
Generally, a good technical analysis strategy should achieve 60-70 percent accuracy rates. The accuracy of technical analysis depends on the quality of the strategy being used. Professional technical analysts use backtesting to quality-check the accuracy of the technical strategy.
What is the best book for learning cloud charts?
The best book to learn about cloud charts is "Ichimoku Charts: Ichimoku Charts" by Nicole Elliott. This book is required reading by the International Federation of Technical Analysts (IFTA) and is the perfect way to learn Japanese cloud charts.
What is the best book to learn Candlestick charts?
The book "Japanese Candlestick Charting Techniques" by Steve Nison is the best Japanese candlestick charting book. This guide to understanding and using candlestick charts to predict stock prices is recommended by the International Federation of Technical Analysts (IFTA).
What is the best book to learn Point & Figure charting?
The Definitive Guide to Point and Figure by Jeremy du Plessis is the ideal book for learning about point and figure charts. The book covers everything from how to set up a chart to identifying trendlines and formations and is recommended by the International Federation of Technical Analysts (IFTA).
Which book is best to learn Elliott Waves?
The best book for Elliott Waves is “R N Elliott’s Masterworks, the Definitive Collection by Robert Prechter.” This is a compilation of the work of R N Elliott, the father of Elliott Wave Theory. Prechter is an industry-leading technical analyst, and this book is the bible of Elliott Wave.
Which book is best to learn quant trading?
The best book to learn quantitative analysis is "Quantitative Trading Systems by Dr. Howard B. Bandy." This book will teach you how to develop quantitative trading systems in the financial markets. The book is recommended by the International Federation of Technical Analysts (IFTA).

best stock market books
I think this is the best website