The price-to-earnings ratio is one of those classic stock valuation tools. It gives you a direct way to judge if a company’s shares are reasonably priced compared to its profits. You’re basically comparing the current stock price to its earnings per share, so you can see how much people are actually willing to pay for every dollar the company earns.
This metric lets you make smarter decisions, whether you’re just starting out or you’ve been investing for years. It’s useful across all kinds of sectors and in different market environments.
You’ll need to understand both the basic formula and the context to actually use the PE ratio. Tools like TradingView let you see historical PE ratios right next to price charts, so you can spot how valuations have changed over time.
The ratio isn’t just about crunching numbers—it helps you see if stocks are overvalued or undervalued compared to their industry, their peers, or their own past averages.
Key Takeaways
- The PE ratio measures a stock’s price against its earnings per share, and it’s a core valuation metric for investors.
- You get the PE ratio by dividing the current share price by the company’s earnings per share.
- The PE ratio lets you compare valuations across companies and see if shares look reasonably priced.
What is the Price Earnings Ratio – PE Ratio
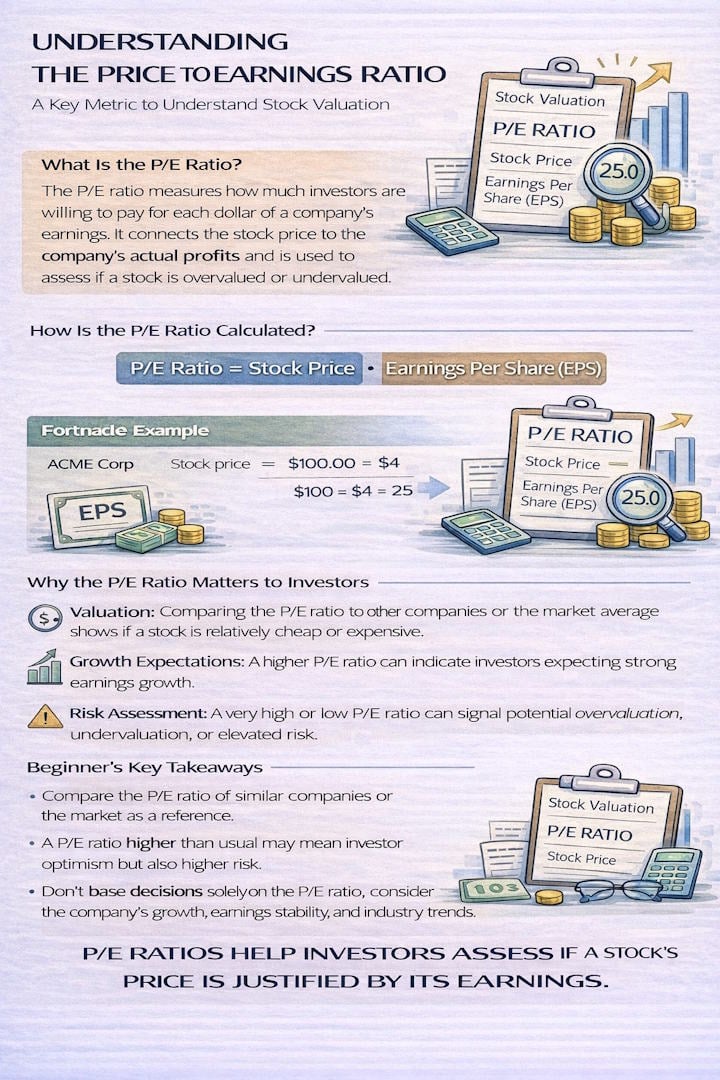
The price-to-earnings ratio (sometimes called the P/E ratio, PE ratio, PER, or earnings multiple) is a valuation metric. It measures a company’s stock price relative to its earnings per share.
You calculate this price multiple by dividing the current market price of a stock by its earnings per share over a set period.
As a stock valuation tool, the P/E multiple helps you figure out how the market values each dollar of a company’s earnings. If the ratio’s high, investors expect stronger growth ahead. If it’s low, maybe the market sees weaker prospects or a bargain.
You’ll usually use this valuation metric to compare companies in the same sector. Stock Rover is handy here—it gives you P/E data alongside other fundamentals for deeper screening.
The price-earnings ratio is a quick way to see if a stock trades at a premium or discount compared to similar companies. Understanding what the P/E ratio is helps you make more confident choices as you build your portfolio.
How to Calculate the PE Ratio
Here’s the P/E ratio formula: you divide the share price by earnings per share. That tells you how much you’re paying for each dollar of a company’s earnings.
P/E Ratio Formula:
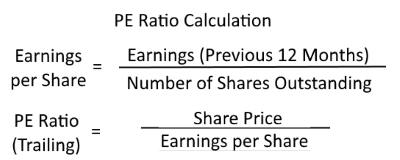
Price Per Share ÷ Earnings Per Share = P/E Ratio
You only need two numbers: the current price per share and the company’s EPS. To get EPS, you take net income and divide it by the number of shares outstanding.
Say a stock trades at $50 and the company reports an EPS of $5. The P/E ratio is 10. If another stock trades at $100 with an EPS of $20, the P/E is 5.
If you want a more conservative number, use diluted EPS—it factors in things like stock options and convertible securities. Or you can divide market cap by total net income for the same result.
Stock Rover lets you compare P/E ratios across companies instantly, so you don’t have to do this by hand.
Why is the PE Ratio Important?
You use the PE ratio to see if a stock trades at a fair value compared to its peers. By looking at this metric across companies in the same sector, you can spot undervalued or overvalued stocks based on their earnings.
Comparing Industry Valuations
If you find a company with a PE ratio way below its industry peers, that might point to an undervalued stock. If the ratio’s higher, investors could be expecting stronger earnings growth. Comparing companies like this gives you more context than just looking at one number.
Types of PE Ratios for Analysis
You’ll want to know the different versions:
- Trailing P/E Ratio: Uses actual earnings from the last 12 months.
- Forward P/E Ratio: Based on expected earnings for the next year.
- Relative P/E Ratio: Compares the current PE to its own historical range.
- Cyclically Adjusted Price-to-Earnings: Smooths out cycles by looking at longer periods.
Trailing P/E shows you confirmed results. Forward P/E looks at what analysts expect. Each type lets you see valuation from a different angle.
Understanding Investor Sentiment
The PE ratio really reflects how optimistic (or not) investors feel about a company’s future. A high ratio usually means people expect earnings to grow, or profit margins to expand.
Historical P/E benchmarks help you figure out if today’s valuations are typical, or if something unusual is happening.
You can use TradingView to see PE ratios along with other financial metrics, so you can compare across markets and sectors.
Limitations to Consider
The PE ratio gives you a snapshot, not a promise. Sometimes, companies justify high ratios with big growth, but there’s always risk. You might also check the earnings yield (just invert the PE ratio) to see returns relative to the share price.
Apple Inc. PE Ratio Illustration
Let’s look at Apple Inc. for a real-world example. As of early February 2026, Apple’s PE ratio sits around 34–35 based on trailing twelve-month earnings.
That’s down from 39.5 at the end of 2024. So, either the share price dropped, or earnings per share went up.
Current PE Ratio Metrics for Apple
| Metric | Value | Date |
|---|---|---|
| Trailing PE Ratio | 34.4 – 35.16 | February 2026 |
| Year-End 2024 PE | 39.5 | December 2024 |
| 5-Year Average Range | 27.09 – 33.69 | 2021-2026 |
Apple’s current valuation is above its five-year average. That suggests the market’s willing to pay a premium for Apple shares right now.
You can use TradingView to plot these PE changes over time and compare them with earnings per share, making it easier to spot patterns or see how Apple stacks up next to its sector.
The Shiller PE ratio for Apple, which smooths out earnings over ten years and adjusts for inflation, is 52.39. This number always runs higher than the standard PE because it averages things out over a longer period.
Analysts keep an eye on these numbers to see if shares look reasonably valued based on earnings power. When Apple’s PE ratio is 34–35, investors are paying that much for every dollar of annual earnings.
A Practical PE Ratio Example
Let’s make this more concrete. Imagine you’re looking at an ice cream shop worth $10,000 that brings in $2,000 a year in net profit. You’d need five years of profits to earn back your investment, so the PE ratio is 5 ($10,000 ÷ $2,000).
In the stock market, it works the same way, but everything’s on a per-share basis. Instead of the whole business and its total profit, you use the stock price and earnings per share.
This lets you evaluate partial ownership in public companies with the same logic.
The ratio tells you how much you’re paying for access to a company’s profits. If the number is high, market participants expect strong future performance. If it’s low, maybe the market’s cautious, or the stock’s undervalued.
With Stock Rover, you can quickly compare these numbers across a bunch of companies.
Context makes a big difference. Tech companies might trade at 30, utilities at 12. Neither is “better” without knowing the industry norms and growth outlook.
Comparing companies in the same sector gives you the best info. If two restaurant chains are similar but one trades at 18 and the other at 12, that higher multiple means investors expect more—maybe better management or stronger growth.
Example Chart: PE Ratio Apple Inc.

Try TradingView, Our Recommended Tool for International Traders
Global Community, Charts, Screening, Analysis, Broker Integration, Financial Metrics, Ratios & Analysis with TradingView

Global Financial Analysis for Free on TradingView
What is a Good PE Ratio?
Honestly, there’s no magic number for a “good” P/E ratio—it all depends on the industry and the company’s situation.
Take three companies in the same sector. One trades at a P/E of 50, which is the highest in its group; investors clearly expect big profit growth. Another is at 25, matching the industry average. A third sits at 5, maybe because it’s struggling—or maybe it’s a value investing play if earnings rebound.
Understanding P/E Levels:
- High P/E: The market expects strong future growth.
- Low P/E: Could mean the stock’s undervalued, or just has weaker growth prospects.
- Industry averages are your best reference point.
With Stock Rover, you can screen for P/E ratios and compare companies to their industry peers using detailed fundamentals. The P/E ratio works best as part of a bigger toolbox, not as your only metric.
Complete Framework for Understanding Price-Earnings Ratios
The price-earnings ratio shows you how a company’s stock price relates to its earnings per share. It’s a quick way to see how much you’re paying for each dollar of profit. If a stock is $50 and earns $5 per share, its PE ratio is 10.
Analysts use this ratio to judge if a stock trades at a reasonable value compared to similar companies. Lower ratios might mean a bargain; higher ones suggest investors expect growth. It’s most useful when you’re comparing companies in the same sector.
Calculating the Price-Earnings Ratio
Just divide the current market price by earnings per share. You can use the trailing twelve months’ earnings, or look ahead with analyst forecasts.
Trailing PEs use historical numbers. Forward PEs use estimates. Both have their place.
Platforms like Stock Rover give you a full view of current and historical PE values, so you can spot trends.
Industry Benchmarks Matter
Different sectors have different average PE ratios. Tech companies usually get higher multiples, since people expect rapid growth. Utilities and mature sectors tend to have lower ratios, reflecting slow but steady returns.
Comparing a stock’s PE to its industry average gives you context. If a company trades below its sector median, it might be a value—unless there’s a hidden problem.
Key Ratio Comparisons
| Metric | Focus | Best Used For |
|---|---|---|
| PE Ratio | Current valuation | Quick comparison screening |
| PEG Ratio | Growth-adjusted value | High-growth companies |
| Price to Book | Asset valuation | Capital-intensive businesses |
| Price to Sales | Revenue multiple | Unprofitable companies |
The price/earnings to growth ratio (PEG) goes a step further by factoring in expected earnings growth. That helps you decide if a high PE is justified or just hype.
Fundamental Analysis Integration
The PE ratio is just one piece of the puzzle. You should also check debt, return on investment, profit margins, and cash flow.
A company with low debt and strong returns might deserve a higher PE. High debt can make even a low PE risky if profits drop.
Limitations and Considerations
PE ratios don’t work for companies with negative earnings. For cyclical businesses, ratios can swing wildly depending on the profit cycle. One-off gains or losses can also throw off the numbers.
Always look at earnings quality before trusting the PE ratio. Sometimes, aggressive accounting makes profits look better than they are.
Practical Application Steps
Start by finding the stock’s current PE ratio and comparing it to its historical range. Looking at five-year averages helps you see if it’s trading above or below normal.
Then, benchmark against direct competitors and the wider industry.
Check analyst growth forecasts to calculate the PEG ratio—if it’s under 1.0, that might mean the stock is undervalued for its growth. Make sure debt isn’t too high, and that return on investment is solid.
Platforms like Seeking Alpha offer deep valuation analysis and peer comparisons, so you can streamline your research. Mixing quantitative screening with a qualitative look at the business gives you the best shot at making smart investment decisions.
Overview
The price-to-earnings ratio lets you compare a company’s stock price to its earnings per share. Investors often rely on this ratio to judge whether shares seem reasonably priced based on profitability.
Take the dot-com bubble, for example—when ratios shot up, that signaled the market was likely overvalued. If you want to dig deeper, tools like Stock Rover offer comprehensive ratio analysis and other financial metrics to help you really assess your investment options.
Class Questions & Answers
What does the Price-to-Earnings (P/E) ratio measure?
The P/E ratio measures how much investors are paying for each unit of a company’s earnings. It connects the stock price to profitability and is commonly used to judge whether a stock looks relatively expensive or cheap.
What is the basic formula for the P/E ratio?
P/E ratio = Stock Price ÷ Earnings Per Share (EPS). Investors should verify whether EPS is trailing (past 12 months) or forward (estimated future earnings) because that changes what the P/E represents.
What is the difference between trailing P/E and forward P/E?
Trailing P/E uses earnings from the past 12 months and reflects what the company already earned. Forward P/E uses estimated future earnings and reflects what the market expects the company to earn.
Why can a high P/E ratio be risky?
A high P/E usually means high expectations are priced in. If earnings growth disappoints or conditions worsen, the stock can fall even if the company remains profitable because the valuation “multiple” can shrink.
What is one common mistake investors make when using the P/E ratio?
A common mistake is comparing P/E ratios across very different industries or ignoring growth and risk. P/E is most useful when comparing similar companies, checking history, and combining it with fundamentals like earnings stability, cash flow, and debt.