Booms and busts are not bugs in the stock market—they’re part of how markets work. A boom-and-bust cycle is when the market experiences large increases and declines in value over time. For new investors, these swings can feel confusing or even frightening. But once you understand why booms and busts happen, you can stop reacting emotionally and start investing with a plan.
This lesson will give you a practical framework for identifying boom/bust phases, understanding what drives them, and—most importantly—knowing what to do (and what not to do) when prices get extreme.
Why do booms and busts occur?
Take, for example, the famous Dotcom boom of 2000. Greed surged into the stock market on the misplaced belief that new internet-based technology would fundamentally shift the future market dynamics and business models. Technology became fashionable, and “Bricks and Mortar” businesses were perceived as outdated and almost worthless. This paradigm shift meant that money poured into technology stocks at an unrepentant rate, and capital flowed out of “Bricks and Mortar” shares at an equal rate.
A telltale sign of problems to come was evident when stock analysts suggested price-to-earnings valuations of 200, 300, or more for tech stocks, which seemed reasonable even though the companies in question had never made a profit. The Price Earnings Ratio is the ratio of the Stock Price to its actual earnings.
If a P/E Ratio is at 30, it will take the company 30 years to earn back the share price. The higher the P/E ratio, the higher the expectation that the stock will perform well in the future. You can also view the P/E ratio as a measure of the stock’s value. If the P/E is 200, you essentially pay 200 times the company’s earnings capacity.
In the Year 2000, the P/E Ratio of the S&P500 reached nearly 45. This was an all-time high and essentially indicated that the market participants’ expectations were utterly unrealistic. By the time the inevitable correction was completed, the P/E ratio for the S&P500 had halved to just over 20.
Professional analysts and so-called market gurus fueled much of the greed and hype. They became greedy and euphoric, a heady mixture. When everyone slowly realized that the tech industry would not meet the enormous profit expectations, the entire sector collapsed, bringing other industries, indexes & markets with it. The Tech Bubble had burst.
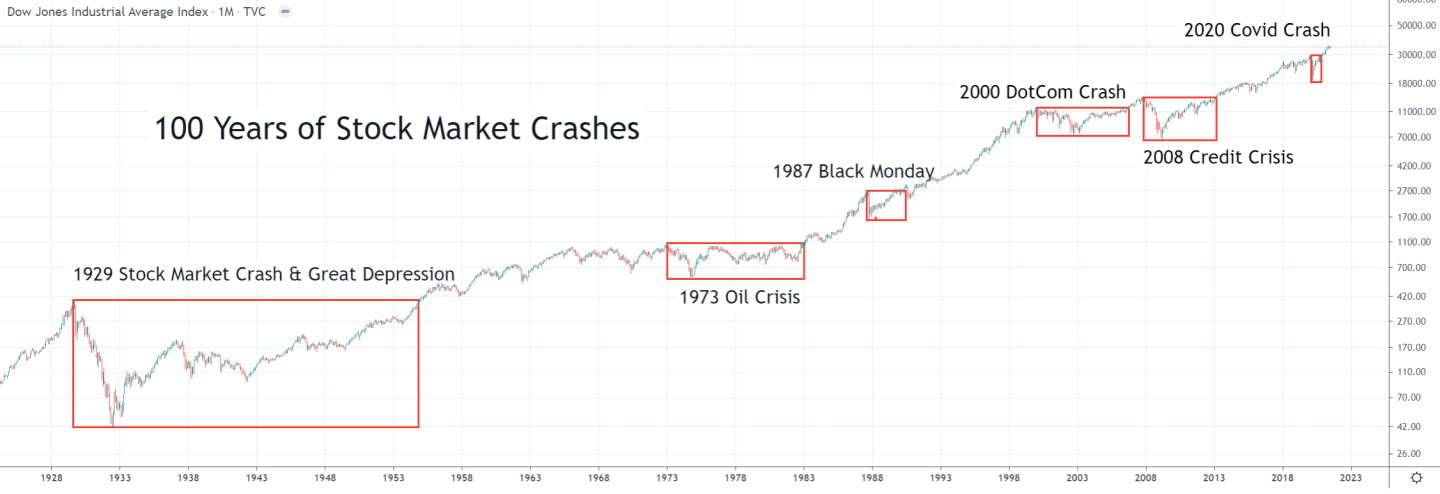
Stock market crashes and recoveries
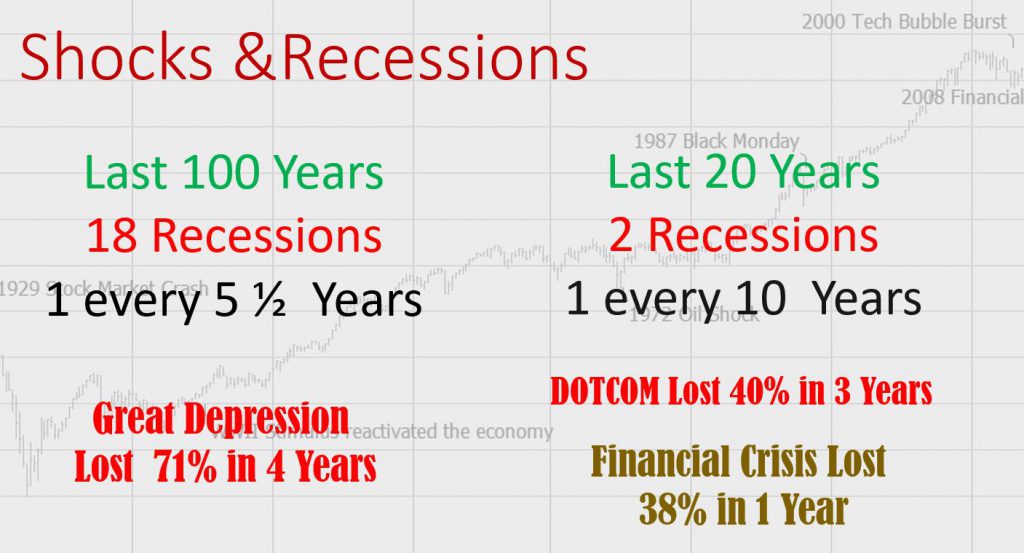
Our analysis of six major US stock market crashes in the last 100 years shows that it takes 9.8 years to recover. The average peak loss of these crashes was 57%. This can be somewhat misleading, though. The 1929 crash was exceptional in its size and duration. Additionally, governments and dovish central banks have realized that they can manage inflation and stimulate the economy to accelerate recovery from the economic and stock market crash.
Over the last 20 years, we have had three major crashes, with an average loss of 62% but an average recovery time of 7 years.
| Stock Market Crash (Year) | Size of Crash % | # Years to Recover |
| 1929 | -89% | 23 |
| 1973 | -46% | 10 |
| 1987 | -35% | 2 |
| 2000 | -83% | 16 |
| 2008 | -54% | 5 |
| 2020 | -38% | 1 |
| Average | -57% | 9.8 |
Table 1: Stock Market Crashes & Their Impact
Stock Market Crashes In History: A Timeline
Video: Stock Market Booms, Crashes & Crisis
Video From The Liberated Stock Trader Pro Masterclass Course
How does this affect our investments?
The boom is good for our investments in the short term, but only if we move into cash before the bust, which, of course, only the enlightened few ever manage to achieve.
So, who suffers the wrath of the bust? The private investor, you and I! We lost money in our pensions, mutual funds, and stock portfolios; we lost jobs, earning power, and risk appetite.
It seems that the time interval between the economic crisis and the boom-bust sequence is shortening, so it always pays to be wary. When every analyst is screaming “Buy Buy Buy” and acting like the best thing in the world is happening, that is the time to be most careful.
When all the market reports reiterate how depressing it is, how there is no future in the stock market, and prices have lost 20% or even 50% of their value, that could be one of the best times to buy.
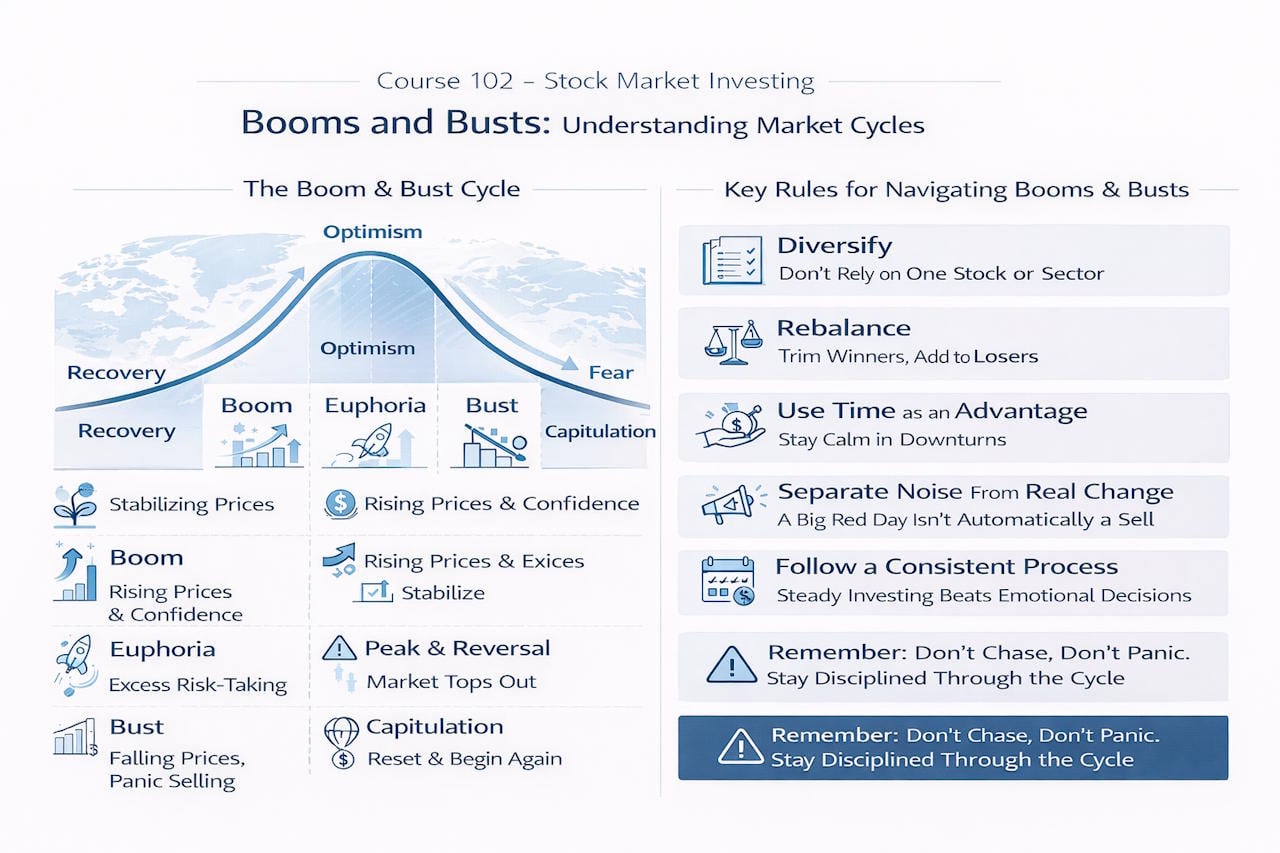
What a Boom-and-Bust Cycle Looks Like
A stock market cycle is a repeating pattern of expansion and contraction in prices and sentiment. Not every cycle looks the same, and cycles don’t follow a calendar. But most have recognizable phases:
- Early recovery: pessimism is still high, but bad news begins to “matter less,” and prices quietly stabilize.
- Expansion: earnings improve, liquidity is strong, confidence builds, and prices rise steadily.
- Euphoria / late boom: investors extrapolate good times forever; speculation grows; risk feels “safe.”
- Peak and reversal: something changes—rates, growth expectations, profits, geopolitics—and the market stops rising.
- Bust/contraction: selling accelerates, fear spreads, and prices fall quickly (often faster than they rose).
- Capitulation and reset: valuation becomes attractive again, weak businesses wash out, and the next cycle begins.
A key beginner insight: the cycle is driven as much by investor psychology as by economics. Markets are forward-looking. They move on expectations—often long before the economy shows the same change.
Why Booms Happen: The Core Drivers
Booms are usually driven by a combination of real improvements (fundamentals) and rising willingness to take risks (sentiment). Common boom drivers include:
Improving fundamentals
- Company revenues and profits rise
- Business outlook strengthens
- Unemployment falls, and consumption grows
- Productivity or innovation improves (new tech, new industries)
When businesses earn more, the market has a rational reason to rise. Over long periods, corporate earnings power is the foundation of stock returns.
Easier financial conditions
Booms often coincide with:
- Lower interest rates
- Easier credit availability
- Strong liquidity (money flowing into financial assets)
Lower rates can boost stock prices in two ways: they reduce borrowing costs for companies and make future profits more valuable in today’s terms.
Positive narrative and momentum
As prices rise, stories spread:
- “This time is different.”
- “We’ve entered a new era.”
- “The old rules don’t apply.”
Momentum attracts new buyers. New buyers push prices higher. Higher prices validate the narrative. This feedback loop can produce strong gains—sometimes far beyond what fundamentals alone justify.
Why Busts Happen: The Core Triggers
Busts usually start when market expectations become overly optimistic, and reality fails to keep up. Triggers can be different each time, but common ones include:
Tightening financial conditions
- Interest rates rise
- Credit becomes harder to access
- Liquidity dries up
When money becomes “more expensive,” risk assets often reprice downward.
Profit disappointment
The market doesn’t fall just because earnings are bad—it falls when earnings are worse than expected. If prices already assume strong growth, even “good” results can be a letdown.
Leverage and forced selling
Leverage (borrowing to invest) amplifies cycles:
- During booms, leverage increases returns and confidence.
- During busts, leverage forces liquidation, accelerating declines.
This is why crashes often look sudden: once forced selling begins, the market can gap downward quickly.
Loss of trust or a shock event
A shock can be:
- Banking stress
- A geopolitical conflict
- A policy surprise
- A major corporate scandal
- A sudden economic slowdown
The shock matters because it changes expectations. Markets move first; the economic data often follows later.
The Role of Human Behavior: Fear, Greed, and the “Cycle Trap”
Most beginners don’t fail because they can’t read charts. They fail because they do the exact wrong thing at the exact wrong time:
- In a boom, prices feel safe → people buy more (often near the peak).
- In a bust, prices feel dangerous → people sell (often near the bottom).
This pattern is natural. It’s also expensive.
Here are the most common behavioral traps:
Performance chasing
Buying something because it has already risen a lot. This can work briefly, but it often ends with buying near the top—when the risk is highest.
Panic selling
Selling because prices fell quickly, and you want the pain to stop. But selling after big declines locks in losses and removes your ability to benefit from the recovery.
All-in/all-out thinking
Cycles punish extremes. A boom tempts you to go “all in.” A bust tempts you to go “all out.” Long-term investing works better with position sizing, diversification, and discipline.
Recognizing a Boom Before It Breaks
No one can time tops perfectly, but investors can learn to recognize “late-cycle” characteristics that often appear in booms:
- Valuations detach from realistic earnings assumptions
- Speculation becomes normal (“everyone is doing it”)
- Risky assets outperform safer assets dramatically
- New investors flood in, often driven by hype
- Media and social feeds become dominated by market talk
- People stop discussing risk and focus only on upside
The point isn’t to predict the exact day of the top. The point is to avoid acting, as the boom will last forever.
A good novice rule: when optimism feels universal, your job is to tighten your process—not loosen it.
Recognizing a Bust When It’s a Buying Opportunity
Busts are emotionally brutal because they feel like they will never end. But busts are also when future returns can become attractive—because prices fall faster than long-term earnings power changes.
Signs the bust may be moving toward a reset phase:
- Selling becomes indiscriminate (good companies fall with bad ones)
- Bad news stops pushing prices down as much (“market stops reacting”)
- Valuations return to historically reasonable ranges
- Long-term investors begin to re-enter quietly
Again, you don’t need to “call the bottom.” You need a plan that works even if you don’t know where the bottom is.
Practical Investing Rules for Surviving Booms and Busts
Here are the core habits that help beginners succeed through cycles:
Diversify intentionally
Don’t rely on one stock, one sector, or one country. Diversification reduces the risk that a single bust destroys your plan.
Use time as your advantage
If your horizon is 10–20 years, short-term busts matter less—unless you panic and sell.
Keep a cash/defensive buffer if you need it
If you’ll need money soon (1–3 years), it may not belong in volatile stocks. Matching money to time horizon is a form of risk control.
Prefer a repeatable process over predictions
A simple monthly investing plan (consistent contributions) often beats emotional decisions—even if it feels boring.
Rebalance (don’t chase)
Rebalancing means trimming what has grown too large and adding to what has lagged—systematically. It is the opposite of performance chasing.
Separate market noise from fundamental change
A big red day is not automatically a reason to sell. A permanent change to a company’s earnings power might be. Beginners should learn the difference.
The Goal: Staying Invested Through the Cycle
Booms and busts will continue because markets are made of humans, and humans swing between optimism and fear. Your edge as a long-term investor is not perfect timing—it’s staying disciplined when the crowd is emotional.
If you can avoid the two classic mistakes—buying late in a boom out of excitement, and selling deep in a bust out of fear—you’ve already put yourself ahead of most new investors.
Moses helps you avoid stock market crashes
Beat The Market, Avoid Crashes & Lower Your Risks
Nobody wants to see their hard-earned money disappear in a stock market crash.
Over the past century, the US stock market has had 6 major crashes that have caused investors to lose trillions of dollars.

The MOSES Index ETF Investing Strategy will help you minimize the impact of major stock market crashes. MOSES will alert you before the next crash happens so you can protect your portfolio. You will also know when the bear market is over and the new rally begins so you can start investing again.
MOSES Helps You Secure & Grow Your Biggest Investments
★ 3 Index ETF Strategies ★
★ Outperforms the NASDAQ 100, S&P500 & Russell 3000 ★
★ Beats the DAX, CAC40 & EURO STOXX Indices ★
★ Buy & Sell Signals Generated ★
MOSES Helps You Sleep Better At Night Knowing You Are Prepared For Future Disasters
Class Questions & Answers
What is a boom-and-bust cycle in the stock market?
A boom-and-bust cycle is a pattern in which stock prices rise strongly during a boom and then fall sharply during a bust, often driven by changes in expectations, liquidity, and investor psychology.
Why can stock markets rise even before the economy “looks good” in the news?
Markets are forward-looking. Prices move based on expectations about future earnings and conditions, so they can recover before economic data improves and before headlines turn positive.
What are two common causes that can trigger a market bust?
Two common triggers are tightening financial conditions (like rising interest rates or reduced liquidity) and profit disappointment (earnings coming in worse than the market expected).
What is the “cycle trap” that causes many beginners to lose money?
The cycle trap is buying late in a boom because prices feel safe and selling during a bust because prices feel scary. This reverses the logic of successful investing and often locks in poor outcomes.
Name one practical rule that helps an investor survive booms and busts.
One strict rule is to follow a repeatable process—like consistent investing and periodic rebalancing—rather than making decisions based on emotions or short-term headlines.