
Financial statements are the core reports a company publishes to show what it owns, what it owes, how much it earned, and how it used cash. If you want to invest with confidence (instead of guessing), you need to know how to read these statements at a practical level—enough to spot strength, weakness, and common warning signs.
This lesson will walk you through the four key financial statements, how they connect, and a simple method for reading them without getting overwhelmed.

What Are Financial Statements?
A financial statement is a formal document that summarizes a company’s financial position and performance over a period of time. Public companies publish these regularly (quarterly and annually), and they are the backbone of fundamental analysis.
Most investors focus on four statements:
- Balance Sheet
- Income Statement
- Cash Flow Statement
- Statement of Shareholders’ Equity
Together, these statements answer four essential questions:
- What does the company own and owe?
- Is it profitable?
- Is it generating real cash?
- Is shareholder value growing over time?
Why Financial Statements Matter to Investors
Financial statements matter because they let you evaluate a company using evidence, not hype. They help you answer practical investing questions like:
- Can this company survive a downturn?
- Are profits growing, stable, or falling?
- Is the business funding growth with cash or through borrowing?
- Is debt getting risky?
- Is the company quietly diluting shareholders by issuing new shares?
They also allow comparisons:
- Company vs. its own past (trend analysis)
- Company vs. competitors (peer comparison)
- Company vs. the broader market (quality and valuation context)
How to Read Financial Statements Without Getting Lost
A common beginner mistake is reading statements “top to bottom” like a story. A better approach is reading them like a diagnostic checkup: start with the big picture, then drill into the areas that matter.
Here’s a beginner-friendly sequence:
- Start with the Balance Sheet (stability and risk)
- Move to the Income Statement (profitability and growth)
- Confirm with the Cash Flow Statement (cash reality check)
- Finish with Shareholders’ Equity (owner value and dilution)
Then do a quick pass for red flags (covered below).
The Four Financial Statements and What Each One Tells You
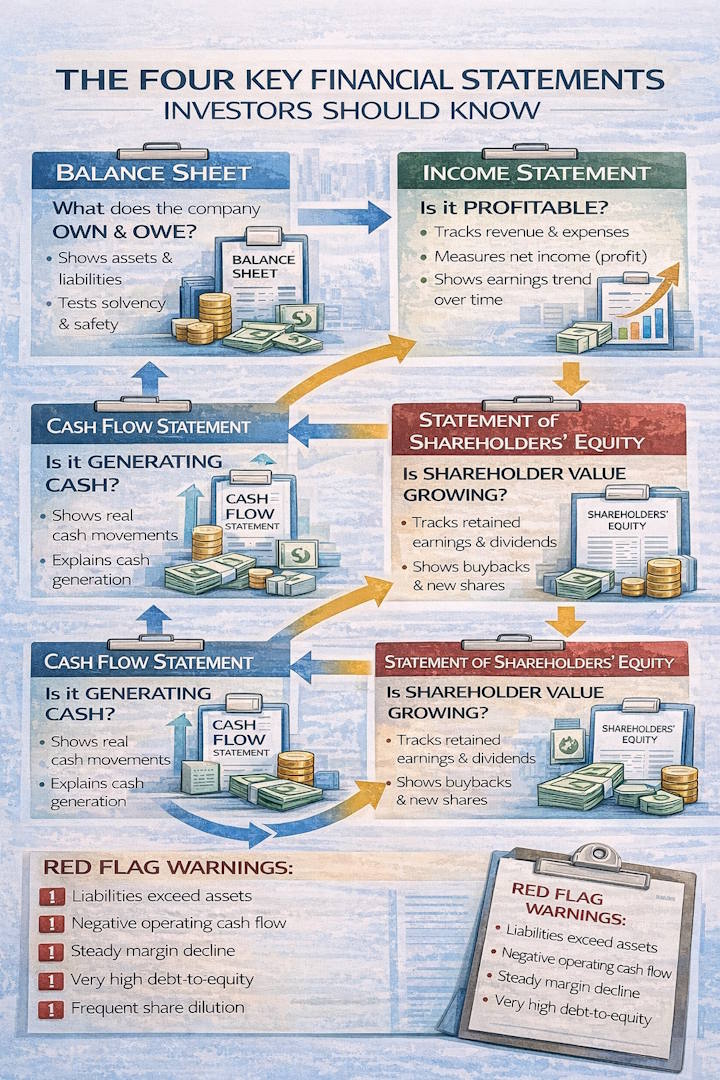
The four financial statements are the balance sheet, income statement, cash flow statement, and statement of shareholders’ equity.
- The balance sheet shows a company’s assets, liabilities, and equity.
- The income statement shows a company’s revenue, expenses, and net income.
- The cash flow statement shows a company’s cash inflows and outflows.
- The statement of shareholders’ equity shows a company’s changes in equity over time.
The Balance Sheet
The balance sheet is a snapshot of a company’s financial position at a specific point in time. It shows the company’s assets, liabilities, and equity. Assets are resources that the company owns or controls, such as cash, inventory, property, and equipment. Liabilities are debts or obligations the company owes to others, such as loans or accounts payable. Equity represents the owners’ claims on the company’s assets.
The balance sheet is a snapshot at a specific point in time. It shows:
- Assets: what the company owns or controls
- Liabilities: what it owes
- Equity: what is left for shareholders after paying obligations
The balance sheet follows the accounting equation:
Assets = Liabilities + Equity
This matters because it forces clarity: every asset is funded either by debt (liabilities) or by owners (equity).
What to look at as a beginner
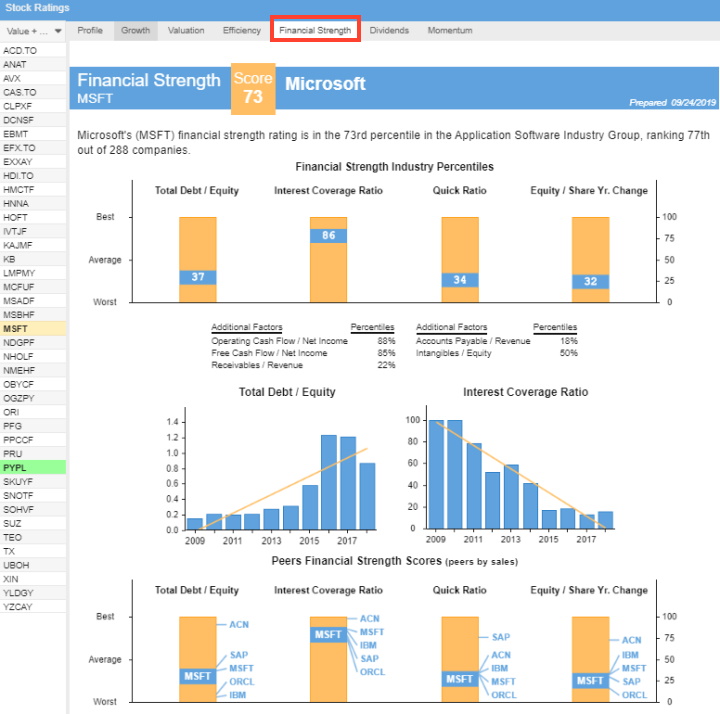
- Liquidity: Does the company have enough current assets (cash, receivables, inventory) to cover current liabilities (bills due soon)?
- Debt load: Is long-term debt large relative to the company’s size and profits?
- Quality of assets: Are assets mostly cash and productive assets—or “soft” accounting items that may not hold value in a crisis?
Simple interpretation
- A strong balance sheet gives a company flexibility.
- A weak balance sheet forces bad decisions when conditions turn negative (selling assets, raising expensive debt, diluting shareholders).
The balance sheet follows the basic accounting equation: assets = liabilities + equity. This means that for every dollar in assets, there must be an equal amount in liabilities and equity. The balance sheet is important because it provides investors with information about a company’s financial health and ability to meet its short-term and long-term obligations.
Income Statement
The income statement, also known as the profit and loss statement, shows a company’s revenue and expenses over a specific period. Revenue is the money a company earns from selling its products or services, while expenses are the costs incurred in running the business. The bottom line of the income statement shows whether a company made a profit or incurred a loss during the specified period.
The income statement (also called the profit & loss statement) shows performance over a period (quarter or year). It summarizes:
- Revenue (sales)
- Expenses (costs to operate)
- Net income (profit after expenses)
What to look at as a beginner
- Revenue trend: Is the company growing sales consistently?
- Profitability trend: Are profits improving, stable, or shrinking?
- Margins: Is the company keeping more profit per dollar of sales (good) or less (warning)?
A key concept: profit is not just about “more revenue.” If costs rise faster than sales, profit can fall even while revenue rises.
Cash Flow Statement
The cash flow statement tracks cash inflows and outflows into and out of a company over a specific period. It provides information on where the cash comes from (cash inflows) and how it is used (cash outflows). This helps investors understand how well a company manages its cash and if it has enough liquidity to cover its expenses and investments.
The cash flow statement is divided into three sections: operating activities, investing activities, and financing activities. Operating activities include the cash flows from a company’s primary operations, such as sales of products or services. Investing activities include cash flows from buying or selling assets, such as property or equipment. Financing activities involve borrowing money (cash inflow) or repaying debt (cash outflow), as well as issuing stock (cash inflow) or paying dividends (cash outflow).
Accounting rules can distort profit. Cash flow shows the money movement more directly.
The cash flow statement tracks cash in and cash out over a period and is split into three sections:
- Operating activities: cash generated (or consumed) by core business operations
- Investing activities: cash spent on or received from assets (equipment, acquisitions, investments)
- Financing activities: cash from borrowing, repaying debt, issuing shares, or paying dividends
Why is this statement crucial
A company can show accounting profits while running out of cash. Cash flow helps you confirm whether profits are “real” in an operational sense.
Beginner checks
- Is operating cash flow positive and generally rising over time?
- Is the company constantly raising debt or issuing shares just to stay afloat?
- Are big investing outflows creating long-term value (expansion) or covering problems?
Statement of Shareholders’ Equity
The statement of shareholders’ equity is a financial statement showing changes in a company’s stockholders’ equity over time. Stockholders’ equity, also known as shareholders’ equity or simply “equity,” is the amount of money that would be returned to shareholders if all of the company’s assets were liquidated and all its debts were paid off.
This statement begins with the balance of retained earnings, the accumulated profits reinvested in the company rather than distributed to shareholders as dividends. It then shows any changes to this balance due to net income or loss, dividends paid, and adjustments for accounting errors or changes in accounting principles.
The statement of shareholders’ equity explains how the “owners’ claim” changed over time. It commonly includes:
- Beginning equity balance
- Net income added (profits increase equity)
- Dividends subtracted (cash paid out reduces equity)
- Share issuances and buybacks (can dilute or concentrate ownership)
- Adjustments and accounting items
Why this matters
Two companies can have the same profit, but one might be issuing new shares constantly, reducing the per-share value for existing owners. Equity changes help you spot that.
How the Financial Statements Connect
These statements are not separate islands—they are linked:
- Net income from the income statement impacts retained earnings on the shareholders’ equity statement.
- Retained earnings (part of equity) appear on the balance sheet.
- Cash on the balance sheet changes based on the net cash flow shown on the cash flow statement.
- Investing and financing choices (cash flow statement) often show up as changes in assets and liabilities (balance sheet).
A practical way to think about it:
- Income statement: “Did we make money?”
- Cash flow statement: “Did we generate cash?”
- Balance sheet: “Are we financially safe?”
- Equity statement: “Did owners actually benefit per share?”
How to read financial statements
Reading financial statements can be tricky, but with a little practice, you’ll glean a lot of important information from them. Here are some tips for reading financial statements:
- Start by looking at the balance sheet. This will give you a snapshot of a company’s assets, liabilities, and equity.
- Look at the income statement. This will show a company’s revenue, expenses, and net income.
- Finally, take a look at the cash flow statement. This will show you a company’s cash inflows and outflows.
- Once you’ve reviewed all three financial statements, you’ll understand a company’s financial position and performance well.
Stock Rover 4.7/5⭐ : My Top Pick for Smart Investors
Investing In Stocks Can Be Complicated. Stock Rover Makes It Easy.
★
Growth Investing - with industry-leading
Research Reports ★
★ Value Investing - using Warren Buffett's Fair Value and Margin-of-Safety ★
★ Income Investing - rank by yield, growth, quality, and safety using 650 metrics ★
"I have been researching and investing in stocks for 20 years! I now manage all my long-term investments using Stock Rover." — Barry D. Moore, Founder: LiberatedStockTrader.com
Red Flags Beginners Should Learn to Spot
Here are straightforward warning signs you can identify even without advanced accounting knowledge:
- Liabilities exceed assets: can signal serious financial stress and limited solvency.
- Expenses consistently exceed revenue, which suggests the business model is not currently sustainable.
- Negative cash flow (especially operating cash flow) can indicate the business is burning cash to operate.
- Debt-to-equity is very high: leverage may be excessive, increasing default risk if earnings decline.
- Shrinking margins over multiple periods: potential competitive pressure or cost problems.
- Rising receivables faster than revenue: possible collection issues or aggressive revenue recognition.
- Share dilution: frequent share issuance can weaken per-share returns even if the company “grows.”
Red flags don’t automatically mean “never invest.” They mean “slow down, investigate, and demand a stronger margin of safety.” [Try our Margin of Safety Calculator]
Consolidated Financial Statements
Many companies own subsidiaries. Consolidated financial statements combine the financial results of the parent company and its controlled subsidiaries into one set of statements.
This matters because:
- A parent company can appear strong on its own, while a subsidiary carries heavy debt or losses.
- Consolidation shows the economic reality of the whole corporate group.
As an investor, you want the full picture.
Interim Financial Statements: Quarterly Reality Checks
Annual statements show the big picture, but interim statements (quarterly or semi-annual) help you track progress and detect changes early.
Interim reports are useful to monitor:
- Liquidity changes (cash and short-term obligations)
- Profit trends (improving or deteriorating)
- Debt changes (borrowing or repayments)
- Cash flow stability (especially operating cash flow)
A beginner habit that works: compare the latest quarter to the same quarter last year to reduce seasonal distortion.
Where to Find Common Items in the Statements
Where are short-term investments listed?
Short-term investments typically appear on the balance sheet under current assets (alongside cash, receivables, and inventory).
Where is the inventory listed?
Inventory appears on the balance sheet under current assets. Inventory matters because it can become obsolete, require write-downs, and distort reported profits if not managed well.
Where does depreciation appear?
Depreciation shows up on:
- the income statement as an expense (reducing accounting profit), and
- The cash flow statement has a non-cash adjustment (added back in operating cash flow)
Depreciation is important because it reflects the cost of using long-lived assets over time, even though it doesn’t directly consume cash in the period it’s recorded.
Management’s Responsibility for Financial Statements
Management is responsible for preparing and presenting financial statements that are accurate and compliant with accounting rules (such as GAAP or IFRS). Investors rely on these statements when making decisions, so credibility, consistency, and transparency matter.
A practical investor mindset:
- Trust the statements, but verify patterns.
- If numbers swing strangely or communication becomes vague, treat it as a signal to investigate further.
A Simple “One-Pass” Method You Can Use Every Time
When you look at a company for the first time, do this:
- Balance sheet: Check cash, current liabilities, and total debt.
- Income statement: Look for revenue growth and stable margins.
- Cash flow: Confirm operating cash flow is healthy and consistent.
- Equity statement: Check for dilution and retained earnings growth.
- Red flags: Scan for solvency, cash burn, and leverage problems.
This method won’t make you an accountant—but it will prevent many beginner mistakes and help you focus on the companies that deserve deeper research.
What are consolidated financial statements?
Consolidated financial statements are financial statements that include the financial results of a parent company and its subsidiaries. When a parent company owns a majority stake in a subsidiary, the two companies are considered to be consolidated. Consolidated financial statements provide a complete picture of a company’s financial position and performance. They can be used to assess the overall health of a company and its subsidiaries and make informed investment decisions.
How are financial statements used in decision-making?
Financial statements are often used in decision-making. They can help investors, lenders, and other stakeholders assess a company’s overall health and make informed investment decisions. Financial statements are also used to
What are interim financial statements?
Interim financial statements are financial statements that are not prepared on a company’s annual basis. They are generally compiled every three or six months and can be used to track a company’s progress over time and make informed decisions about its future. Interim financial statements can assess a company’s liquidity, solvency, and profitability. They can also be used to compare companies in the same industry.
Where can you find short-term investments on financial statements?
Short-term investments are listed on a company’s balance sheet under the category of “current assets.” They are less risky than long-term investments and can generate income or finance short-term needs.
Which financial statements show depreciation expense?
The income statement and cash flow statement show depreciation expenses. The depreciation expense is listed under the category of “expenses.” Depreciation is a non-cash expense that does not affect a company’s cash flow. Depreciation is used to match the cost of an asset with the revenue that it generates.
What are management’s responsibilities regarding financial statements?
Management is responsible for preparing and presenting accurate, informative financial statements in accordance with generally accepted accounting principles (GAAP) and for ensuring that the company’s financial statements are free of material misstatement.
Where to find inventory on financial statements?
Inventory is listed under the category of “current assets” on a company’s balance sheet. It represents the goods a company has on hand and available for sale. It is important to note that inventory can be subject to depreciation and other valuation adjustments.
In the next lesson, we will explore the income statement.
Class Questions & Answers
What are the four main financial statements investors use, and what does each one show?
The balance sheet shows what a company owns and owes at a point in time. The income statement shows revenue, expenses, and profit over a period. The cash flow statement shows cash in and out (operating, investing, financing). The statement of shareholders’ equity shows how owners’ equity changed over time, including profits, dividends, and share issuance/buybacks.
Why is the cash flow statement so important compared to profit alone?
Because accounting profit can be influenced by non-cash items and timing rules. Cash flow reveals whether the business is actually generating cash from operations and whether it’s relying on debt or new shares to survive.
What does “Assets = Liabilities + Equity” mean in simple terms?
It means everything the company owns is funded either by borrowing (liabilities) or by owners’ capital and retained profits (equity). This equation is the foundation of the balance sheet.
Name three red flags a beginner can spot quickly in financial statements.
Examples include liabilities exceeding assets (solvency risk), negative operating cash flow (cash burn), and very high debt-to-equity (excess leverage). Other warnings include expenses consistently exceeding revenue and persistent margin decline.
Where do you usually find inventory and short-term investments in financial statements?
Inventory is listed on the balance sheet under current assets. Short-term investments are also typically listed on the balance sheet under current assets (often near cash or marketable securities).