Stock market cycle theory is the study of how economic, political, and psychological factors influence market prices over time.
For a beginner, “cycle theory” can sound like fortune-telling.
It isn’t. Used correctly, cycles are not about predicting an exact date for the next top or crash. They are about building a realistic mental model of how markets behave: they move in phases, and those phases tend to rhyme because human behavior, business activity, and policy decisions often repeat in recognizable ways.
In this lesson, you’ll learn what a stock market cycle is, why cycles appear, and how to apply cycle awareness to make calmer, smarter investing decisions—without overconfidence and without trying to time the market perfectly.
What Is a Stock Market Cycle?
A stock market cycle is a repeated trend in stock prices over time.
That sounds simple, but it’s powerful. Cycles show up because markets are a meeting point of:
A stock market cycle is a recurring pattern in stock prices. There are many stock market cycles, but some of the most common ones include the Kondratiev wave, the Juglar cycle, and the Kuznets cycle. Each of these cycles has unique characteristics, but they all share one common trait: they tend to repeat themselves over time.
- Business reality (growth, profits, layoffs, productivity)
- Money conditions (interest rates, credit availability, liquidity)
- Human psychology (fear, greed, crowd behavior)
- Political regime shifts (policy changes, stability vs. uncertainty)
Because those forces don’t move in a straight line, stock prices don’t either. Markets expand, overheat, correct, and reset—then do it again.
While stock market cycles can be difficult to predict, they can provide valuable insights into future market movements. For example, if a particular stock is trending, it may be a good time to sell it. On the other hand, if a cycle is trending upward, it may be a good time to buy stocks.
Investors who can identify and understand stock market cycles can use this knowledge to their advantage. By understanding how these cycles work, investors can make better-informed decisions about when to buy or sell stocks.
A beginner-friendly way to think about it:
- Prices are the output
- Cycles are the underlying rhythm of inputs
Stock market cycle theory
The theory behind stock market cycles is that various factors, including economic conditions, human psychology, and political events, cause them. These factors can cause stock prices to rise or fall over time, creating a recurring trend in the markets.
While there is no definitive explanation for stock market cycles, economists generally agree that economic, psychological, and political factors drive them.
Economic conditions
Economic conditions play a major role in stock market cycles. For example, periods of high economic growth tend to be followed by periods of higher stock prices. This is because investors are willing to pay more for stocks during strong economic growth.
Conversely, periods of weak economic growth tend to be followed by periods of lower stock prices. This is because investors are less willing to pay high stock prices during weak economic growth.
Why Cycles Exist: The Three Main Drivers
Economists generally describe cycles as arising from economic, psychological, and political factors.
Let’s translate each into practical investor language.
Economic conditions
When the economy is strong, investors typically pay more for stocks because they expect higher, more reliable earnings growth. When growth is weak, investors often pay less because profits become uncertain.
This is not “good news equals up.” It’s “expectations about future profits shift.”
Psychological factors
Investor confidence rises during strong periods and falls during weak periods, changing how willing people are to take risks.
This is where cycles become self-reinforcing: optimism attracts buyers → prices rise → optimism grows. Then the reverse happens in downturns.
Political factors
Stability tends to raise confidence; instability tends to reduce it.
Policy changes, elections, regulation shifts, and geopolitical risk can all influence whether investors feel comfortable paying higher prices.
Cycles Are Everywhere (But Not All Are Tradable)
The course makes a useful point: cycles exist throughout nature (days, seasons, tides), and some traders argue that natural cycles affect markets.
A grounded way to interpret that is:
- Some “natural” cycles affect real economic inputs (e.g., weather affecting crops → commodity prices → commodity-linked companies).
- But not every cycle claim is actionable for investing. Some are too long, too controversial, or too weak statistically to trade with confidence.
So the goal isn’t to believe every cycle story. The goal is to understand the most widely discussed market cycles, their timeframes, and how to use them as context.
How Long Are Stock Market Cycles?
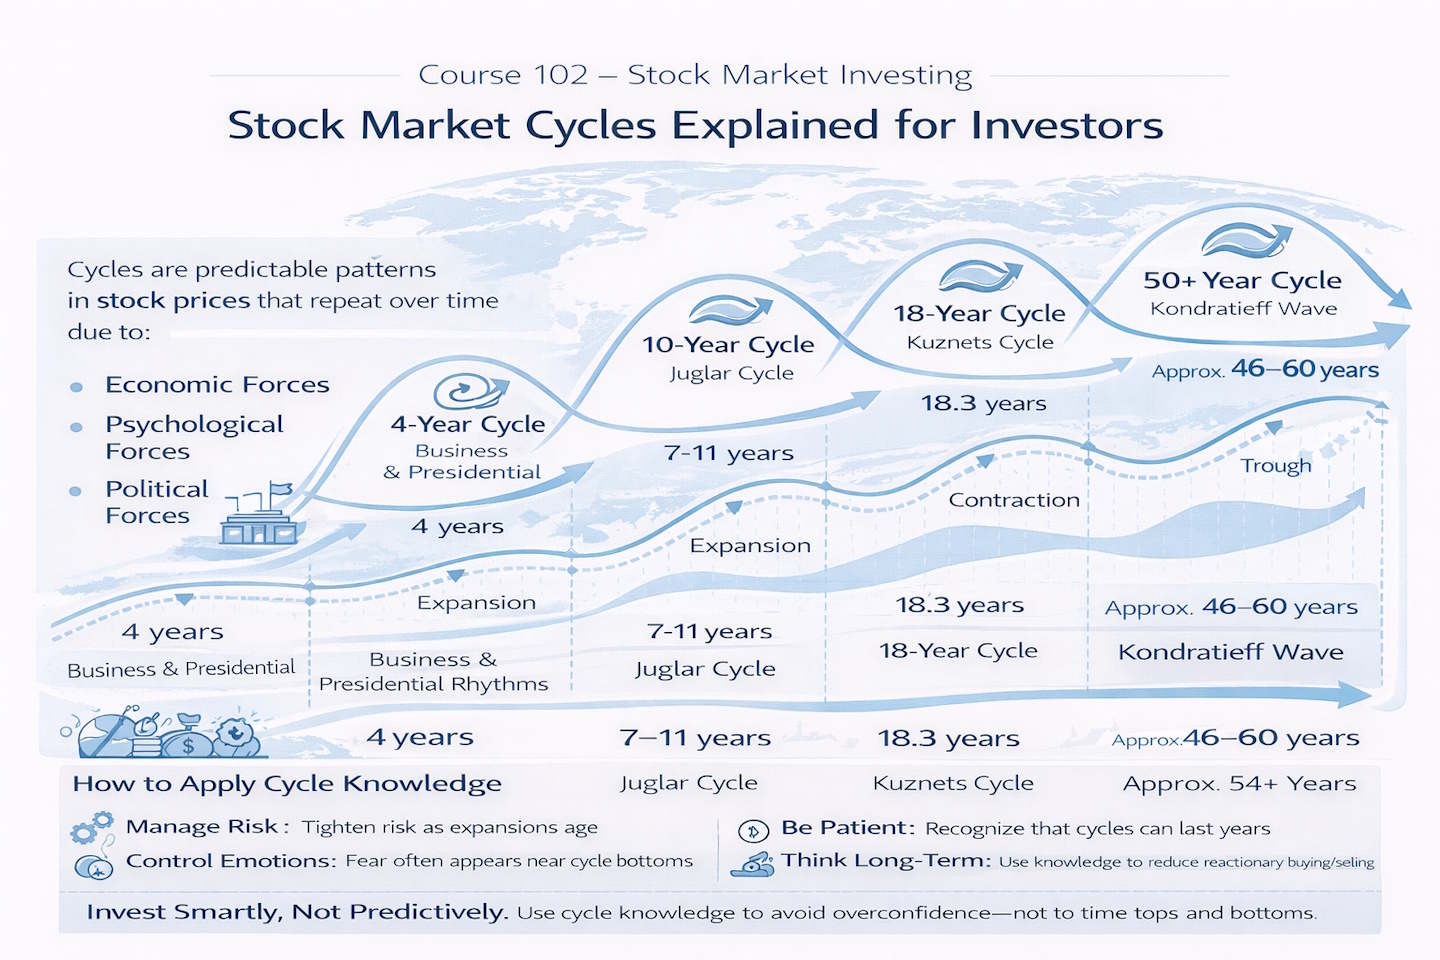
Cycle lengths vary widely—from a 4-year presidential/business-style rhythm to a multi-decade wave such as the Kondratieff cycle.
Cycle lengths can range from 4 years (the presidential cycle) to around 54 years (the Kondratieff Wave).
For beginners, the key idea is that cycles operate on multiple layers at the same time:
- Short cycles can sit inside medium cycles
- Medium cycles can sit inside long cycles
The length of stock market cycles can range from 4 years (the presidential cycle) to 54 years (the Kondratieff Wave), depending on the factors that drive them. However, most stock market cycles last a few years. For example, the presidential cycle is a four-year cycle caused by investors’ expectations about the future economic conditions under a new president. Similarly, the 10-year cycle is a longer-term cycle driven by economic, psychological, and political factors.
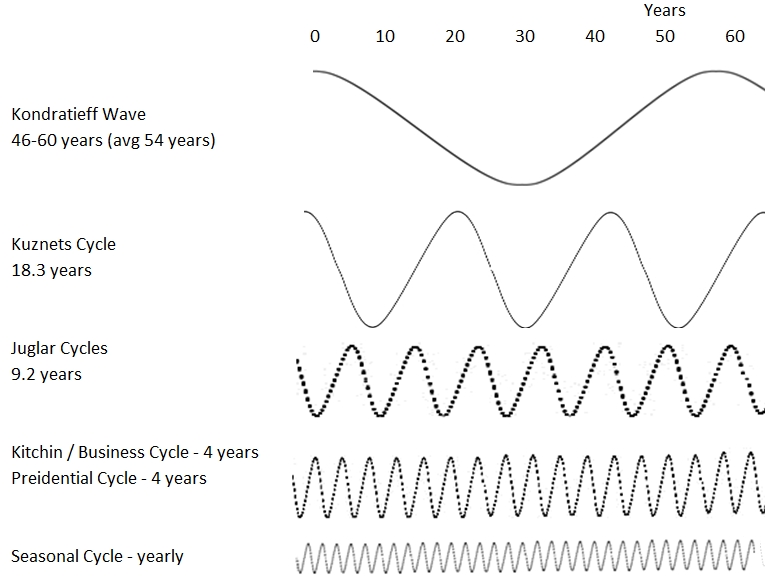
Image courtesy of Liberated Stock Trader PRO Training
Cycles in the stock market
Over the past 200 years, much has been written about cycles, some very useful and some not so applicable to trading success. Cycles are evident in nature, including Earth’s rotation (days), Earth’s rotation around the Sun (years), the Moon’s rotation around Earth (tides), the seasons, animal migration, and solar activity. Some traders believe natural cycles affect the market. In some ways, they do; for example, weather cycles can affect crop output, which can, in turn, affect commodity prices, thereby affecting a company’s stock price, depending on the commodity. However, other cycles can be measured for general stock market activity.
The Kondratieff Wave
The Kondratieff wave has a period of 54 years. Based on wholesale prices in the US in the 1800s, this phenomenon has been mapped from the 1800s through to today. The last trough was in 1940, and the prediction for a trough in 2000 seemed correct. However, if this cycle theory proves correct, we must wait another 40 to 50 years. How actionable this data is is another question. Normally, statistical data proves a trend/theory after 12 to 16 data points, which we certainly do not have here. Also, this theory is quite controversial among economists. Is it a tradable cycle? Well, not really.
The 50+ Year “Mega Cycle”: The Kondratieff Wave
The Kondratieff wave is described as lasting roughly 46–60 years, with a commonly referenced periodicity of about 54 years.
This theory is controversial and not easily actionable for trading because we simply don’t have enough full data points to test it statistically, as a short cycle might be.
How to use it (without overusing it)
As a novice investor, treat very long waves like this as “macro background.” They can help you think about:
- long spans of inflation vs. disinflation,
- long swings in innovation and productivity,
- generational shifts in policy regimes.
But they are not “buy here, sell there” signals. Their context.
The 18-Year Cycle: The Kuznets Cycle
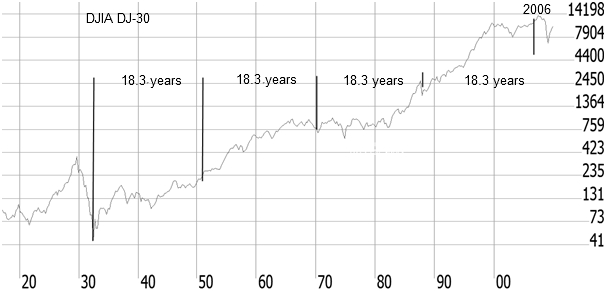
The Kuznets cycle works well, marking the low point of the 1930s depression, the start of the price surge in the 1950s, the market crash of 1987, and the consequent establishment of the roaring bull market that lasted until 2000. However, its timing in 2008 seems slightly off, as it predicted a new phase from 2006 onward.
Overall, Kuznets is a very interesting element of the business cycle.
If you think in 15–20 year horizons, you naturally invest differently than someone thinking in 6–12 months. Cycles like this remind you that markets can move through long regimes—where certain sectors, styles, and strategies dominate for years.
The Kuznets Cycle, named after Simon Kuznets, lasts 18.3 years; here it is plotted against the Dow Jones Industrial Average, starting in 1934.
The 10-Year Cycle: The Juglar Cycle
Clement Juglar was the first to develop an economic theory of business cycles; the Juglar cycle is approximately half of the 18.3-year cycle, at 9.2 years, fluctuating between 7 and 11 years. This highlights the concept of nominality, meaning each larger wave detected seems to be twice the size of the next smaller wave. The Juglar cycle is of a similar wavelength to the 10-year “stock market cycle.”
- credit expansions build,
- businesses overinvest near peaks,
- downturns force resets,
- and the next growth phase emerges.
A beginner shouldn’t use “10-year cycle” as a countdown timer. Instead, use it as a reminder:
- Prolonged good times can create fragility,
- and downturns often follow periods of excess.
This reinforces diversification and risk management—especially when everything feels easy.
The 4-Year Business and Presidential Cycles
The presidential cycle is a 4-year pattern in the stock market, where stock prices tend to rise during the first two years of a new president’s term and then fall during the last two years of the president’s term.
This cycle is believed to be caused by investors’ expectations about the future economic conditions under a new president. When a new president is elected, investors tend to have high expectations for the economy and are willing to pay higher stock prices.
However, as the president’s term progresses, these expectations fall, and stock prices usually follow suit. While the presidential cycle is not an exact science, it can provide valuable insights into future stock market movements.
A Practical Framework: How Beginners Can Use Cycles to Invest Better
Cycle knowledge is most valuable when it strengthens your investing discipline. Here’s a grounded approach that works well for beginners.
1) Use cycles to control your risk, not to chase returns
When markets have been strong for a long time, it’s normal to feel invincible. Cycle thinking reminds you that reversals occur. That should lead to:
- diversified allocations,
- avoiding overconcentration,
- and keeping enough liquidity for life needs.
2) Use cycles to reduce emotional decisions
If you know downturns are part of normal market behavior, you’re less likely to:
- sell in a panic,
- stop investing at the worst time,
- or chase the hottest asset at the peak.
3) Use cycles to set a realistic time horizon
Many cycle narratives (4-year, 7–11-year, ~18-year) reinforce a truth: markets can take time. If your horizon is measured in months, normal cyclical volatility becomes unbearable. If your horizon is measured in years, volatility becomes manageable.
4) Use cycles to improve your “buying behavior.”
Cycles don’t tell you the exact bottom. But they do teach one strong lesson: your best opportunities usually feel uncomfortable because sentiment is negative. That’s why systematic investing (e.g., steady contributions) can be so powerful: it buys through both comfort and discomfort.
What This Lesson Should Change in Your Investing Behavior
After this lesson, a novice investor should be able to say:
- “Markets move in phases; volatility is normal.”
- “Multiple cycles can overlap; I shouldn’t force one explanation.”
- “Long cycles are context; short/medium cycles are risk-awareness tools.”
- “My edge is discipline, not prediction.”
That’s how cycle theory becomes useful: not as a crystal ball, but as a way to invest with fewer emotional mistakes and better long-term consistency.
Psychological factors
Psychological factors also play a role in stock market cycles. For example, investor confidence tends to be higher during periods of strong economic growth. This means that investors are more likely to buy stocks during these periods.
Conversely, investor confidence tends to be lower during periods of weak economic growth. This means that investors are less likely to buy stocks during these periods.
Investor confidence is measured using sentiment indicators. Look at the Liberated Stock Trader Fear & Greed Index for a detailed investor confidence dashboard.
Political factors
Political factors can also influence stock market cycles. For example, periods of political stability tend to be followed by periods of higher stock prices. This is because investors feel confident about the future when there is political stability.
Conversely, periods of political instability tend to be followed by periods of lower stock prices. This is because investors worry about the future when political instability exists.
Class Questions & Answers
What is a stock market cycle?
A stock market cycle is a repeated trend in stock prices over time. Cycles form because economic conditions, investor psychology, and political events influence how investors price future company earnings.
What are the three main drivers of stock market cycles described in the lesson?
The lesson explains cycles as driven by economic conditions (growth and earnings expectations), psychological factors (investor confidence and sentiment), and political factors (stability, policy, and uncertainty).
How long can stock market cycles last?
Cycle lengths vary widely. The lesson notes examples ranging from about 4 years (presidential cycle) to multi-decade waves around 54 years (Kondratieff Wave), with other well-known cycles around 10 years and 18.3 years.
Why does the lesson say the Kondratieff Wave is not very actionable for trading?
Because it spans many decades and is controversial; there aren’t enough complete historical data points to validate it statistically in a way that makes it practical as a buy/sell timing tool.
What is the safe way for a beginner to use cycle knowledge?
Use cycles for context and risk awareness—expect volatility, avoid overconfidence late in expansions, stay diversified, and follow a repeatable investing process—rather than trying to predict exact tops and bottoms.
Summary
The four-year Business Cycle is popular and trustworthy. This suggests business and production output fluctuate within a regular four-year cycle. This means within four years, we tend to see a bull market rise and fall.
You want to be a successful stock investor but don't know where to start.
Learning stock market investing on your own can be overwhelming. There's so much information out there, and it's hard to know what's true and what's not.

Liberated Stock Trader Pro Investing Course
Our pro investing classes are the perfect way to learn stock investing. You will learn everything you need to know about financial analysis, charts, stock screening, and portfolio building so you can start building wealth today.
★ 16 Hours of Video Lessons + eBook ★
★ Complete Financial Analysis Lessons ★
★ 6 Proven Investing Strategies ★
★ Professional Grade Stock Chart Analysis Classes ★