An income statement gives you a snapshot of a company’s revenues, expenses, and net income for a specific accounting period. You’ll see the financial results for a set timeframe—maybe a quarter, maybe a fiscal year.
People also call it a profit and loss statement (P&L) or a statement of operations. It spells out how much money came in, how much went out, and whether the business turned a profit or incurred a loss.
You’ll usually review the income statement alongside other financial statements to better understand a company’s performance. The statement subtracts expenses and taxes from revenue to arrive at that final income figure.
When you’re doing fundamental research, platforms like Stock Rover let you dig into income statements and screen for companies that tick the boxes you care about. The statement makes it easier to assess whether a company’s operations are actually profitable and whether it can sustain that performance.
What is the purpose of an income statement?
You use an income statement to track a company’s revenues and expenses, so you can see if it made a profit or took a loss during a certain period. That period could be a quarter, a year, or any stretch the company defines.
Investors want to know whether a business is generating steady profits or incurring losses. The statement also helps you determine whether sales are rising, costs are under control, and the business is running efficiently.
Companies can record these using either the accrual or cash basis of accounting. Accrual basis means you record revenues when you earn them and expenses when you incur them—no matter when the cash actually moves. Cash basis just tracks money as it comes in or goes out.
Business owners, investors, and analysts rely on this document to size up performance against rivals and check financial stability. Tools like Stock Rover make it easy to analyze income statement data across companies, helping you spot investment opportunities through detailed analysis.
You’ll find critical info here about revenue trends, expense management, and overall profitability—stuff that drives investment decisions and strategy.
How to Read an Income Statement?
To read an income statement, start by looking at the main line items that lay out a company’s financial performance. Revenue sits right at the top—it’s the total money from sales during the period, and it’s the jumping-off point for figuring out profitability.
Cost of goods sold (COGS) comes next, showing direct costs for production or service delivery. After that, you’ll see operating expenses, which usually cover salaries, rent, and marketing. Subtract these from revenue to get operating income.
The income statement format usually runs in this order:
- Revenue (sales)
- Cost of goods sold
- Gross profit
- Operating expenses
- Operating income
- Interest and taxes
- Net income
Net income lands at the bottom as the final profit or loss. If you want to see this in action, check out an income statement example on Stock Rover—it lays out detailed financials for analysis. Each line item connects, showing how revenue gets whittled down to profit after all the costs and expenses.
What items are on an income statement?
You’ll find several key line items on an income statement, each tracking a specific part of a company’s financial performance for a set period. The items flow from top to bottom, starting with revenue and ending with net income.
Every component gives you a window into a different part of the business—how it operates, how efficient it is, and how much profit it actually keeps.
Net sales
Net sales are the total revenue a company generates from selling products or services over a given period. This number appears at the top of the income statement and represents what the company actually receives from customers after deducting returns, allowances, and discounts from gross sales.
This line is where all profitability calculations begin. For Company ABC, net sales jumped from $500,000 in 2020 to $1,000,000 in 2021—a pretty big leap. Some statements refer to this as operating revenue or simply total revenue.
Investors look at net sales to judge market position and growth. If net sales climb year after year, that usually means people want what the company’s selling.
Cost of sales
The cost of sales covers all direct expenses incurred in producing the goods or delivering the services a company sells. This includes raw materials, factory labor, equipment depreciation, maintenance, and other production-related costs.
You’ll see the cost of sales (often called cost of goods sold or COGS) right below net sales. In Company ABC’s case, the cost of sales rose from $250,000 to $300,000 from 2024 to 2025. This number usually tracks with production volume and efficiency.
Key components of cost of sales include:
- Raw materials and inventory
- Direct labor costs
- Manufacturing overhead
- Depreciation expense on production equipment
- Utilities for production facilities
Gross profit
Gross profit tells you how much profit a company keeps after subtracting the cost of sales from net sales. This number indicates how efficiently the company produces or sources its products, before operating expenses are taken into account.
Here’s the formula: Gross Profit = Net Sales – Cost of Sales
Company ABC’s gross profit shot up from $250,000 to $700,000, which points to better profitability at the production level. The gross margin (gross profit divided by net sales) provides a percentage measure of this efficiency. On Stock Rover, you can spot gross profit trends and get a sense of a company’s pricing power in its industry.
Operating expenses
Operating expenses are the costs of running the company’s day-to-day business that aren’t directly related to making the product. Think administrative salaries, office rent, advertising, utilities for non-production spaces, and general admin costs.
You’ll often see this category labeled as SG&A (Selling, General, and Administrative) expenses. Company ABC’s operating expenses increased from $50,000 to $70,000 as sales rose.
Common operating expenses include:
- Sales and marketing costs
- Administrative salaries
- Office rent expense
- Utilities
- Depreciation expense on non-production assets
- Professional fees
Operating income
Operating income measures profit from core business operations before interest and taxes. This number excludes non-operating revenue and expenses, giving you a clear view of operational performance.
The formula is: Operating Income = Gross Profit – Operating Expenses
Company ABC’s operating income rose from $200,000 to $630,000, suggesting the company operated efficiently. This metric makes it easier to compare companies in the same industry, since it strips out differences in financing and taxes.
Interest expense
Interest expense shows the cost a company pays to service its debt during the period. You’ll find this directly below operating income; it covers interest on loans, bonds, and other borrowed funds.
Company ABC’s interest expense was stuck at $5,000 for both years, so the debt level didn’t really change. This is a non-operating expense—it’s all about financing, not the core business. If a company carries more debt, you’ll see a bigger interest expense, which eats into profitability.
Net profit
Net profit (or pretax income) is what’s left after you count all operating costs, depreciation, interest expense, and other income or expense items, but before you subtract income taxes. This number shows profit from all activities before taxes.
You get there by adding any gains and subtracting any losses from special items or other income/expense categories. Company ABC’s net profit before taxes leaped from $215,000 to $655,000, so things definitely improved. This metric includes both operating and non-operating revenue and their costs.
Taxes
Taxes on the income statement show what the company owes in income tax to federal, state, and local governments, based on taxable income. This line shows up near the bottom and directly cuts into what’s available for shareholders.
The income tax expense depends on tax rates and rules. Company ABC’s tax bill jumped from $75,000 to $200,000, right in line with higher pretax income. Companies use all sorts of strategies to manage their effective tax rate, and that can really affect net income. The annual income statement makes it obvious how tax obligations shift as profits change.
Net income
Net income is the very last line on the income statement—the “bottom line.” It’s the total profit or loss after every revenue, expense, gain, and loss is counted. This is what’s left for shareholders after covering all costs, interest, and taxes.
Here’s the formula: Net Income = Net Profit Before Taxes – Income Tax
Company ABC pulled in net income of $140,000 in 2020 and $455,000 in 2021. If total expenses beat revenues, you’ll see a net loss instead. Net income drives key financial ratios and affects shareholder equity on the balance sheet. If you want to track net income trends, platforms like TradingView let you do it easily for long-term profitability and growth analysis.
How to analyze an income statement
To analyze an income statement, focus on the metrics that really reveal a company’s financial performance and profitability. Start by checking revenue against cost of goods sold—does the business pull in enough to cover direct costs?
Keep a close eye on operating expenses. If marketing, admin, or rent costs balloon, profits can quickly shrink. Comparing these expenses to previous years or to competitors helps you spot where the company might be inefficient.
Net income tells you what’s left after everything’s paid. If net income looks strong, that’s a good sign. If it’s dropping, investors and creditors should probably dig deeper.
Key profitability metrics worth checking:
- EBIT (Earnings Before Interest and Taxes) – for operating performance
- Profit margin – net income divided by revenue
- Gross profit percentage – for pricing power and cost management
A comparative income statement lets you track changes over multiple periods. With tools like Stock Rover, you can run deep fundamental analysis and compare income statement trends for hundreds of companies at once. That’s pretty handy for spotting top performers in any sector.
Look at both the raw numbers and the percentages. That way, you can figure out if changes come from what the company’s doing or from outside forces.
Is an income statement the same as a profit and loss?
Yep, an income statement and a profit and loss statement are just two names for the same thing. Both lay out a company’s revenue, expenses, and net income for a specific accounting period.
You’ll see the terms used interchangeably in financial reporting. Some companies stick to one or the other, depending on where they’re based or their own habits, but the content and goal are the same.
Both documents show revenues, operating costs, and the bottom-line profit or loss. Platforms like Stock Rover let you dig into these reports and compare fundamental metrics across different periods.
The statement presents financial data in a standardized format, following accounting principles. That makes it easier for stakeholders to judge if a business made a profit or took a loss during the reporting period.
What is a multi-step income statement?
A multi-step income statement splits revenue and expenses into operating and non-operating categories. That’s different from a single-step income statement, where everything gets lumped together without much detail.
The multi-step version gives you a clearer breakdown. It shows gross profit, operating income, and net income separately, so you can see how the business performs at each stage.
Both single-step and multi-step formats are common. The multi-step one just gives you more detail. If you’re using a platform like TradingView, you can pull up these statements for publicly traded companies worldwide.
The format organizes income and costs into separate sections. Operating items reflect core business activities, while non-operating items cover gains and losses from side activities.
What is a pro forma income statement?
A pro forma income statement gives you a forward-looking projection of a company’s revenue, expenses, and profitability, all based on certain assumptions or imagined scenarios. Instead of showing what happened in the past, it lets you estimate what could happen if, say, you launch a new product, merge with another company, or cut costs.
You’ll see projected revenue and expenses broken out into categories, which helps you (or investors) dig into expected performance.
The difference between a pro forma and a multi-step income statement
A pro forma income statement shows how a company expects to make or lose money in the future. It forecasts financial results using assumptions about future operations, acquisitions, or “what if” scenarios.
A multi-step income statement, on the other hand, shows how a company actually made or lost money in the past. It splits operating from non-operating activities and gives you multiple profit figures like gross profit and operating income.
Here’s how they stack up:
| Pro Forma Income Statement | Multi-Step Income Statement |
|---|---|
| Forward-looking projections | Historical performance |
| Based on assumptions | Based on actual transactions |
| Used for planning and forecasting | Used for financial reporting |
Tools like Stock Rover let you compare historical and projected income statements side by side whenever you’re doing fundamental analysis.
You can dig into both statement types with platforms like Stock Rover, comparing what management thought would happen with what actually did. That’s a handy way to check how well a company forecasts.
Red Flags on the Income Statement
When you review income statements, pay close attention to special items or extraordinary expenses. Companies often record these one-off charges for things like restructuring or closing a business unit—think redundancy payments. Sometimes, a big special charge can turn a solid profit into a small loss.
Key warning signs include:
- “One-time” charges that keep showing up, quarter after quarter
- A growing chunk of “other operating income” or “other operating expenses.”
- Strong net income but operating cash flow that’s weak or negative
- Big jumps in non-operating income that hide weak core results
With Stock Rover, you can track these patterns across several quarters and compare them to similar companies. Sometimes, management uses these line items to bury recurring costs or smooth results. If you want a true picture of financial health, you’ll need to adjust your valuation models for these quirks.
Interpreting the financial performance with income statements
When you look at an income statement, don’t just zero in on one number. You’ll want to check several metrics and spot trends.
Start with revenue. Is sales growth steady, or has it slipped lately? If revenue drops, it could mean the company’s losing market share or facing industry headwinds.
Profit margins matter a lot. Gross profit margin (gross profit divided by revenue) tells you how tightly the company manages production costs. Operating profit margin reveals how well management keeps overhead in check. Net profit margin shows what’s left after everything, so that’s the big picture on profitability.
Dig into expense ratios over time. If you see operating expenses climbing faster than revenue, that’s a red flag for profitability. If a particular expense category suddenly jumps, maybe something unusual happened—worth digging deeper.
Compare year-over-year and quarter-over-quarter numbers for context. For seasonal businesses, it’s smarter to compare the same periods across years. Seeking Alpha offers detailed income statement breakdowns and comparative metrics, so you can stack up a company’s performance against its industry peers.
Analysts also use earnings per share (EPS)—net income divided by outstanding shares—to compare companies of different sizes. EPS trends help you track value creation for shareholders.
FAQ
Do accounts receivable go on an income statement?
Accounts receivable don’t show up on the income statement. They’re amounts customers owe you and belong on the balance sheet as current assets.
You record revenue on the income statement when you earn it, whether or not you’ve collected the cash. The accounts receivable sit on the balance sheet until the customer pays.
Does unearned revenue go on the income statement?
Unearned revenue isn’t on the income statement. You’ll find it on the balance sheet under liabilities.
That’s money you’ve received for goods or services you haven’t delivered yet. Once you deliver, you’ll move it over to revenue on the income statement.
Are supplies an expense on the income statement?
You’ll see the supplies expense on the income statement when you use up the supplies. Unused supplies stay on the balance sheet as assets until you actually use them in operations.
Are dividends on the income statement?
Dividends don’t appear on the income statement. They’re distributions of profits to shareholders, so you’ll see them in the statement of retained earnings or the cash flow statement.
You calculate net income before paying any dividends. Companies with strong EPS might pay out dividends or reinvest profits in the business instead.
How does an income statement differ from a cash flow statement?
An income statement and a cash flow statement tell you different things. The income statement records revenues and expenses when they’re incurred, not when cash moves. The cash flow statement tracks the actual inflows and outflows of cash.
This all comes from accrual accounting. For example, you might record revenue when you deliver a product, even if the customer pays 30 days later. The cash flow statement only reflects it once the cash arrives.
The income statement measures profitability over a set period. The cash flow statement shows liquidity—how easily the company can pay its bills. Sometimes, a company looks profitable on paper but still struggles with cash if customers are slow to pay.
Summary
The income statement lays out financial data as revenue, expenses, and net income. Revenue is all the money earned from running the business.
Expenses cover everything you spend to earn that revenue—inventory, salaries, operating costs, you name it.
Net income is what’s left after subtracting all expenses from revenue. This statement links to other financial documents like the balance sheet (assets and liabilities) and the statement of cash flows (actual cash movement).
Companies prepare income statements using GAAP standards, pulling numbers from the adjusted trial balance. Sometimes, the statement also connects to comprehensive income, which covers items beyond regular operations.
You can analyze these details with platforms like Stock Rover for in-depth research and screening. The income statement shows up in annual reports with the balance sheet and cash flow statement.
Net income flows into retained earnings on the balance sheet, tying everything together.
Class Questions & Answers
What is an income statement, in plain English?
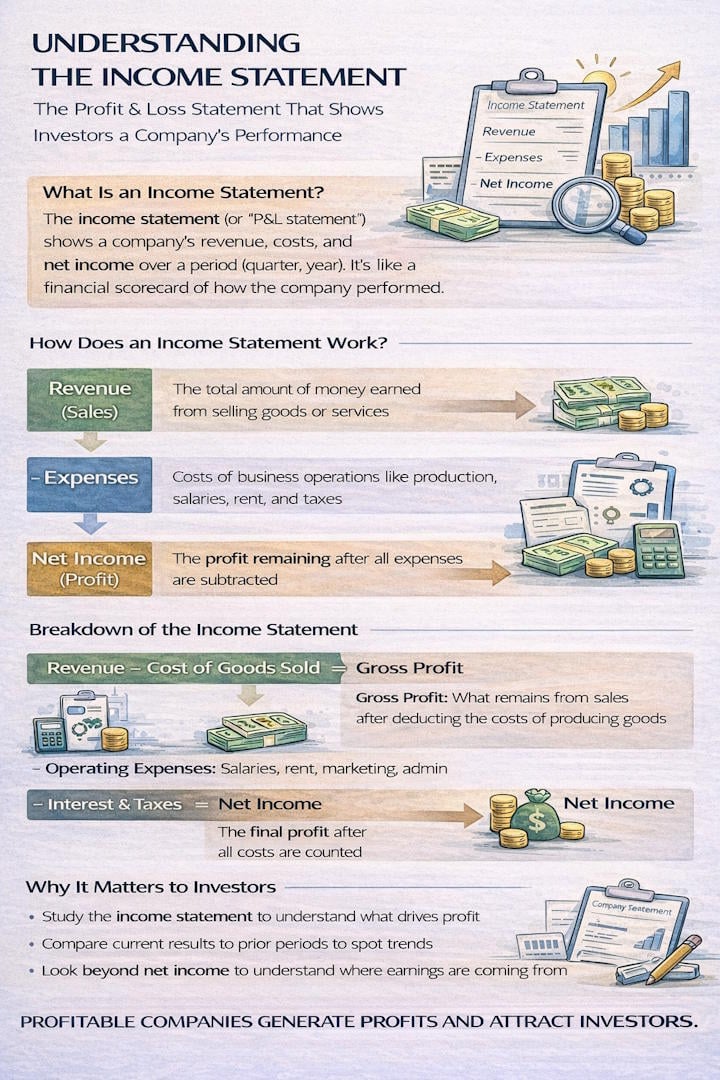
An income statement (profit & loss statement) summarizes how much money a company made (revenue), what it spent (expenses), and what it kept as profit (net income) over a specific period like a quarter or year.
What is the difference between revenue and profit?
Revenue is the total money earned from sales. Profit (net income) is what remains after subtracting all costs and expenses. A company can have high revenue and still have low (or negative) profit if costs are too high.
What are gross profit and operating profit, and why do they matter?
Gross profit is revenue minus the direct cost of producing goods/services (COGS). Operating profit subtracts operating expenses (like salaries, rent, marketing) from gross profit. These layers show where profitability is strong or weak—production costs vs. business overhead.
Why can net income be misleading on its own?
Net income can include one-time gains or losses, accounting adjustments, and non-cash items. Investors often look at profit trends, margins, and cash flow alongside net income to judge the true health of the business.
What are two quick red flags an investor can spot using the income statement?
Two common red flags are (1) falling profit margins over time (costs rising faster than revenue) and (2) profits that jump around wildly without a clear business reason, which can signal instability or heavy reliance on one-time events.