A lot of investors want to get into the market without putting up a ton of cash. Stocks trading at lower price points make that possible. The appeal here isn’t just about saving money—some folks genuinely believe these cheaper stocks can offer big upside, especially if you spot undervalued companies at the right moment.

People hunt for value-priced shares much like they shop for deals elsewhere—who doesn’t want a bargain? But finding a truly cheap stock takes more than glancing at the price tag. You’ll need to dig deeper, and tools like Stock Rover help you run the numbers, sorting out what’s just low-priced from what’s actually undervalued based on the company’s real financials.
Key Takeaways
- Cheap stocks let you start investing with less capital, making it easier to build a portfolio from scratch.
- A low share price doesn’t equal real value—you’ve got to look at earnings, assets, and the fundamentals.
- Affordable stocks might offer growth, but they’re usually riskier and more volatile than blue-chip names.
What are Cheap Stocks?
Cheap stocks are shares of publicly traded companies that you can buy for a low price per share—think under $10, $5, or even less. Usually, these lower prices mean smaller market caps, newer businesses, or companies going through rough patches.
Are Cheap Stocks Worth Buying?
Whether cheap stocks are worth it really depends on your strategy and how much risk you’re willing to take. Value investors sometimes see low-priced shares as undervalued opportunities with room to climb. Growth investors, though, care more about how fast a company is expanding than what the share price says.
Key Considerations:
- Your risk appetite is everything here.
- How long you plan to hold affects your outcome.
- Due diligence is non-negotiable, no matter the price.
You can use Stock Rover to run a deep analysis before you buy. The best cheap stocks? They’ve got solid business fundamentals and good valuations, not just a low price. Ultimately, you’ll need to decide if these fit your personal goals and portfolio.
Why Investors Choose Low-Priced Stocks
Low-priced stocks can deliver big percentage returns if the price moves up. Imagine buying at $5 and selling at $15—a 200% gain. That’s the kind of upside that gets people interested.
These best cheap stocks also keep your downside smaller. If you buy in at a low price, you’ve got less to lose compared to dropping $300 a share.
You can spread your money across more positions and build a diversified portfolio even if you’re starting with a modest sum.
Buying lower-priced shares means you can own more shares, so if things go well, your percentage gains look pretty impressive.
Dangers of Purchasing Low-Priced Shares
But let’s be honest, cheap stocks come with headaches. They often have limited upside since the price already fell so much—sometimes there’s just not much left to gain.
Key concerns include:
- Business viability: Some of these companies might be on the brink of bankruptcy or could get delisted, wiping out your investment.
- Liquidity constraints: Thin trading and wide bid/ask spreads can make it expensive or tough to get in and out.
- Market volatility: These can swing wildly—big moves up, but also big drops.
You can use fundamental screening tools to check financial health metrics before you risk your money. Because with these stocks, you’re often looking at companies with real problems, so you need to do your homework.
Is Investing in Cheap Stocks Worth It?
Your decision to buy low-priced stocks should line up with your investment goals and your comfort with risk. If you’re okay with some volatility, you might find opportunities here. Still, you’ve got to research every pick, no matter how cheap.
Knowing the difference between a truly undervalued stock and a risky one isn’t easy. A $3 stock could be overpriced, while a $50 stock might be a steal.
Key factors to check:
- Company fundamentals and financial health
- Revenue growth and profitability
- Industry standing and what sets them apart
- Trading volume and how easy it is to buy or sell
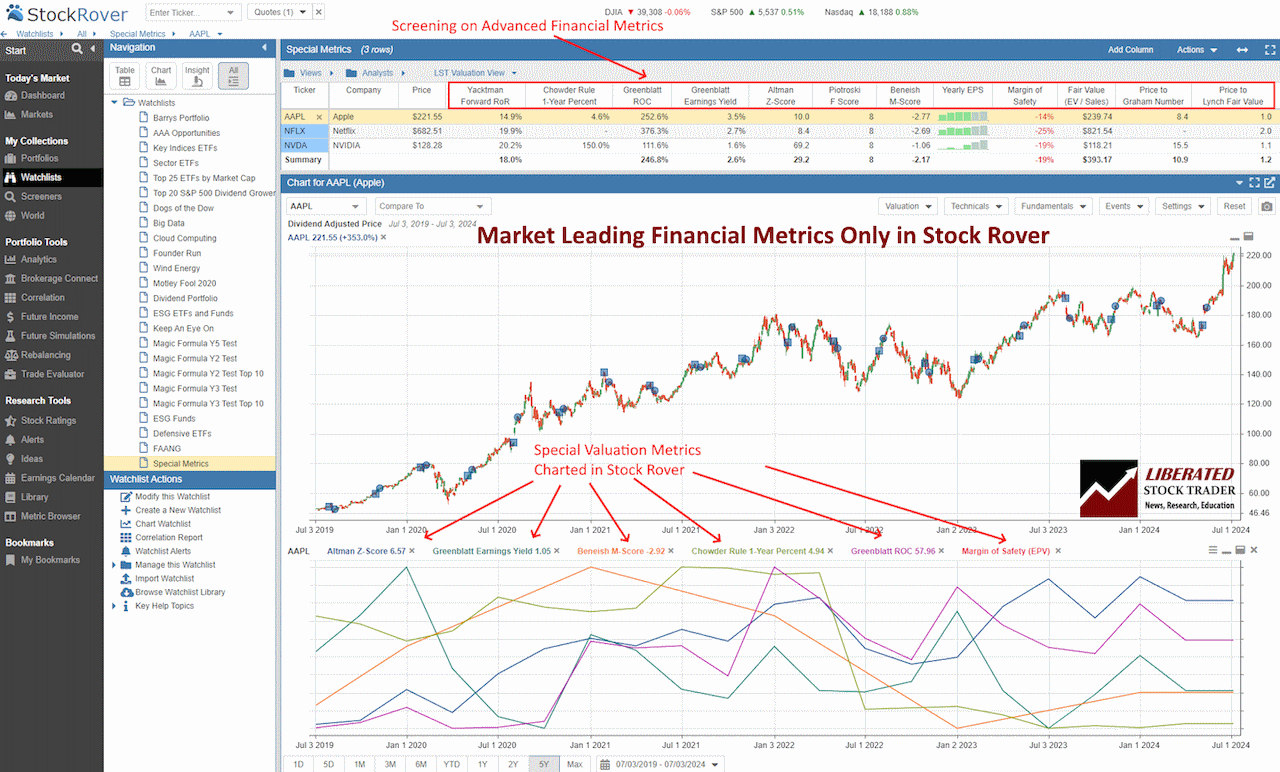
With Stock Rover, you get access to hundreds of metrics. You can compare valuation models and safety rankings to cut through the noise.
If the underlying business is solid, low-priced shares can deliver strong returns. The trick is separating the real deals from the stocks that are cheap for all the wrong reasons—like a dying business or bad management. Use both technical and fundamental analysis, not just the price.
Understanding What “Cheap Stock” Actually Means
A stock’s cheapness is all about context and your criteria. Think of it like this: a luxury car for $50,000 might be a deal if the seller’s desperate, and a $5 stock could be undervalued—or not—depending on the fundamentals.
Price alone doesn’t tell you much. Maybe a stock is cheap because demand temporarily dried up, which could be your chance if you know the business. Or maybe it’s cheap because the company cut corners and is headed for trouble.
What makes a stock “cheap”?
- Price compared to earnings and cash flow
- Book value versus the market price
- Industry comparisons and their edge over rivals
- Growth potential versus current valuation
Categories of Affordable Stocks
When you’re searching for affordable stocks, you’ll usually run into a few categories. Penny stocks are the bottom rung—under $5 per share, with wild swings and big risks. Stocks priced between $5 and $10 are a step up, with a bit less risk.
But it’s not just about price. Some investors look for “cheap” stocks using valuation metrics, not just the sticker price. If a company trades below its intrinsic value (using things like P/E ratios), it might be cheap even if the share price isn’t tiny.
Your own criteria and risk tolerance matter a lot. Maybe you want sub-$1 penny stocks for speculation, or maybe you prefer solid companies that just happen to be trading at a discount. Each group has its own quirks—liquidity, volatility, growth potential—so check carefully before you buy.
Cheap stocks based on a low stock price
A lot of beginners chase stocks under $10, thinking they’re getting a deal—like bargain hunting at the store. A share price at $0.50 looks way more approachable than $500. But honestly, that number alone doesn’t tell you if it’s a good buy.
A $300 stock that dropped from $600 could be a better value than a $2 stock that crashed from $50. Big price drops often mean big problems. Companies that lose 90% of their value usually have serious issues—think revenue declines, losses, or looming bankruptcy.
If you’re looking at stocks under $10, focus on fundamentals, not just price. Pay attention to revenue growth, profits, debt, and how they stack up against competitors.
A stock under $10 isn’t automatically good or bad. What matters is whether the company’s getting stronger or weaker. A $0.75 stock that’s lost money for five years is a lot riskier than an $8 company posting steady profits.
Price by itself just isn’t enough. The real question is how the price matches up with the business’s actual value.
The Low-Priced Share Analysis
I used Stock Rover’s screening to analyze US stock performance, breaking shares into three price groups and comparing each to the S&P 500.
Shares Trading Below $5
Looking at stocks under $5, I found some wild performance disparities. Out of this group, 891 stocks beat the S&P 500 by over 10%. But 1,571 lagged by more than 10%.
Here’s how it shakes out:
| Performance Metric | Number of Stocks |
|---|---|
| Beat S&P 500 by +10% or more | 891 |
| Trailed S&P 500 by -10% or more | 1,571 |
If you picked randomly from this bracket, you’d have run into almost twice as many losers as winners. That includes sub-$1 stocks, which are even riskier and less liquid.
Shares Trading Below $10
For stocks under $10, 1,270 beat the S&P 500 by more than 10%. On the flip side, 1,850 underperformed by more than 10%.
Performance Summary:
- Outperformers: 1,270 stocks
- Underperformers: 1,850 stocks
- Probability of underperformance: 59%
Random picks here gave you a better shot, but you’d still have a 59% chance of lagging the market. Lower prices don’t guarantee better results.
Shares Trading Above $10
Higher-priced shares told a different story. Here, 1,265 stocks outpaced the S&P 500 by 10% or more, while 572 fell short by that much.
| Category | Count |
|---|---|
| Exceeded S&P 500 by +10%+ | 1,265 |
| Underperformed S&P 500 by -10%+ | 572 |
| Success probability | 67% |
If you’d bought randomly from this group, you’d have a 67% shot at beating the market. That’s a big improvement over the cheaper categories.
Bottom line: Share price doesn’t equal investment quality. Focus on returns, fundamentals, and growth—not just the price tag.
This analysis shows that lower-priced shares often mean higher risk and a lower shot at beating the market. When you’re building a portfolio, put company health and valuation first.
This data covers a specific period and shouldn’t be your only reason for making investment decisions.
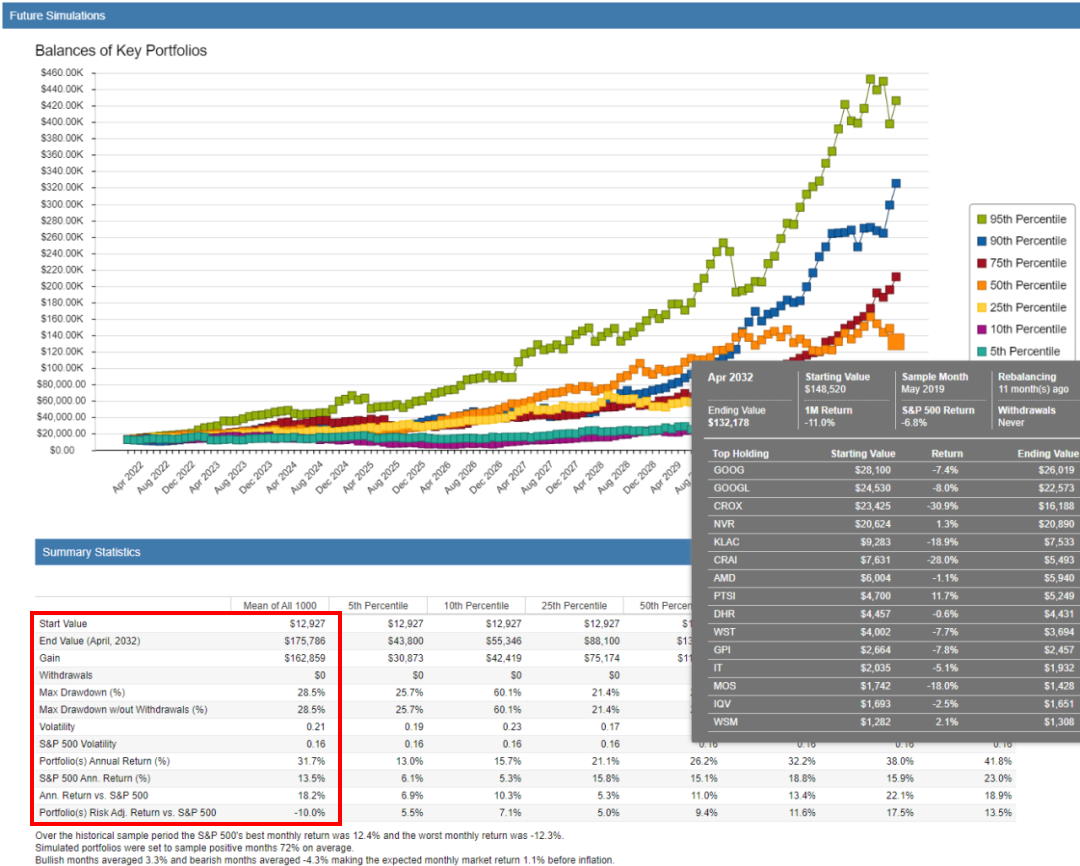
Evaluating Stocks Through Historical and Projected Performance
Growth in Profitability and Sales
You can gauge stock value by checking both past results and what’s expected ahead. A low price alone doesn’t tell you if it’s a deal.
Take a company trading 34% below its old high. That drop doesn’t mean it’s a bargain. What matters is stuff like five-year revenue growth, recent EPS jumps, and the P/E ratio.
Say a stock posts 43% revenue growth over five years, 61% EPS growth lately, and trades at a P/E of 21. That’s interesting. If analysts expect earnings to grow 40% a year, that P/E starts to look pretty reasonable, no matter the share price.
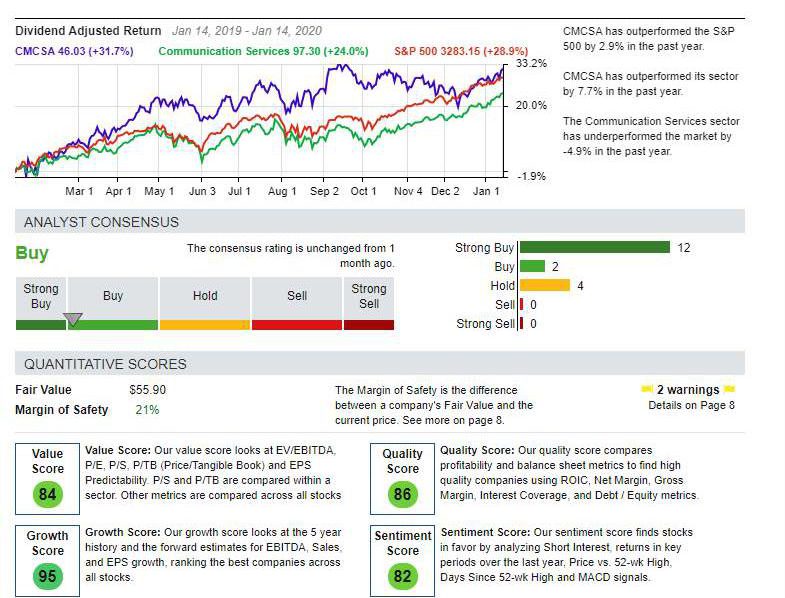
A strong Zacks rank and positive earnings estimate revisions add more confidence. Broker ratings and F1 earnings estimate changes help you spot which companies are actually improving. These tools help you separate real value from stocks that are just cheap for a reason.
Asset-Based Stock Valuation
Finding Worth Through Fundamentals
Benjamin Graham’s ideas really shape how you spot stocks trading below what they’re actually worth. You’ll want to dig into balance sheet components to see if a share price matches up with the company’s real value.
Picture this: A company has 50 million shares out there and keeps $150 million in liquid assets and short-term investments. The stock trades at $3 per share. Do the math—$150 million divided by 50 million shares means $3 in cash per share. That’s pretty interesting, especially if the company isn’t weighed down by too much debt.
Key Evaluation Metrics:
- Current assets per share – Liquid resources divided by shares outstanding.
- Cash position – Available funds compared to market capitalization.
- Net asset value – Total assets minus liabilities per share.
- Debt obligations – Liabilities that eat into real value.
If you spot a well-run company trading below its cash and current asset values, that’s rare—and it usually doesn’t last. When it does happen, it might be a sign the market’s overlooked something. Of course, you’ll want to check for any hidden liabilities before jumping in.
Affordable Stock Options Summary
Don’t fall for the trap of thinking a cheap stock means you’re getting a deal. Just because a share trades below $10 doesn’t mean it’s a smart buy—you need to look at what’s really going on with the business.
A lot of stocks stay cheap for a reason. You’ll often see issues like operational challenges, leadership that’s lost its way, companies ignoring market trends, shrinking industries, products nobody wants, or sloppy financial management.
Common red flags in low-priced equities include:
- Ineffective executive teams
- Refusing to adapt to industry changes
- Shrinking customer bases
- Products that just don’t catch on
- Poor capital allocation
Before you buy any bargain-priced shares, it’s smart to run a detailed financial analysis. You can check debt, profit margins, revenue trends, and how the company stacks up against competitors. The price alone tells you nothing about where a company’s headed.
Further Reading – Methods for Identifying Undervalued Stocks
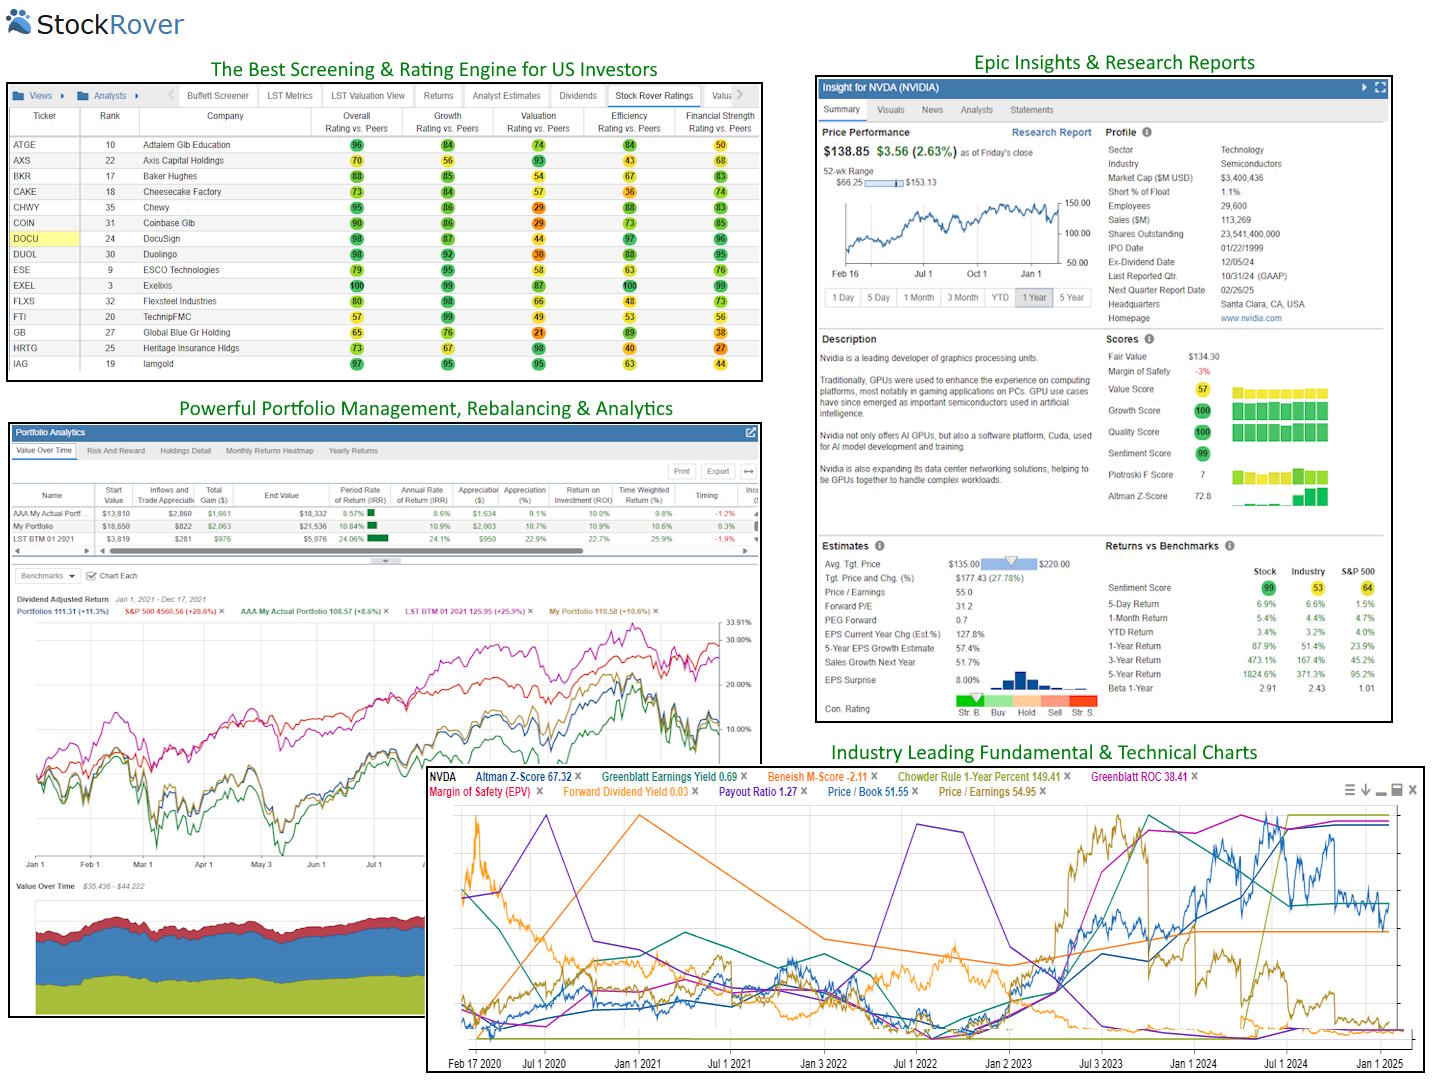
If you’re hunting for affordable investments, there are a few screening methods you might want to try. Stock Rover gives you deep fundamental analysis tools to filter for price-to-earnings ratios, price-to-book values, and dividend yields. It’s not just about the price; you’ll need real research to separate the promising stocks from the risky ones.
Screening for low-priced shares means looking at several things at once. You might check:
- Where the current price sits compared to past trading ranges
- Earnings growth over several quarters
- Debt-to-equity ratios that show financial health
- Revenue trends that point to momentum
- How the company stacks up in its industry
You can also use technical indicators alongside the fundamentals. Chart patterns can show you support levels where buyers tend to step in. Volume analysis helps you see if big investors are actually interested in these discounted stocks.
Market conditions definitely play a role. When things get volatile, companies with solid balance sheets and steady cash flow usually offer better risk-adjusted returns than those ultra-cheap, speculative plays.
Overview of Stock Assessment Methods
Stock analysis covers a variety of approaches you can use to size up potential investments. When you dig into market direction with proven methods, you give yourself a solid base for smarter decisions. Rating agencies throw in their own perspectives, which might add a layer to your personal research.
Three main documents really matter when you’re analyzing a company:
- Balance Sheet – Lists assets, liabilities, and shareholder equity.
- Income Statement – Breaks down revenue, expenses, and how profitable the company actually is.
- Cash Flow Statement – Tracks the money moving in and out of business operations.
If you want to spot a company’s financial health or how efficiently it runs, you’ll need to study these. Investors usually look for strengths, weaknesses, or any patterns that hint at growth.
Key Valuation Metrics
There are two core ideas you’ll want to get familiar with when you’re judging stock prices:
Earnings Per Share (EPS) tells you how much profit each outstanding share gets. Basically, it shows how much cash the company is generating for every shareholder.
Price-Earnings Ratio (P/E) compares the stock’s price to its earnings. If you see a lower ratio, that might mean the stock is undervalued. On the flip side, a high P/E could point to either strong growth expectations or maybe just overvaluation.
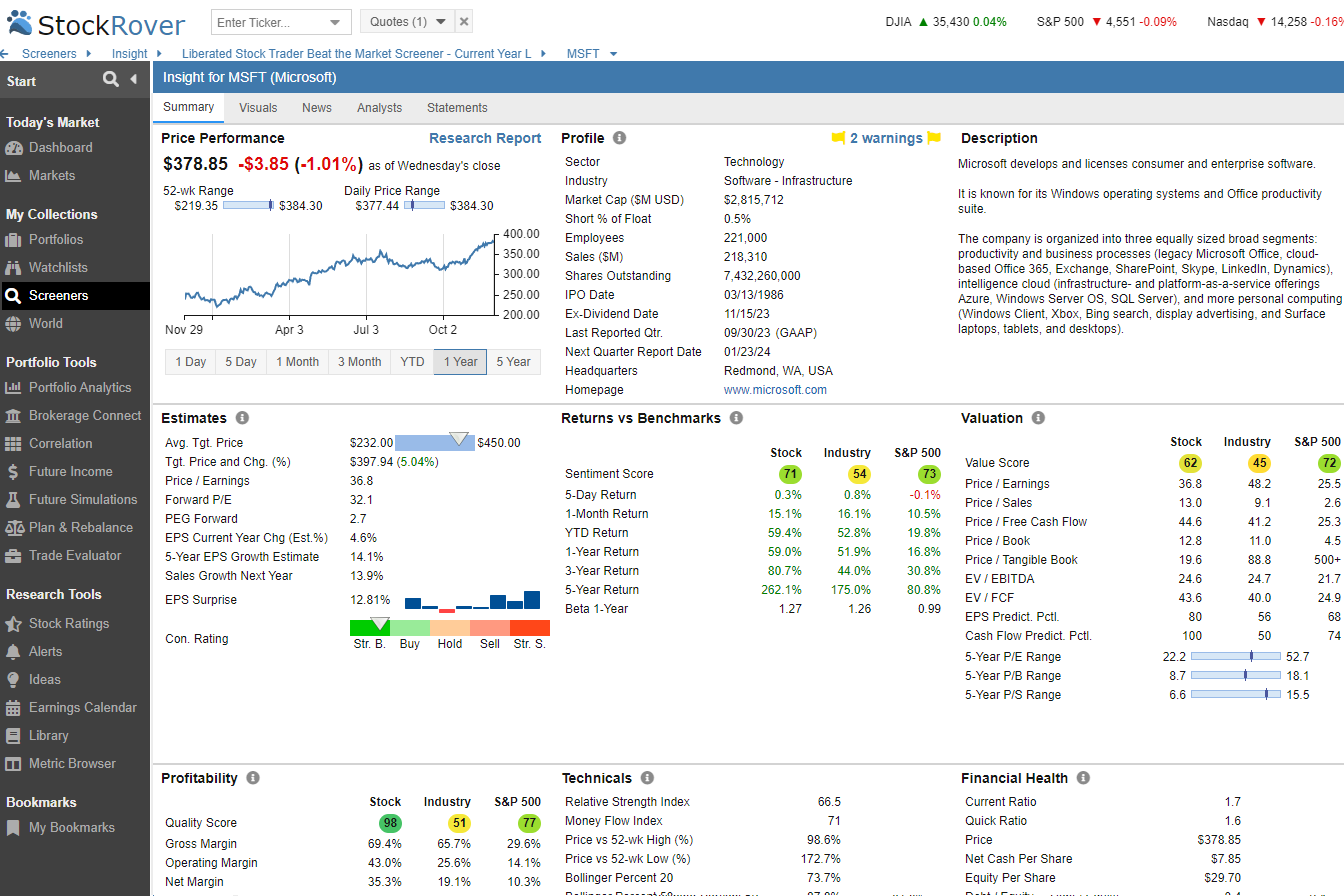
Practical Application with Research Tools
Stock Rover lets you screen companies fast, using these financial metrics. You get full access to balance sheets, income statements, and cash flow data for thousands of public companies. You can filter stocks by P/E ratios, EPS growth rates, and a bunch of other fundamentals.
By mixing document analysis with ratio checks, you can spot opportunities and get a handle on risk. When you throw in market direction analysis, you start to see the bigger picture—the trends that push individual stock performance. All these tools, together, form a much more complete investment framework.
Lesson Section Summary
In this section, we looked at stock analysis and how it is done. We also looked at how to assess the market direction, known as Dow Theory. We then moved on to the stock market rating agencies and introduced you to fundamental analysis.
We then covered the three important documents you need to understand: the balance sheet, the income statement, and the cash flow statement.
Finally, we discussed two important concepts you must grasp: earnings per share and the price-earnings ratio.
Beat The Market, Avoid Crashes & Lower Your Risks
Nobody wants to see their hard-earned money disappear in a stock market crash.
Over the past century, the US stock market has had 6 major crashes that have caused investors to lose trillions of dollars.

The MOSES Index ETF Investing Strategy will help you minimize the impact of major stock market crashes. MOSES will alert you before the next crash happens so you can protect your portfolio. You will also know when the bear market is over and the new rally begins so you can start investing again.
MOSES Helps You Secure & Grow Your Biggest Investments
★ 3 Index ETF Strategies ★
★ Outperforms the NASDAQ 100, S&P500 & Russell 3000 ★
★ Beats the DAX, CAC40 & EURO STOXX Indices ★
★ Buy & Sell Signals Generated ★
MOSES Helps You Sleep Better At Night Knowing You Are Prepared For Future Disasters
Class Questions & Answers
What does “cheap stock” actually mean?
A “cheap stock” usually means a stock that looks inexpensive relative to its fundamentals (like earnings, cash flow, assets, or growth)—not simply a stock with a low share price.
Why is a low share price NOT the same as a good bargain?
A low share price can be misleading because companies can split shares or have different share counts. What matters is the company’s value compared to its profits and financial strength, not whether the stock trades at $5 or $500.
What are three common valuation metrics used to identify “cheap” stocks?
Three common valuation metrics are the P/E ratio (price relative to earnings), price-to-sales (price relative to revenue), and price-to-book (price relative to net assets). Investors often add cash-flow metrics like free cash flow yield for a stronger view.
What is a “value trap” and why is it dangerous?
A value trap is a stock that looks cheap on valuation metrics but stays cheap—or falls further—because the business is deteriorating (declining profits, rising debt, shrinking demand). It’s dangerous because low valuation alone doesn’t guarantee recovery.
What is one rule that can help beginners avoid buying the wrong “cheap” stocks?
Don’t buy based on valuation alone. Confirm business quality first—stable earnings, healthy cash flow, and manageable debt—then check whether the valuation offers a margin of safety.