If you’re new to investing, stock prices can feel mysterious. One day a stock is up 6%, the next day it’s down 4%, and the company itself hasn’t “changed” in any obvious way. The key to understanding price movement is to stop thinking of a stock price as a score and start thinking of it as a market-clearing price—the price at which buyers and sellers agree to trade.
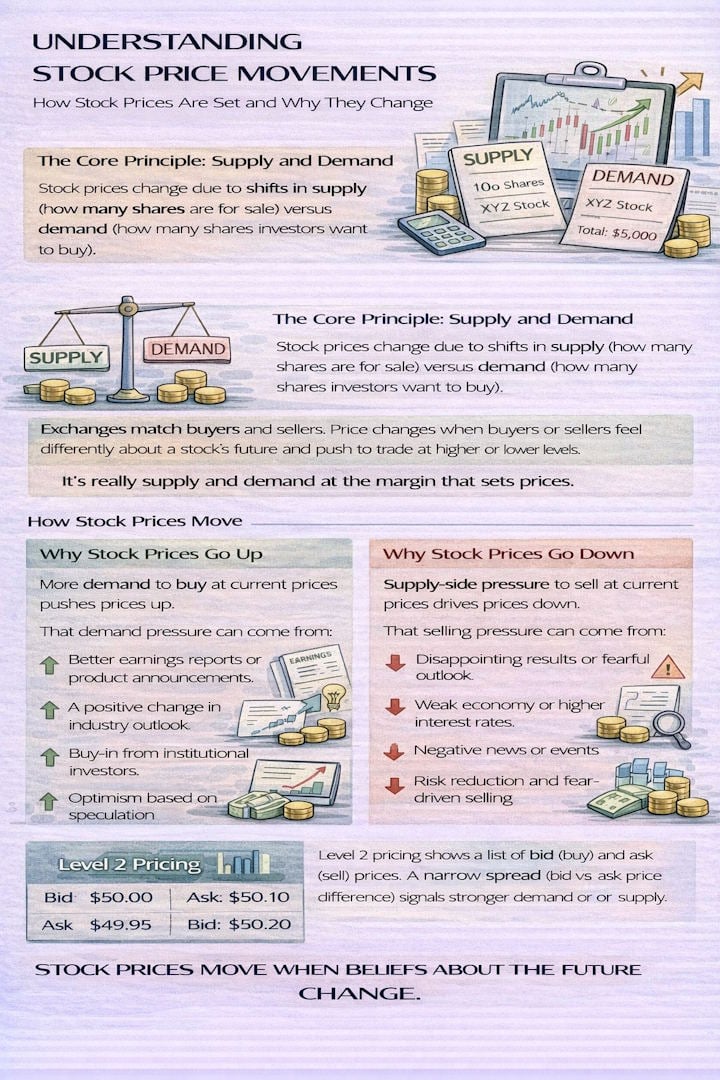
Every price change, no matter how dramatic, comes back to one mechanism: supply and demand. When more people want to buy than sell at the current price, the price rises. When more people want to sell than buy, the price falls.
This lesson explains how stock prices are determined, what drives supply and demand, why prices sometimes don’t move much even on “busy” trading days, and how to use volume as a practical clue for understanding who is in control.
How Stock Prices Are Determined
A stock price is determined in the marketplace where that stock trades. The exchange (or trading venue) matches orders from buyers and sellers. The “current price” you see is essentially the most recent level where a trade occurred—where supply met demand.
Two important implications follow from this:
- Stock prices reflect expectations, not just today’s reality. Investors are always trying to price what the company may earn in the future, not only what it earned last quarter.
- Prices move at the margin. You don’t need “everyone” to change their mind for the price to move—only enough buying or selling pressure at the current price to push trades to the next available level.
In plain English: prices change because the balance between urgent buyers and urgent sellers changes.
What Causes Stock Prices to Change
Many things can shift supply and demand. The most common drivers are:
- Earnings updates and guidance: New information about revenue, profit, margins, or future expectations can attract buyers or trigger selling.
- News events: Lawsuits, product announcements, regulatory changes, geopolitical events, and macroeconomic surprises can all change sentiment quickly.
- Speculation and positioning: Traders may buy or sell based on what they expect others will do next, rather than what the business is worth today.
A beginner-friendly way to think about it is this: anything that changes expectations or perceived risk can change demand (people want to own it) or change supply (people want to get out of it).
What Exchanges Do (and Do Not) Control
Exchanges provide the structure that enables efficient trading. They set rules for how orders interact, how trades are reported, and how markets remain orderly. But they do not “decide” the price in the way a store sets a price tag.
Instead, they create an environment in which price discovery occurs through the matching of buyers and sellers.
Supply and Demand: The Only Direct Cause of Price Movement
Let’s make this practical.
- Supply = how many shares are being offered for sale at different prices
- Demand = how many shares people want to buy at different prices
If demand exceeds supply at the current price, buyers must raise their bids to attract sellers, so the price rises. If supply is stronger, sellers must accept lower bids to get out, so the price moves down.
This is why stock prices can rise even when a company is “not perfect,” and why they can fall even when a company is “still good.” The market is not reacting to the business in isolation—it’s reacting to the business relative to expectations.
Why Stock Prices Go Down
Prices usually fall when there is supply-side pressure: more people want to sell than buy at current prices.
That pressure can come from many sources:
- Disappointing earnings or weaker guidance
- Negative macro conditions (rates, recession risk, geopolitical stress)
- A change in industry outlook
- Fear-driven selling or risk reduction
A helpful way to frame it: selling increases when investors believe the stock is less attractive than alternative uses of their money. That “attractiveness” could change because future profits look smaller, risk looks higher, or the price simply ran ahead of reality.
A simple example of a down move
Imagine a company reports weak quarterly results and signals a worse outlook. Investors reassess the future and decide they don’t want to own the stock at yesterday’s price. Selling rises, while buyers step back. With high supply and low demand, the price drops until enough buyers return because they now see value at the lower price level.
Why Stock Prices Go Up
Prices rise when there is demand-side pressure: more people want to buy than sell at current prices.
Demand can increase because of:
- Strong earnings and improving outlook
- New products, new markets, or improving competitive position
- Better-than-expected industry conditions
- A perception that the stock is undervalued
A classic feature of strong up moves is that existing shareholders become reluctant to sell. That reduced supply forces interested buyers to pay progressively higher prices to get shares, pushing the price upward.
A simple example of an up move
A company reports a strong quarter and delivers optimistic guidance. Current holders decide they want to stay invested, so fewer shares are offered. Meanwhile, new buyers rush in. With high demand and low supply, buyers bid up the price until enough sellers are tempted back into the market.
Eight Common Forces That Move Stock Prices
Beyond the obvious “earnings up, stock up” logic, there are several recurring forces that often drive price changes:
| Price Driver | What It Means in Practice |
|---|---|
| Investor sentiment & expectations | Optimism or fear can move prices faster than fundamentals. |
| Mergers & acquisitions | Takeover expectations can quickly reprice a stock. |
| Industry strength | A rising industry cycle lifts many companies together. |
| Market dominance | A company that controls a niche can protect margins and growth. |
| Competitor weakness | Rivals stumbling can hand market share to stronger firms. |
| New product introductions | Innovation can change long-term earnings expectations. |
| Analyst upgrades/downgrades | Ratings shifts can move flows and perception. |
| Political/regulatory changes | Rules can reshape profitability and risk overnight. |
The important takeaway is not to memorize the list. It’s to recognize the pattern: prices move when beliefs about the future change.
Why Prices Sometimes Don’t Change Much
A confusing market behavior for beginners is this: a stock can trade all day actively and still finish near where it started.
That happens when buy and sell pressure are relatively balanced—often described as a kind of equilibrium.
There are a few common “balanced” scenarios:
Normal demand and normal supply
This is the classic sideways day: average volume, no major catalyst, and no strong urgency on either side. Price may drift slightly, but doesn’t trend aggressively.
Low demand and low supply
This looks like a quiet market: fewer trades, low volatility, and low volume. There isn’t strong buying interest, but there also isn’t strong selling pressure.
High demand and high supply
This can look dramatic: heavy trading volume, but the price doesn’t travel far because buying and selling are both intense and roughly matched. On candlestick charts, this can appear as indecision candles (like a doji) with a large volume bar.
The lesson here is subtle but powerful: high activity doesn’t automatically mean strong direction. Direction comes from imbalance.
How Volume Helps You See Supply and Demand
Volume is one of the few data points that gives you a window into the intensity behind price movement. It doesn’t tell you why people are buying or selling, but it helps you judge how committed market participants are.
Use these simple interpretations:
- Price rising + high volume: strong demand (buyers are active and confident)
- Price rising + low volume: weak demand (move may be fragile)
- Price falling + high volume: strong supply (sellers are in a hurry)
- Price falling + low volume: weak supply (selloff may be fading)
Volume is not a crystal ball, but it’s a useful confirmation tool. It helps you avoid one of the most common beginner mistakes: believing every price move has the same meaning.
The Practical Investor Mindset
If you’re investing (not day trading), you don’t need to explain every tick. What you do need is a stable framework:
- Short term: prices can move on sentiment, positioning, and surprises
- Long term: prices tend to follow business reality—earnings power, risk, and growth
Your job is to avoid emotional interpretation. Instead, ask:
- Did something change expectations meaningfully?
- Did risk increase or decrease?
- Do volume and broader market context support the move?
- Does this change the long-term thesis—or just short-term noise?
That’s how you turn price movement from confusion into information.
Stock Rover 4.7/5⭐ : My Top Pick for Smart Investors
Investing In Stocks Can Be Complicated. Stock Rover Makes It Easy.
★
Growth Investing - with industry-leading
Research Reports ★
★ Value Investing - using Warren Buffett's Fair Value and Margin-of-Safety ★
★ Income Investing - rank by yield, growth, quality, and safety using 650 metrics ★

"I have been researching and investing in stocks for 20 years! I now manage all my long-term investments using Stock Rover." — Barry D. Moore, Founder: LiberatedStockTrader.com
How to see supply and demand for stock through the volume indicator
The best way to determine whether a stock price will rise or fall in the short term is to understand the relationship between stock price and volume.
Understand volume in stocks by reading our professional guide to stock volume.
Class Questions & Answers
What is the single direct reason stock prices move up or down?
Stock prices move because of changes in supply and demand. More buyers than sellers pushes prices up; more sellers than buyers pushes prices down.
Why can a stock trade heavily all day but finish near unchanged?
Because buying and selling pressure can be balanced, high volume indicates activity, but the direction depends on the imbalance—whether buyers or sellers are more active at current prices.
What is supply-side pressure, and what typically causes it?
Supply-side pressure occurs when more investors want to sell than buy at current prices. It often comes from worse earnings expectations, negative news, rising risk, or a deteriorating outlook.
How does volume help you interpret price moves?
Volume shows how much participation is behind a price move. Rising prices on high-volume items suggest stronger demand, while rising prices on low-volume items may be less reliable. Falling prices on high volume suggests strong selling pressure.
Name two non-earnings factors that can move stock prices quickly.
Examples include mergers and acquisitions activity, analyst upgrades or downgrades, political or regulatory changes, and shifts in overall investor sentiment.