A balance sheet shows you a company’s financial position on a particular date. You get a snapshot of what a business owns, what it owes, and how much shareholders have invested.
The core accounting equation here is simple: assets always equal liabilities plus shareholders’ equity. Assets include cash, accounts receivable, inventory, and property.
Liabilities include debts and obligations—think accounts payable, loans, and leases.
Shareholders’ equity is the investors’ stake, combining common stock and retained earnings.
If you want to analyze balance sheets, platforms like Stock Rover let you dig deep into financial and fundamental research.
Is a Balance Sheet Important?
The balance sheet isn’t just another financial statement—it’s the one that lays out a company’s financial health at a specific date. Investors lean on balance sheets to see if a company’s assets cover its obligations and to figure out net worth by comparing assets and liabilities.
Lenders review balance sheets before they extend loans or credit lines. They want to see collateral and financial stability.
The importance of a balance sheet hits several groups:
- Business owners can see changes in equity and where resources go.
- Financial analysts compare positions across different periods.
- Regulatory bodies check for compliance.
- Management teams use it to make capital structure decisions.
Platforms like Stock Rover let investors dig into balance sheets alongside other metrics for deeper research and screening.
But balance sheets aren’t perfect. They capture only a single moment in time, so they miss recent transactions or market changes. Asset values might not match current market prices, and you won’t find intangible stuff like employee expertise or customer loyalty on there.
The Balance Sheet
A balance sheet lists a company’s assets, liabilities, and shareholders’ equity at a specific date. The basic equation—Assets = Liabilities + Shareholders’ Equity—ensures that everything balances.
Components of a balance sheet break down into three main sections:
- Assets: Current assets (cash, inventory, accounts receivable) and long-term assets (property, equipment, investments)
- Liabilities: Current liabilities (accounts payable, short-term debt) and long-term liabilities (bonds, mortgages)
- Shareholders’ Equity: Retained earnings, common stock, additional paid-in capital
All public companies must provide this statement under standard accounting rules. A comparative balance sheet presents multiple periods side by side to highlight changes over time.
You’ll use a balance sheet to check company stability, calculate financial ratios, and figure out net worth. Investors can use platforms like Stock Rover for deep research and screening across different periods. The statement shows where money comes from (liabilities) and how it’s used (assets), giving everyone a clear view of financial health and resource allocation.
Here’s a straightforward example for a small retail business:
| ABC Retail Company Balance Sheet | As of December 31, 2025 |
|---|---|
| ASSETS | |
| Current Assets | |
| Cash | $15,000 |
| Accounts Receivable | $8,000 |
| Inventory | $25,000 |
| Total Current Assets | $48,000 |
| Long-term Assets | |
| Equipment | $30,000 |
| Less: Accumulated Depreciation | ($5,000) |
| Total Long-term Assets | $25,000 |
| TOTAL ASSETS | $73,000 |
| LIABILITIES | |
| Current Liabilities | |
| Accounts Payable | $12,000 |
| Short-term Loan | $5,000 |
| Total Current Liabilities | $17,000 |
| Long-term Liabilities | |
| Bank Loan | $20,000 |
| Total Long-term Liabilities | $20,000 |
| TOTAL LIABILITIES | $37,000 |
| EQUITY | |
| Owner’s Capital | $30,000 |
| Retained Earnings | $6,000 |
| TOTAL EQUITY | $36,000 |
| TOTAL LIABILITIES & EQUITY | $73,000 |
You can see assets match liabilities plus equity ($73,000 = $37,000 + $36,000).
The Balance Sheet Formula
The formula here is Assets = Liabilities + Equity. This is the backbone of double-entry bookkeeping, and it keeps everything balanced.
Every transaction affects at least two parts of this formula. When you review balance sheets on Stock Rover, you can double-check that total assets always match up with liabilities plus shareholder equity.
This formula spells out what a company owns and how those assets are financed—either through debt (liabilities) or ownership (equity).
Balance Sheet Assets
Balance sheet assets cover everything a company owns that’s worth money. The assets section sorts items by liquidity, starting with the most liquid current assets and moving to less liquid long-term assets.
Cash and Equivalents on the Balance Sheet
Cash and cash equivalents go at the top because they’re the most liquid. This includes physical cash, bank balances, money market funds, and treasury bills that mature in three months or less.
To qualify as a cash equivalent, an asset must be readily convertible into a known cash amount and carry almost no risk of changing value. Companies maintain sufficient cash and equivalents to cover obligations and manage surprises.
A strong cash position gives you flexibility and cuts down on the need for outside financing. You can track cash trends over time with Stock Rover and compare liquidity across companies in the same sector.
Short-Term Investments on the Balance Sheet
Short-term investments are marketable securities or other financial instruments that a company plans to cash out within a year. These assets typically yield higher returns than cash but remain relatively liquid.
You’ll see things like government securities, commercial paper, and certificates of deposit here. Companies might also hold corporate bonds and equity securities in this category if they plan to sell within the operating cycle.
Depending on accounting rules and how the investment’s classified, it appears at cost or at fair market value. Management picks short-term investments based on expected yield, risk tolerance, and cash needs.
Trade Accounts Receivable on the Balance Sheet
Accounts receivable are what customers owe for goods or services delivered on credit. This asset shows revenue that’s been earned but not yet collected.
Companies report receivables after subtracting an allowance for doubtful accounts (an estimate of what won’t get paid). The aging of receivables tells you how well the company collects and whether cash flow could be a problem.
High receivables might mean strong sales, but they could also signal trouble with collections. The receivables turnover ratio helps you see how quickly credit sales turn into cash.
Inventory on the Balance Sheet
Inventory covers raw materials, work-in-progress, and finished goods ready for sale. Manufacturers usually have all three, while retailers mostly hold finished goods.
| Inventory Type | Description |
|---|---|
| Raw Materials | Inputs awaiting production |
| Work-in-Progress | Partially completed goods |
| Finished Goods | Products ready for sale |
Companies use methods like FIFO, LIFO, or weighted average cost to value inventory. That choice affects how inventory looks on the balance sheet and how cost of goods sold appears on the income statement.
Prepaid Expenses
Prepaid expenses are payments made for benefits that’ll be received in the future. Think insurance premiums, rent, and annual subscriptions paid up front.
These assets shrink over time as the company uses the prepaid services. You’ll see prepaid expenses under current assets if the benefit comes within a year.
Long Term Assets
Long-term assets include property, plant, and equipment used for more than a year. This covers real estate, machinery, vehicles, and furniture.
Companies record these at historical cost and depreciate them over their useful lives—except for land, which doesn’t depreciate.
Fixed assets are the backbone of operations for many businesses. Industries like manufacturing and utilities tend to have big balances here.
If you want to see how companies manage long-term assets, TradingView charts let you track capital spending and compare asset efficiency ratios across peers.
Intangible Assets
Intangible assets don’t have physical form but can be valuable because of legal rights or competitive advantages. Patents, trademarks, copyrights, and intellectual property all fit here.
Goodwill pops up when a company buys another business for more than the fair value of its net assets. That extra reflects things like brand reputation or customer loyalty.
Companies amortize intangible assets with set lifespans over the expected period. Those with indefinite lives, like some trademarks, get tested for impairment every year instead of being amortized.
The noncurrent assets section lists these separately from tangible assets.
Balance sheet liabilities
Balance sheet liabilities are all the debts and financial obligations a company owes to others. You’ll see these split into current liabilities (due within a year) and long-term liabilities (due after a year).
The liabilities section sits on the right side of the balance sheet if you’re using the account format, or below assets in the report format. This part matters for checking a company’s ability to meet its obligations.
Accounts payable
Accounts payable show what’s owed to suppliers and vendors for goods or services bought on credit. It’s a current liability, since payment usually happens within 30 to 90 days.
Companies track accounts payable closely to keep suppliers happy and avoid late fees. The balance shifts as purchases and payments happen during the period.
Key characteristics of accounts payable:
- Short-term obligations to trade creditors
- Usually, there is no formal agreement or interest charges
- Payment terms run from net 30 to net 90 days
- Directly affects working capital
You can use Stock Rover to analyze accounts payable trends and see how well a company manages its payments compared to others.
Accrued expenses
Accrued expenses are costs that have happened but haven’t been paid yet by the reporting date. These include salaries, utilities, interest, and other regular expenses that pile up over time.
Examples: wages earned but not yet paid, interest that’s built up but not due until later, and taxes that’ll be paid in the next period. Companies record these to match costs to the revenue they help produce.
Accrual accounting requires businesses to recognize these when they happen, not when the cash leaves. That way, the balance sheet shows all liabilities at the right date.
Loans
Loans show up as current or noncurrent liabilities depending on when they’re due. The current portion of long-term debt is what’s due in the next 12 months; the rest is long-term.
Loan categories on the balance sheet:
| Type | Classification | Repayment Period |
|---|---|---|
| Short-term debt | Current liabilities | Within 12 months |
| Notes payable | Current noncurrent | Varies by terms |
| LoNoncurrentts | Noncurrent liabilities | Beyond 12 months |
| Current portion of long-term debt | Current liabilities | Next 12 months only |
Banks and bondholders lend money with specific interest rates, repayment schedules, and sometimes covenants. Loan terms spell out when payments are due, and some loans tack on prepayment penalties.
Companies have to manage their debt obligations carefully to keep their credit solid and stay flexible. Too much debt can squeeze cash flow and limit growth.
Deferred income tax
Deferred tax liability pops up when a company owes taxes in future periods because of timing differences between financial and tax returns. It is a noncurrent liability that’ll get paid as those differences reverse.
Things like customer prepayments and accelerated depreciation can cause taxable income to differ from book income. The deferred tax liability account tracks these future obligations.
Tax authorities require all sorts of payments—income, property, payroll taxes—that show up in the liabilities section, depending on when they’re due.
Shareholder Equity
Shareholder equity is what’s left after you subtract all liabilities from a company’s assets. This section of the balance sheet includes common stock, preferred stock, treasury stock, and retained earnings.
Stockholders’ equity reflects the book value of shareholders’ interest. It’s made up of investor contributions and profits kept in the company instead of being paid out as dividends. The math is simple: total assets minus total liabilities equals shareholders’ equity, also called owner’s equity or net assets.
Balance sheet shareholders equity example
Common stock shows up on the balance sheet at par value, which is almost always different from the market price. You might see a company trading at $500 per share, but the balance sheet still just lists $1 par value per share. In liquidation, shareholders usually get paid based on this par value, but honestly, they’re last in line—creditors and bondholders get their cut first.
Retained earnings track all the profits a company keeps in the business instead of paying out as dividends. This number climbs when the company earns net income and drops if they pay dividends or takes a loss.
Treasury stock knocks down total equity when the company buys back its own shares. Preferred stockholders get priority for dividends and liquidation payouts over common stockholders.
You can dig into these equity components with platforms like Stock Rover. It’s handy for comparing how different companies structure their equity and for deep dives into financials.
Book Value
Book value tells you what a company would be worth if it sold everything and paid off all debts. To get book value per share, divide total common shareholders’ equity by the average number of common shares outstanding.
This metric gives you a baseline value that ignores market hype or panic. Book value per share lets you see if a stock trades above or below its accounting value. Companies with lots of tangible assets usually post higher book values. Service-based businesses, even if they rake in profits, might report lower book value.
FAQs
What is accumulated depreciation on a balance sheet?
Accumulated depreciation adds up all the depreciation charges recorded against an asset since the company bought it. You’ll find this contra-asset account under long-term assets, and it reduces the asset’s reported value.
To get book value, subtract accumulated depreciation from the asset’s original cost. This approach follows generally accepted accounting principles and shows how the asset’s value drops over its useful life.
An asset’s accumulated depreciation can be way off from its fair value or what you’d get selling it right now. The balance sheet only lists historical cost minus accumulated depreciation, but the market might see things differently depending on demand and condition.
What is depreciation?
Depreciation spreads an asset’s cost over its useful life with regular expense charges. It’s how companies recognize that things like equipment, buildings, and vehicles lose value every year.
Wear and tear, new tech, and economic changes all drive depreciation. Companies record depreciation expense on the income statement and add the total to the balance sheet. This helps match the asset’s cost with the revenue it helps bring in, so financial statements reflect reality for each period.
If you’re curious about how depreciation affects profits or working capital, tools like Stock Rover let you track it across companies and spot trends.
What is stockholders’ equity on a balance sheet?
Stockholders’ equity is what’s left for shareholders after the company pays off all liabilities. This section includes common stock, preferred stock, extra paid-in capital, and retained earnings.
The equity balance shows what shareholders would get if the company liquidated everything at book value and cleared its debts. Investors look at stockholders’ equity to gauge solvency and calculate ratios like the debt-to-equity ratio to measure leverage and risk.
What is goodwill on a balance sheet?
Goodwill pops up when a company buys another business for more than the fair value of what it owns. That extra amount covers things like brand reputation, customer lists, and other intangibles.
Companies list goodwill at historical cost under long-term assets. Unlike other assets, goodwill doesn’t get depreciated every year. Instead, companies have to test it once a year for impairment and write it down if its value drops below what’s recorded.
How do you calculate net income from the balance sheet?
You can’t pull net income straight from the balance sheet. The income statement actually reports net income by taking total revenue and subtracting expenses for a given period.
Still, if you look at changes in retained earnings between two balance sheet dates and adjust for dividends, you can get a pretty good idea of net income. Net income flows from the income statement to retained earnings, linking the two statements. The statement of cash flows gives extra context for how net income turns into actual cash and liquid assets.
What are retained earnings on a balance sheet?
Retained earnings show the profits a company has kept and reinvested instead of paying out as dividends. You’ll find this account within stockholders’ equity, and it grows with each period’s net income that’s held back.
Companies use retained earnings to run operations, pay down debt, or fund growth projects. The balance totals up all profits since the company started, minus dividends paid out. Watching retained earnings over time helps you see how management allocates capital and whether the company can keep making money through different business cycles.
Frequently Asked Questions
What are the key components of a balance sheet?
A balance sheet breaks down into three main parts: assets, liabilities, and shareholders’ equity. They always have to balance, thanks to the core accounting equation: Assets = Liabilities + Shareholders’ Equity.
Assets fall into two groups:
- Current Assets: Cash, accounts receivable, inventory, and anything else you expect to convert to cash within a year
- Long-term Assets: Property, plant, equipment, intangible assets, and investments you plan to keep for more than a year
Liabilities split out as:
- Current Liabilities: Accounts payable, short-term debt, and accrued expenses due within a year
- Long-term Liabilities: Bonds payable, long-term loans, deferred tax liabilities, and other obligations that stretch beyond a year
Shareholders’ Equity is what’s left after liabilities. This section covers common stock, retained earnings, and additional paid-in capital.
How do you read and interpret a balance sheet?
When you read a balance sheet, remember it’s just a snapshot at a single point in time. It usually comes in account form (assets on the left, liabilities and equity on the right) or report form (assets first, then liabilities and equity stacked vertically).
Start by looking at total assets to see what the company owns. Compare current assets to current liabilities to get the current ratio. If it’s above 1.0, the company can handle its short-term bills.
Next, check out the asset mix. A company loaded with liquid assets faces different risks than one heavy on fixed assets. Dive into liabilities to see debt levels and when payments come due.
The equity section shows what’s actually owned by shareholders. If you want to compare these numbers across companies, Stock Rover offers detailed balance sheet analysis and automated screens to spot financial strengths and weaknesses.
What are the differences between assets, liabilities, and equity on a balance sheet?
Assets are resources the company owns or controls that generate future economic benefits. Basically: What does the company have?
Liabilities are what the company owes to others. They’re claims against assets—so, what does the company owe?
Equity is the owners’ share after all liabilities are paid. In other words: What’s left for the shareholders?
Here’s the relationship in formula form:
Assets = Liabilities + Equity
Or, flipped around:
Equity = Assets – Liabilities
Equity grows if assets climb faster than liabilities or if liabilities shrink faster than assets. Companies list assets and liabilities by liquidity, with the most liquid items at the top.
How does a balance sheet reflect the financial health of a company?
A balance sheet shows financial health through several markers. Liquidity comes from comparing current assets to current liabilities—if the company can cover short-term obligations, that’s a good sign.
The debt-to-equity ratio measures financial leverage. If it’s under 1.0, the company leans more on equity than debt, which usually means less risk. Higher ratios could point to aggressive growth or maybe some solvency red flags.
Working capital (current assets minus current liabilities) tells you about operational efficiency. Positive working capital means the business can fund daily operations without scrambling for cash.
The mix of assets says a lot about the business. Manufacturers should have a lot of fixed assets, while service businesses usually don’t. With TradingView, you can chart financial ratios from balance sheets over time, spotting trends in leverage, liquidity, and asset use across different markets.
A strong balance sheet keeps debt manageable, holds enough cash, and shows equity growing. These features help companies weather downturns and chase new opportunities.
What common mistakes should be avoided when analyzing a balance sheet?
People often make the mistake of looking at just one balance sheet by itself. You’ll get a much clearer picture if you line up multiple periods or compare the numbers to industry peers.
Trends tell you more than any single snapshot ever could.
If you skip the footnotes or ignore a company’s accounting policies, you can easily misread the numbers. Companies use different methods for things like depreciation, inventory valuation, or revenue recognition.
These choices can seriously shape the reported figures.
It’s easy to miss off-balance-sheet items, too. Operating leases, contingent liabilities, and special purpose entities might not show up directly, but they still affect the company’s financial position.
Common analytical errors include:
- Not adjusting for what’s normal in the industry
- Forgetting to check the quality of assets—like whether receivables are really collectible or if inventory is outdated
- Ignoring when liabilities actually come due
- Overlooking how subjective intangible asset valuations can be
- Skipping over currency fluctuations in international operations
Some analysts get stuck just staring at the totals, without digging deeper.
Class Questions & Answers
What is a balance sheet, in plain English?
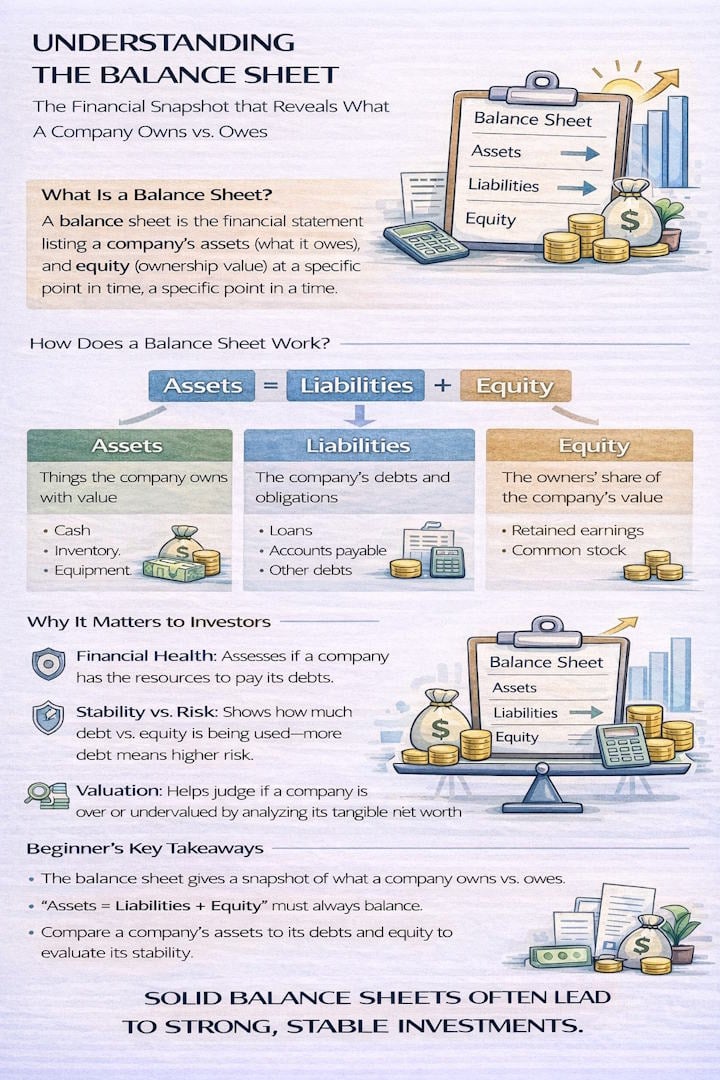
A balance sheet is a financial snapshot that shows what a company owns (assets), what it owes (liabilities), and what is left for shareholders (equity) at a specific point in time.
What does the equation “Assets = Liabilities + Equity” mean?
It means every asset the company has is funded either by borrowing money (liabilities) or by the owners’ capital and retained profits (equity). The balance sheet must always balance because assets are financed by one of these two sources.
What is the difference between assets and liabilities?
Assets are things the company owns or controls that have value (like cash, inventory, equipment). Liabilities are obligations the company must pay (like loans, accounts payable, or other debts).
Why do investors care about a company’s balance sheet?
The balance sheet helps investors judge financial strength. It shows liquidity (ability to pay bills), leverage (how much debt the company uses), and overall stability—especially important during economic downturns.
What is one quick warning sign a beginner can spot on a balance sheet?
A quick warning sign is excessive debt relative to the company’s size and earnings, or weak liquidity—such as low cash compared to short-term liabilities. These can indicate higher financial risk if conditions worsen.