Fundamental analysis involves diving into financial statements, examining profitability ratios, and understanding a company’s competitive advantages.
Using fundamental analysis, investors can uncover good businesses with a fair stock price. This approach is used by long-term investors who are interested in a company’s overall health and potential growth. It also includes gauging the economy’s health and impact on the company’s sector.
Fair value and margin of safety, combined with earnings growth and solid cash flow, are the key ingredients in a recipe for good fundamental analysis.
Key Takeaways
- Fundamental analysis evaluates a stock’s intrinsic value via financial and economic study.
- This method aids investors in identifying long-term investment opportunities.
- It encompasses both quantitative financial metrics and qualitative factors of a company’s performance.
- Sucessful value, dividend, and growth investing all utilize fundamental analysis.
Fundamental analysis is a method used by investors to determine a stock’s intrinsic value and predict its future price movements.
This approach assesses securities by analyzing a company’s financial well-being, as well as external factors such as the overall economy and industry conditions. By doing so, investors aim to understand whether a stock is overvalued, undervalued, or fairly priced.
Investors who use fundamental analysis look beyond short-term market fluctuations. They focus on long-term investment opportunities by scrutinizing a company’s revenue, expenses, assets, liabilities, and growth potential.
This method can also incorporate qualitative factors such as management expertise, industry cycles, and market share.
Combining these quantitative and qualitative analyses helps form a comprehensive picture of a company’s performance and potential for future growth.
The ultimate goal is to leverage this information to make trading decisions that align with an investor’s financial goals and risk tolerance.
Stock Rover 4.7/5⭐ : My Top Pick for Smart Investors
Investing In Stocks Can Be Complicated. Stock Rover Makes It Easy.
★
Growth Investing - with industry-leading
Research Reports ★
★ Value Investing - using Warren Buffett's Fair Value and Margin-of-Safety ★
★ Income Investing - rank by yield, growth, quality, and safety using 650 metrics ★

"I have been researching and investing in stocks for 20 years! I now manage all my long-term investments using Stock Rover." — Barry D. Moore, Founder: LiberatedStockTrader.com
Understanding Fundamental Analysis
Fundamental analysis is a cornerstone of investing; it involves a deep dive into financial statements to assess a company’s intrinsic value. Investors gauge a company’s financial health and future performance by calculating metrics such as return on equity (ROE) and earnings per share (EPS).
Key Principles of Fundamental Analysis
The core objective of fundamental analysis is to determine a stock’s true or intrinsic value. This involves assessing the company’s financial performance, industry comparisons, and economic factors.
At its base, fundamental analysts study the financial statements—income statements, balance sheets, and cash flow statements—to evaluate a company’s assets, liabilities, and cash flows, influencing stock value.
Income Statements
A company’s income statement clearly shows its profitability by detailing revenues and expenses and ending in net income for a specific period. Key elements like earnings per share (EPS) are derived from the income statement and offer insight into a company’s profitability per share.
Balance Sheets
Meanwhile, the balance sheet reveals the company’s financial standing at a point in time, showcasing assets like cash and equipment and liabilities, including loans and accounts payable. The difference between these assets and liabilities is known as equity.
A strong balance sheet indicates solid financial health, but it must be analyzed with the company’s cash flow statement.
Cash Flow Statements
The cash flow statement breaks down the actual cash flows into operations, investing, and financing activities. It is crucial because it shows how well a company manages its cash, a vital indicator of financial stability.
Positive cash flow indicates that a company’s liquid assets are increasing, allowing it to settle debts, reinvest in its business, pay dividends to shareholders, or save for future challenges. Conversely, consistent negative cash flows may signal trouble ahead.
Cash flow analysis complements other financial statement analyses to provide a comprehensive view of a company’s financial health.
A Quick Fundamental Analysis Checklist
How do you analyze a company’s financial performance? There are three basic steps to fundamental analysis:
1. Estimate a company’s intrinsic value
One way to estimate a company’s intrinsic value is to use a discounted cash flow (DCF) model. In a DCF model, you forecast the company’s future cash flows and then discount them back to the present using a risk-adjusted rate. The resulting figure is your estimate of the company’s intrinsic value.
Fair Value & Margin of Safety Calculator
Estimate intrinsic value using discounted future earnings and a terminal valuation multiple.
Core Inputs
Single Scenario Assumptions
Single Scenario Results
Projected Earnings & Present Value
| Year | Projected EPS | Discount Factor | Present Value |
|---|---|---|---|
| Enter your assumptions and click Calculate. | |||
2. Compare the current price to the intrinsic value
When a company’s stock price is below its intrinsic value, it trades at a discount. When a company’s stock price is above its intrinsic value, it trades at a premium. Investors who use fundamental analysis try to buy and sell stocks at a discount when trading at a premium. This is called value investing.
3. Decide to buy, sell, or hold
After you have estimated a company’s intrinsic value and compared it to the current stock price, you can decide whether to buy, sell, or hold the stock. If you think the stock is undervalued, you may want to buy it. If you think the stock is overvalued, you may want to sell it. And if you think the stock is fairly valued, you may want to hold onto it.
What affects a company’s intrinsic value?
Intrinsic value is based on cash flow, the amount of money a company generates from its operations. Factors that can affect cash flow and, therefore, intrinsic value include economic conditions, industry trends, competition, management effectiveness, and financial health.
1. Management
The quality of a company’s management team can greatly impact its long-term success. When evaluating management, look for experienced leaders with a good track record of growing the business and generating shareholder value.
2. Earnings
Earnings are the profits that a company generates from its business operations. When analyzing earnings, look for consistently profitable companies with a strong track record of earnings growth.
3. Assets
A company’s assets can be divided into two categories: physical assets and intangible assets. Physical assets include things like factories, land, and inventory. Intangible assets include things like patents, copyrights, and customer relationships. When evaluating a company’s assets, look for businesses with a diversified mix of physical and intangible assets.
4. Liabilities
Liabilities are the debts and other obligations that a company owes. When analyzing liabilities, look for companies with a strong balance sheet and low debt levels.
Many other factors can affect a company’s intrinsic value, but these are some of the most important ones to consider. By estimating a company’s intrinsic value and comparing it to the current stock price, you can make informed investment decisions about buying, selling, or holding the stock.
Fundamental vs. Technical Analysis
Fundamental analysis analyzes a company’s financial performance and prospects by examining its underlying factors, such as management, earnings, assets, and liabilities. The goal of fundamental analysis is to identify a company’s true value and invest in it when it is selling at a discount.
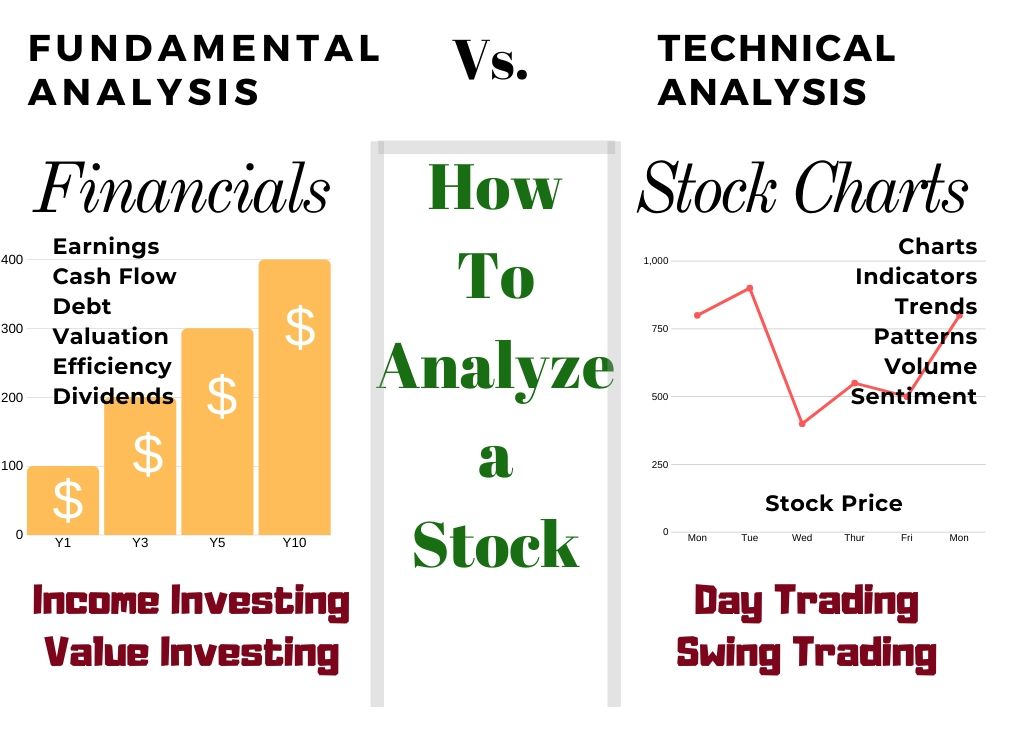
On the other hand, technical analysis is a method of analyzing the financial markets by studying past market data, such as price charts and volume trends. The goal of technical analysis is to identify market patterns and use those patterns to predict future market movements.
Fundamental and technical analysis have strengths and weaknesses, and many investors use both methods to make investment decisions.
Combining Fundamental and Technical Analysis
There are several different ways to combine fundamental and technical analysis. One way is to use fundamental analysis to identify good stocks and technical analysis to determine when to buy or sell those stocks. Another is to use technical analysis to identify overvalued or undervalued stocks and then use fundamental analysis to determine if they are likely to return to their fair value.
Some investors combine fundamental and technical analysis when making investment decisions. They may use technical analysis to identify good entry and exit points and then use fundamental analysis to confirm that the stock is a good long-term investment.
Integrating fundamental analysis with technical analysis helps traders understand the value of the stock and the market sentiment and trends. This harmonized approach caters to short-term traders and long-term investors, allowing for robust analysis and improved forecast accuracy.
Try TradingView, Our Recommended Tool for International Traders
Global Community, Charts, Screening, Analysis, Broker Integration, Financial Metrics, Ratios & Analysis with TradingView

Global Financial Analysis for Free on TradingView
Evaluating a Company’s Financial Performance
When investors scrutinize a company’s financial performance, they closely examine profitability, revenue growth, return on equity (ROE), and various financial ratios. These metrics provide insight into the company’s operational efficiency, earnings power, and market position.
Analysis of Profitability and Revenue Growth
Profitability clearly indicates a company’s ability to generate earnings relative to its revenue, costs, and equity. Analysts often look at net income, which represents the actual profit after all expenses and taxes have been subtracted from total revenue.
A consistent increase in net income points to effective cost management and a potential competitive advantage.
Revenue growth is equally important in the evaluation process. It demonstrates a company’s ability to expand its business activities and market share.
An upward trend in revenue over sequential periods suggests that the company is growing and could indicate strong demand for its products or services.
Evaluating Return on Equity and Financial Ratios
Return on Equity (ROE) measures a company’s profitability by revealing how much profit a company generates with the money shareholders have invested.
A high ROE value is typically an indicator of efficient management and a profitable business model. Analysts compare a company’s ROE with its industry peers to gauge relative performance.
Financial ratios are crucial for assessing a company’s financial health and operational efficiency.
Some key ratios include:
- Price-to-earnings (P/E) Ratio: This ratio helps assess whether a stock’s price is high or low relative to its earnings.
- Debt-to-Equity (D/E) Ratio: Indicates how much debt a company uses to finance its assets relative to the equity.
- Current Ratio: Provides a sense of the company’s ability to pay short-term obligations.
These ratios can also hint at a company’s growth prospects and whether it holds a competitive advantage in its industry.
Analyzing these metrics alongside one another can form a more comprehensive view of a company’s financial standing.
Macroeconomic and Industry Analysis
In fundamental analysis, macroeconomic and industry assessments are critical for evaluating stocks’ potential performance. Investors scrutinize various economic indicators and industry trends to forecast companies’ financial health and growth prospects.
The Role of Economic Indicators
Economic indicators provide investors with insights into the health of the economy. They analyze macroeconomic factors such as GDP growth rates, inflation, unemployment, and interest rates.
For instance, high inflation can erode consumer purchasing power, potentially affecting the sales of consumer-dependent industries. Conversely, low unemployment rates might signal a strong economy, possibly leading to higher disposable income and increased spending.

Investors utilize these data points to gauge the economic environment in which industries operate, which can impact market performance.
Moreover, by assessing economic factors like changes in monetary policy, such as adjustments in interest rates, investors can make predictions about market sectors that are sensitive to these changes.
For example, rate hikes often impact industries with high debt levels, such as utilities, more than others.
Assessing Industry Trends and Competitive Position
Investors look at specific industry trends that can drive performance when analyzing industries. They consider factors like technological advancements, regulatory changes, and shifts in consumer preferences.
For example, rapid innovation and adoption rates in the information technology sector can lead to substantial revenue growth for companies with a competitive advantage.
Investors also examine industry groups to determine which ones outperform or underperform the market. This can be achieved by comparing financial metrics such as profit margins and return on equity across different sectors.
Recognizing industries with strong growth potential and sustainable competitive advantages allows investors to identify stocks that may outperform their peers.
They particularly look for companies with a record of weathering economic downturns, maintaining profitability during challenging market conditions, or benefiting from secular industry growth trends.
You want to be a successful stock investor but don't know where to start.
Learning stock market investing on your own can be overwhelming. There's so much information out there, and it's hard to know what's true and what's not.

Liberated Stock Trader Pro Investing Course
Our pro investing classes are the perfect way to learn stock investing. You will learn everything you need to know about financial analysis, charts, stock screening, and portfolio building so you can start building wealth today.
★ 16 Hours of Video Lessons + eBook ★
★ Complete Financial Analysis Lessons ★
★ 6 Proven Investing Strategies ★
★ Professional Grade Stock Chart Analysis Classes ★
In-Depth Market Analysis Approaches
When embarking on fundamental analysis for stock trading, investors often adopt either a top-down or bottom-up approach to examine the market position and growth potential of the businesses they are interested in. Each method offers a different lens through which the economic environment and the company’s business model can be assessed.
Top-Down vs. Bottom-Up Fundamental Analysis
Top-down fundamental Analysis begins with the broad macroeconomic environment before narrowing to industry sectors and specific stocks.
In this approach, an investor first analyzes global economics, including GDP growth, inflation, and interest rates. They then look at how these factors affect different industries. For example, rising interest rates might be detrimental for high-debt companies.
On the other hand, Bottom-Up Fundamental Analysis takes a more micro approach, starting with individual companies’ financial health and potential.
Here, an investor focuses on a company’s earnings, balance sheet, and business model regardless of the wider economic trends. This method can identify potentially strong companies in out-of-favor sectors.
Assessing Market Position and Growth Potential
Understanding a stock’s Market Position involves analyzing the company’s competitive edge, market share, and industry ranking.
For instance, examining a firm’s return on equity (ROE) and comparing it with peers can gauge its efficiency at generating profits from shareholder equity.
To appraise a company’s Growth Potential, an investor studies its past revenue, earnings growth, and future earnings projections. Strategic initiatives, product pipelines, and expansion plans also paint a picture of potential growth.
The evaluation must consider the industry life cycle stage, as a mature industry may offer less room for rapid expansion than an emerging one.
In both market position and growth potential assessment, the economic environment can not be entirely discounted, even in a bottom-up approach that emphasizes individual business merits. Economic factors can still influence the company’s performance and growth prospects.
Integrating Fundamental Analysis in Trading Strategies
Incorporating fundamental analysis into trading strategies empowers investors to identify stocks’ intrinsic values and make more informed decisions. By comparing these values to market prices, traders can exploit discrepancies to their advantage.
Determining Fair Value and Identifying Undervalued Stocks
Fair value and its margin of safety is the estimated true worth of stock, ascertained through the deep analysis of various financial fundamentals, including earnings, dividends, and the growth rate of these elements.
FAQ
What is the best investing software for fundamental analysis?
Stock Rover is the best fundamental analysis research software, allowing investors to analyze and compare key financial metrics of individual stocks, industries, and sectors. With detailed calculations for fair value, margin of safety, discounted cash flow, and real-time research reports, Stock Rover leads the pack.
What are some common metrics used in fundamental analysis?
Some common metrics used in fundamental analysis include price-to-earnings (P/E) ratio, price-to-book (P/B) ratio, return on equity (ROE), and dividend yield. These metrics help investors evaluate a company's profitability, valuation, and potential for future growth.
What are the key components of fundamental analysis?
The key components include evaluating a company's financial statements—such as income statements, balance sheets, and cash flow statements. Analysts also consider economic indicators, industry trends, and the effectiveness of a company's management.
How do beginners perform fundamental analysis on stocks?
Beginners should review a company's financials, including revenue, profit margins, and recent earnings reports. It's also beneficial to read industry news and trends to understand the market's direction.
What's the difference between fundamental and technical analysis in trading?
Fundamental analysis focuses on a company's intrinsic value, examining its financials and business conditions. On the other hand, technical analysis involves studying statistical trends and patterns in stock price movements. Fundamental analysis is typically used for long-term investment strategies, while traders often employ technical analysis with a shorter-term perspective.
How should I use fundamental analysis to evaluate a stock?
You should start by reviewing financial performance to assess its stability and profitability. Then, compare these figures with industry benchmarks and peer companies. Next, the evaluation would cover the company's management and growth potential.