The chart I am looking at is hard to ignore. The Shiller PE ratio for the S&P 500 is sitting around 41, a level that has only appeared during the 1929 crash and the DotCom bust. It does not mean the market must crash tomorrow. It does not even mean the market cannot go higher. But it does tell me one uncomfortable thing: investors are paying an extremely high price for normalized earnings.
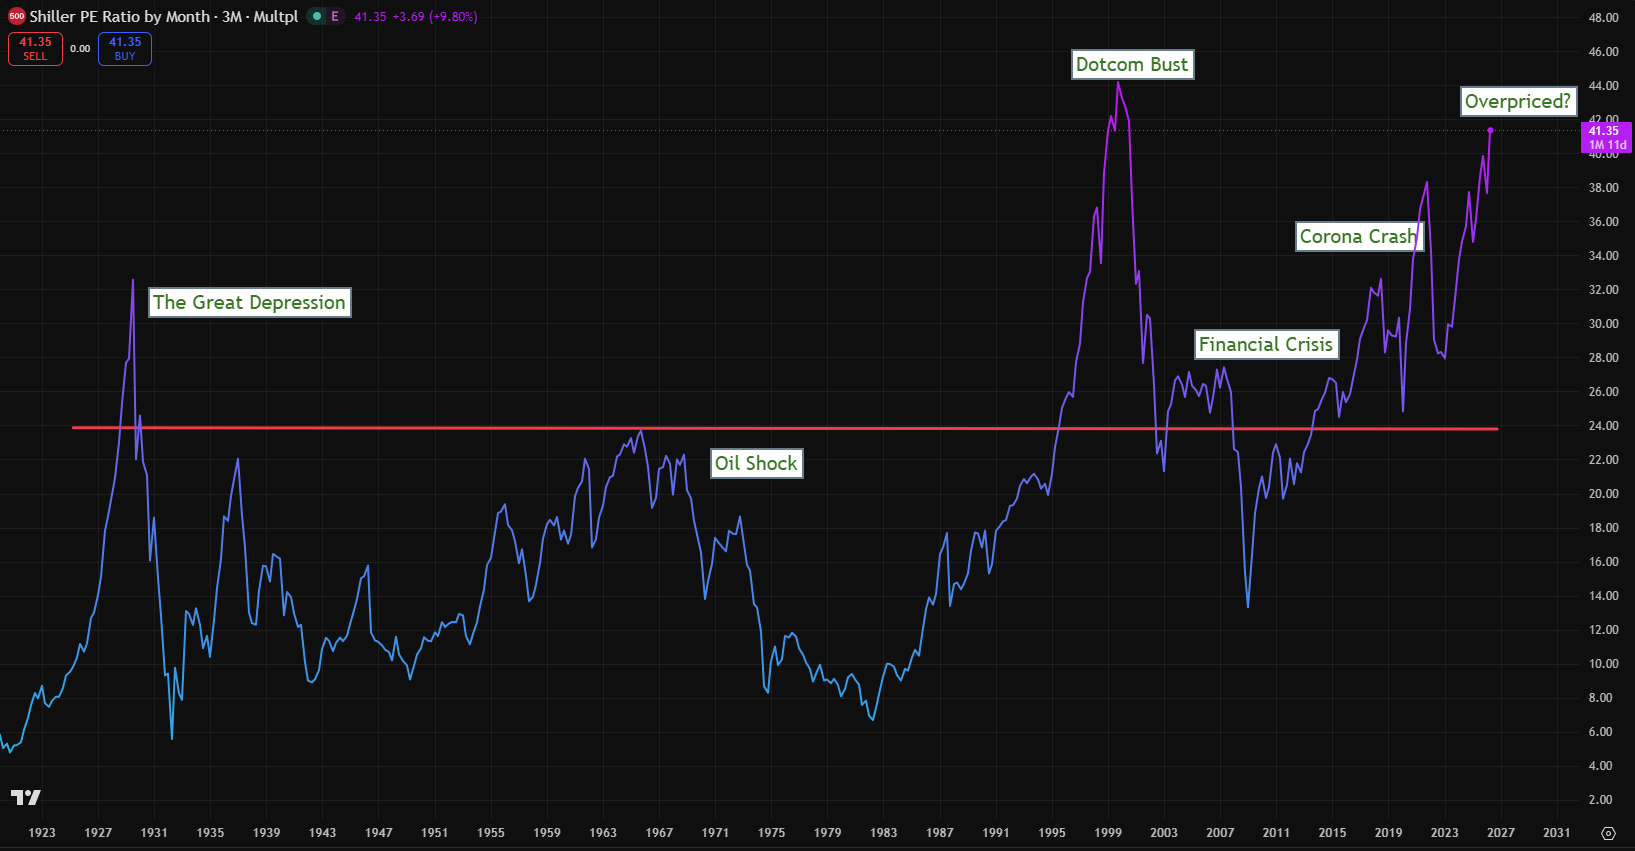
The Shiller PE ratio, also called the CAPE ratio, compares the current market price with the average of the past 10 years of inflation-adjusted earnings. The purpose is to smooth out recessions, profit booms, and temporary earnings distortions. A normal PE ratio can look reasonable at the top of an earnings cycle. CAPE asks a tougher question: how expensive is the market relative to long-term earnings power? Current CAPE estimates around 41 place the S&P 500 near historically extreme valuation territory.
According to the Shiller PE Ratio, the US stock market is currently overvalued compared to its 200-month moving average. The S&P 500’s PE ratio is close to an all-time high.
That matters because valuation is not a precise timing tool but a powerful risk indicator. The market can stay overvalued for years, especially when liquidity, earnings momentum, and investor optimism are all aligned. But when valuation is stretched, the margin for error becomes thin. A small disappointment can become a large selloff because the price already assumes a very optimistic future.
I Sold Everything in March!
My own position has been painful. In mid-March 2026, I sold all my stock investments. I believed the risk-reward setup had become unattractive. Since then, the market has continued higher, and I still cannot quite believe it. I have paid the price for my conviction. That is important to admit because being early is functionally the same as being wrong for a while. But being early does not automatically mean the thesis is dead.
Bear Arguements
The first major bear-market argument is energy. The US/Israel war with Iran has created a serious oil-supply risk through the Strait of Hormuz, one of the world’s most important energy chokepoints. Reuters reported that normal vessel traffic through the strait had fallen dramatically during the conflict, with some crude shipments only recently resuming after long delays.
This is not a minor geopolitical headline. It is a direct macroeconomic threat. The IMF described the disruption around the Strait of Hormuz and the damage to regional infrastructure as a major shock to global oil markets, with energy serving as the primary transmission channel into the wider economy.
So far, the stock market has largely looked through this risk. That may be rational if investors believe the conflict will be contained, oil flows will normalize, and central banks will tolerate temporary inflation. But I am not convinced the market has fully priced in the second-round effects: higher transport costs, lower consumer spending power, pressure on corporate margins, and renewed inflation expectations.
The second bear-market argument is the AI investment boom. I do believe artificial intelligence is real. This is not like every worthless dot-com company from 1999. Many of today’s AI leaders have enormous revenues, real customers, and world-class balance sheets. That is the balanced side of the argument.
But real technology can still create a financial bubble. Railroads, automobiles, the internet, and telecom infrastructure were all real. Investors still overpaid. The danger is not that AI is fake. The danger is that the market may be pulling forward too much future profit too quickly.
Goldman Sachs recently estimated that AI-related capital expenditure across compute, data centers, and power could reach roughly $7.6 trillion between 2026 and 2031. That is an extraordinary number. Reuters also reported that AI-related financing is helping drive a surge in US convertible bond issuance, with AI companies accounting for nearly half of early-2026 issuance.
That tells me the AI boom is moving beyond software optimism and into heavy capital formation. Data centers, chips, power infrastructure, cooling, land, debt, and energy contracts are now part of the story. This can support growth, but it also increases operating leverage. If expected AI returns disappoint, the unwind could be brutal.
The third concern is market concentration. The S&P 500 looks strong on the surface, but the strength is not evenly distributed. Recent reporting showed that a small group of large companies has driven most of the 2026 gains, while much of the rest of the index has lagged or declined.
This matters because a concentrated market is fragile. When leadership narrows, the index becomes dependent on a handful of stocks continuing to beat expectations. If Nvidia, Alphabet, Microsoft, Apple, Amazon, Meta, or Tesla stumble, the “market” can suddenly look much weaker than the index previously suggested.
The Bullish Argument
The bullish counterargument is that earnings may continue to grow. AI may generate enough productivity gains to justify higher valuations. Inflation may cool despite oil volatility. The Federal Reserve may eventually cut rates. Investors may keep rewarding the companies with the strongest balance sheets, and the market may climb the wall of worry again.
But my concern is that too many risks are now stacked on top of each other: extreme CAPE valuation, geopolitical oil risk, narrow market breadth, AI capex exuberance, and investor confidence that bad news will not matter. That combination does not guarantee a crash. It creates conditions where a correction can become severe if confidence breaks.
The hardest part about bear-market thinking is psychological. You can be fundamentally right and financially wrong for months. That is where I am. I sold too early, and the market has punished me. But when I look at this Shiller PE chart, the oil shock risk, and the AI investment cycle, I still struggle to call this a healthy long-term entry point.
My conclusion is not that investors should panic. Panic is not a strategy. My conclusion is that the S&P 500 is priced for near perfection at a time when the world is far from perfect. When valuations are this high, the question is not whether good things can still happen. They can. The question is whether enough good things can happen to justify the price already paid.
Right now, I think the market is walking a narrow ridge. It may keep climbing. But if oil, inflation, AI expectations, or mega-cap earnings turn against it, the downside could be much steeper than investors currently believe.
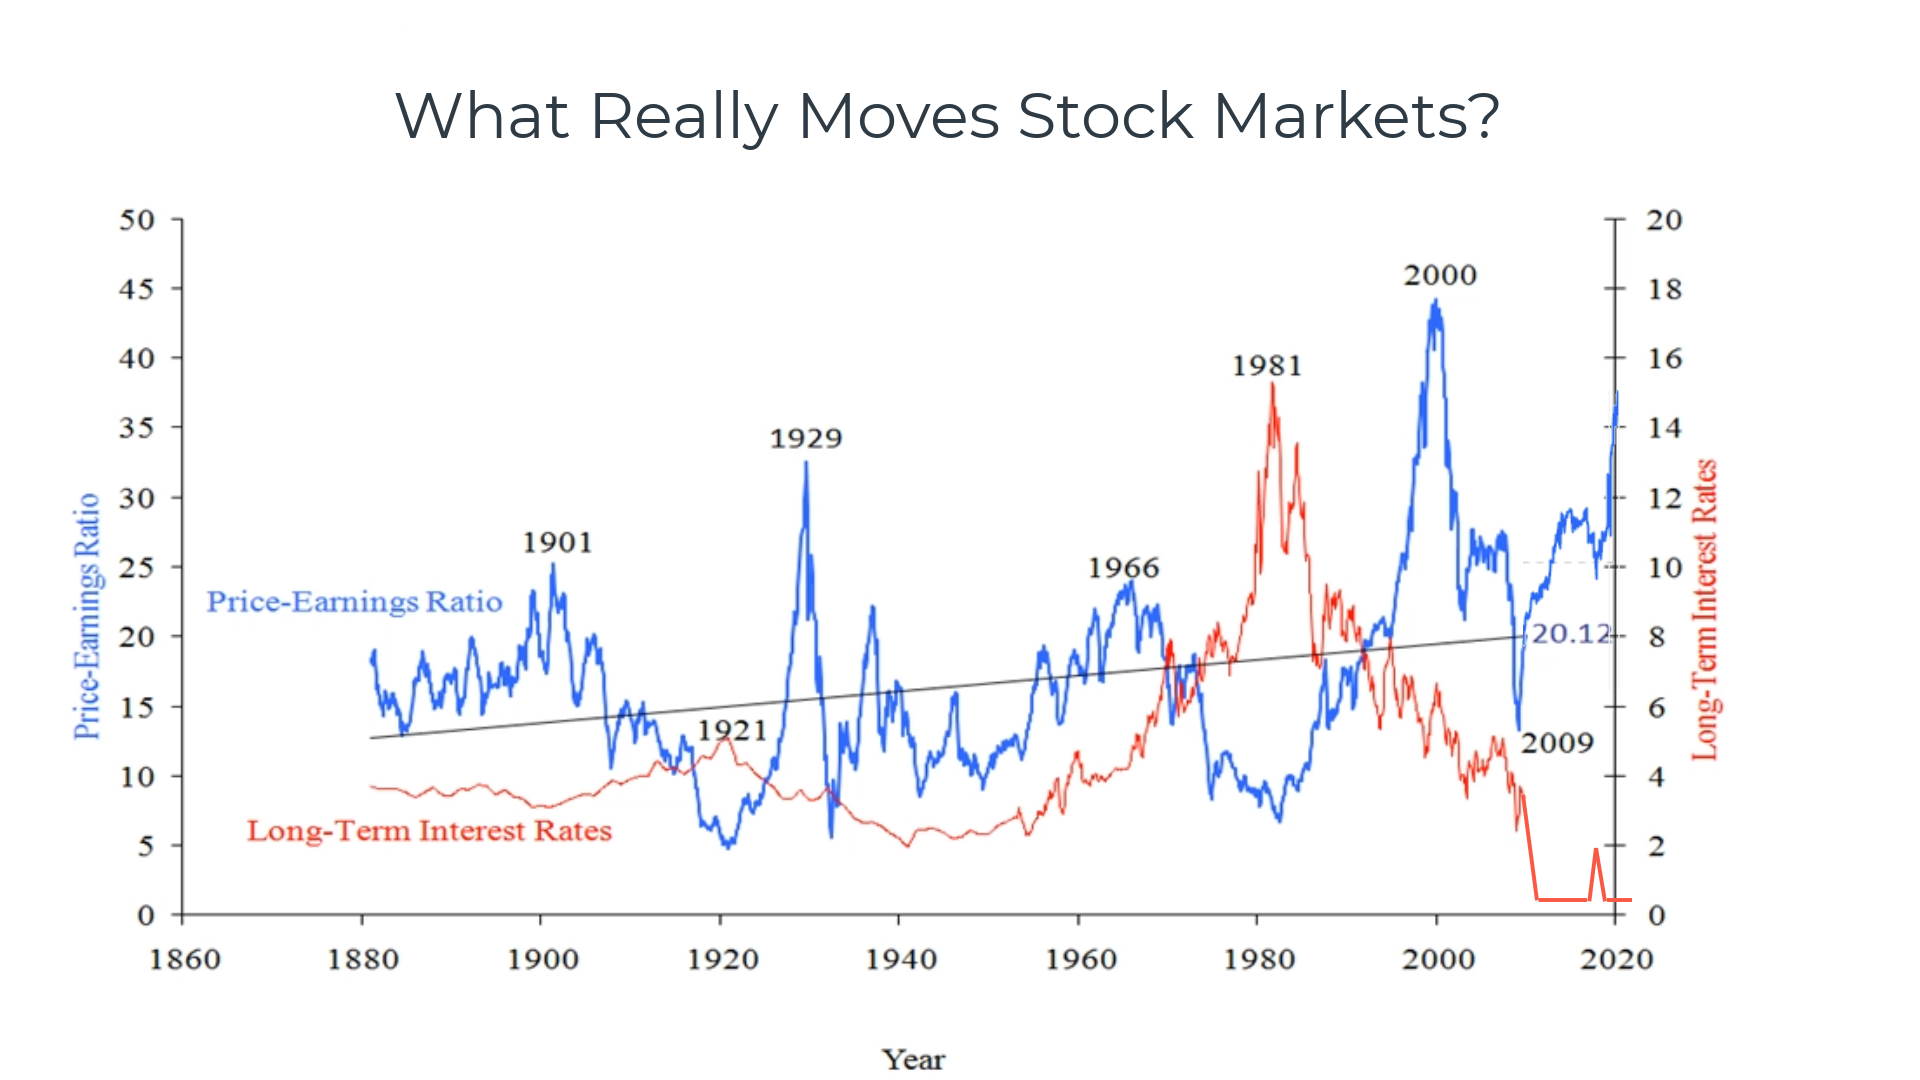
The historical context of stock market valuation.
Here is a chart from 1860 to 2024 comparing the US long-term interest rate to the Shiller Price-Earnings Ratio of the S&P Composite Index. Interestingly, there is a correlation between long-term interest rates being at extreme lows and stocks being extremely overpriced.
Shiller PE Ratio Chart Live on TradingView
The Price Earnings Ratio line shows that, relative to earnings, stock prices were too high in 1901, 1929, 1966, and 2000. We know the stock market was overvalued at this point because it then went through a correction/crash after reaching these highs.
Research shows that the 1929 stock market crash and the 2000 DotCom bubble were caused by poor institutional risk management, leading to equity bubbles and an overvalued stock market.
If we see the Shiller CAPE PE Ratio of the S&P 500 rise above 35, then stocks may be overpriced. Be very wary of an overpriced market. The Shiller PE Ratio shows us how stocks are priced relative to earnings. So, a market PE of 20 would mean that, based on the capital invested, those companies would take 20 years to pay back the investor. Or viewed another way, an investor is willing to pay 20 times the company’s earnings for a stake in the business.
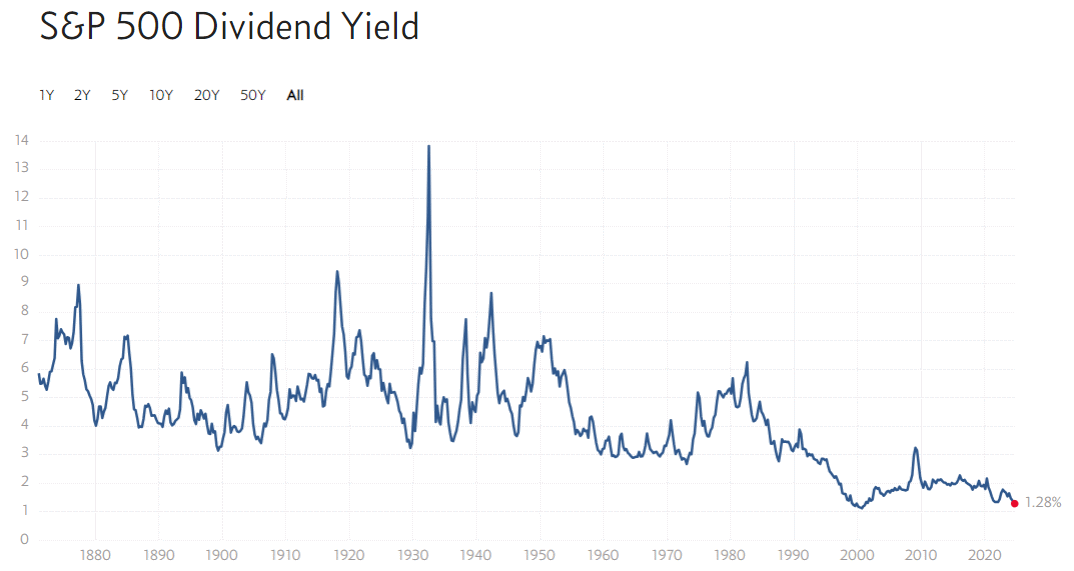
Are stocks overvalued? S&P 500 Dividend Yield.
The S&P 500 dividend yield is 1.28, near an all-time low, suggesting that stocks are historically overvalued.
However, the nature of companies’ dividend payments has changed over the last 100 years. Today, only 25% of companies pay dividends, and dividend yields are lower than they were 50 years ago, largely due to historically high stock prices relative to earnings.
Example: S&P 500 Dividend Yield 100-Year Chart
What happens when the stock market is overvalued?
If a stock market is overvalued, there are two possible outcomes. Initially, governments will try to manage the situation to ensure an orderly return to balance using conservative fiscal and monetary policy. However, a surge in inflation, a financial shock, or government attacks on the corporate sector could shift the balance and trigger a crash in equities.
Try TradingView, Our Recommended Tool for International Traders
Global Community, Charts, Screening, Analysis, Broker Integration, Financial Metrics, Ratios & Analysis with TradingView

Global Financial Analysis for Free on TradingView
Video: Is the Stock Market Overvalued?
Video From The Liberated Stock Trader Pro Masterclass Course