The Price-to-Earnings ratio (PE ratio) is a commonly misunderstood calculation for determining a company’s relative value. It is only useful for comparing companies in the same industry with similar business models. It should not be used to compare radically different businesses.
Understanding the P/E Ratio
The Price-Earnings Ratio (PE Ratio or PER) is a company valuation formula. It is calculated by dividing the current stock price by the previous 12 months’ earnings per share (EPS). A P/E ratio of 12 means you would pay $12 for every $1 of earnings if you invested. It’s only meaningfully used to compare companies in the same industry.
How to Calculate The P/E Ratio
The PE Ratio has two parts:
- Calculate the Earnings per Share. EPS = (Earnings or Net Income for the previous 12 months) divided by (Number of Shares Outstanding)
- We can now calculate the P/E ratio. PE Ratio = (Current Share Price) divided by (Earnings per Share, EPS)
The P/E Ratio Formula
The PE Ratio Formula is:
PE Ratio = (Current Share Price) / (Earnings per Share EPS)
Where:
EPS = (Earnings or Net Income for the previous 12 months) / (Number of Shares Outstanding)
What Does the P/E Ratio Mean?
The PE ratio enables you to understand how much it will cost to buy a portion of a company’s profit. A company with a P/E ratio of 25 will cost you $25 for each $1 of company profit.
Example: Understanding the P/E Ratio
Imagine you want to buy an ice cream stand. The Owner wants to sell that stand to you for $10,000. The ice cream stand makes a yearly profit of $2,000 after tax. This means if I want to buy this profit of $2,000, it will cost me $10,000. So the PE Ratio is $10,000 / $2,000 = 5. In other words, it would take me five years to make my money back on this investment.
This is what the PE Ratio or the “Multiple” tells us. In the example above, I used the case of buying a whole business, and we are considering all of the profits. The PE Ratio achieves this goal by using the Individual Share Price / Earnings per Share, as we are not buying the whole company, just a portion.
The PE ratio tells you what kind of premium investors will pay to own a piece of this company. PE ratios should always be considered in the context of the industry group.
Stock Rover 4.7/5⭐ : My Top Pick for Smart Investors
Investing In Stocks Can Be Complicated. Stock Rover Makes It Easy.
★
Growth Investing - with industry-leading
Research Reports ★
★ Value Investing - using Warren Buffett's Fair Value and Margin-of-Safety ★
★ Income Investing - rank by yield, growth, quality, and safety using 650 metrics ★

"I have been researching and investing in stocks for 20 years! I now manage all my long-term investments using Stock Rover." — Barry D. Moore, Founder: LiberatedStockTrader.com
Industry P/E Ratio
PE Ratios are best deployed to compare companies within the same industry. Some industries may have a very high average P/E ratio and some a very low P/E ratio, depending on where the industry is in its lifecycle.
The average PE ratio may be high if an industry is new, fast-growing, and requires a lot of investment.
The average PE ratio may be lower if an industry is stable and slow-growing, like in the utilities sector.
This makes comparing companies in different industries with the PE ratio not advisable.
What is a Good P/E Ratio?
A good PE ratio is a lower PE ratio. The better PE ratio is lower when comparing companies in the same industry with the same future growth and earnings expectations. The company with the lower PE ratio represents better value as you pay less per share for the same earnings and growth potential.
There is no such thing as a good PE ratio for all companies; however, we can say that a PE ratio under 25 is okay and suggests the company is reasonably priced. A P/E ratio over 200 would indicate that the company’s share price is way more than its ability to generate matching profits.
Is a Company Cheap, Fairly Priced, or Overpriced?
The price-to-earnings ratio is a simple calculation that may take some time to understand. But once you do, it can be beneficial.
Suppose you compare the P/E ratios of companies in the same industry. This will tell you which companies are perceived to have the brightest future or the best products or services, as investors are willing to pay more for a share of one company instead of another company in the same line of business.
How to Chart the P/E Ratio
With high-quality trading software, investors can plot the PE and EPS on charts to visualize how financial ratios develop over time. Notice how the PE ratio increases as the stock price rises due to the relationship between the price and EPS.
The PE ratio can also measure a company’s performance by comparing current and historical ratios. If you observe that a company’s PE ratio is declining, this could indicate something is wrong in the company or industry that the stock belongs to. Conversely, if you notice that a company’s PE ratio is increasing, it could be a sign of good company performance or strong industry trends.

Chart Financials with TradingView
Understanding the PE ratio is essential for any investor who wants to make informed investment decisions. By plotting the P/E ratio and EPS on charts, investors can better understand how current financial ratios compare with historical ones, giving them an edge when making investing decisions.
What is a High P/E Ratio?
Most investors should consider a high P/E ratio to be over 40. A high P/E ratio is wholly dependent upon the company’s ability to maintain fast growth, increased sales, and earnings. A high P/E ratio means investors expect higher future returns and continued growth.
Currently, the PE ratio for the S&P 500 is high at 28.
Amazon’s or Netflix’s PE ratios are usually over 100. This is because investors are willing to pay higher prices for the shares because of perceived future growth. For example, Amazon has razor-thin margins and invests a lot of revenue into penetrating new markets and building technology and logistics centers so that very little profit remains. This means the High Share Price divided by the Low Earnings equals a high PE Ratio.
The PE ratio remains high because investors are still willing to pay a lot for Amazon shares. If investors lose confidence in the company’s ability to continue growing faster, they will experience fear, sell the stock, and the stock price will crash. With a lower stock price, the P/E ratio will also drop to something more reasonable.
High PE Ratios usually mean high growth potential, but if investors lose confidence the stock price can plummet.
Stock Rover 4.7/5⭐ : My Top Pick for Smart Investors
Investing In Stocks Can Be Complicated. Stock Rover Makes It Easy.
★
Growth Investing - with industry-leading
Research Reports ★
★ Value Investing - using Warren Buffett's Fair Value and Margin-of-Safety ★
★ Income Investing - rank by yield, growth, quality, and safety using 650 metrics ★
"I have been researching and investing in stocks for 20 years! I now manage all my long-term investments using Stock Rover." — Barry D. Moore, Founder: LiberatedStockTrader.com
Is a High P/E Ratio Good?
A high PE ratio can be both good and bad, indicating a company with a great future or an excessively overpriced company. It depends on your perception of the company’s future outlook.
Example: High P/E Ratio
For example, Company A has a P/E ratio of 100. If 100 is the highest PE in the industry, then investors believe this company has the best profit growth potential in the future. This means the market participants are willing to buy the stock because it has excellent growth prospects.
What is an Average P/E Ratio?
Company B has a PE of 25; if 25 were the industry average, then this company would be seen as a fair value for the industry. This means the investors think this company is neither a high-performance, high-growth stock nor an underperformer with fewer profits than the competition.
Is a Low P/E Ratio Good?
Again, a low P/E ratio can be good or bad based on the context. A low PE can be good if the company has grown profits in a growing market. It could indicate that the broader market participants have not realized that this company has a very low valuation compared to its peers.
This is what income investors or value investors like Warren Buffett look for when buying shares in a company—a company with a low PE and excellent growth and profitability. As the profits grow, other investors will see that this company is a bargain, and the stock price, due to the buyer’s demand, will start to increase.
When is a Low P/E Ratio Bad?
A low PE ratio can be bad when the company in question is in a declining market, and the prospects are bleak. As profits decrease, so does the stock price, as current investors are selling the stock, and the demand for the stock is also decreasing. This is why the earnings season is so important.
A Low P/E Ratio Example
Company C has a low PE of 5 compared to the industry average of 25. This company would be seen as an underperformer / or a stock with potential value. This could be a good bargain if the earnings suddenly jumped for this stock. However, negative earnings would adversely impact the PE Ratio, meaning if the profits were reduced, the PE ratio would increase, which means the stock price would need to fall to compensate for it.
The P/E ratio must be combined with other fundamental measures to understand the stock better.
Is there a Negative P/E Ratio?
Yes. A company can have a negative P/E ratio if it did not make a profit in the previous year. But it is impossible to put a value or number on the ratio because it consists of price divided by Earnings; if there are no earnings, the formula does not work. You will often see a negative PE ratio reported as N/A or Blank.
What is the P/E Ratio TTM?
The PE Ratio TTM refers to the PE ratio for the “Trailing Twelve Months”; this means the price divided by earnings is calculated based on the previous 12 months. The TTM differs from the calendar year from January 1st to December 31st.
What is the Forward P/E Ratio?
The forward P/E ratio is calculated based on the current stock price divided by the company’s estimated earnings for the next full financial year. This is only an estimate based on the average earnings expectations of analysts or the company’s earnings forecast for the next fiscal year.
Example: Using a P/E Ratio to Compare Facebook, Apple, Amazon, Netflix & Google
Are FAANG Stocks Overpriced or Fair Value
- Facebook PE Ratio 28
- Amazon PE Ratio 143
- Apple PE Ratio 14.8
- Netflix PE Ratio 135
- Google (Alphabet) PE Ratio 26.5
The P/E ratio measures how many years the company would take to buy all its stock back with its earnings—the value of all the shares divided by the company’s profits. A PE ratio may vary depending on the industry, but a typical valuation sought by a value investor would be below 20. So compared to that, the FANG’s could be considered overpriced.
However, we must be clear that these are not normal companies; they are still considered fast-growing technology stocks with relatively low costs and high earnings.
While Facebook and Google have reasonable P/E ratios, and Apple could almost be considered a bargain, Amazon and Netflix seem extremely overpriced. One reason for this is that they are plowing all revenue back into the business to fuel fast growth. This reduces the earnings (after expenses) and makes them look overpriced on the surface.
Try TradingView, Our Recommended Tool for International Traders
Global Community, Charts, Screening, Analysis, Broker Integration, Financial Metrics, Ratios & Analysis with TradingView

Global Financial Analysis for Free on TradingView
How to use the S&P500 P/E Ratio (Shiller Formula)
You can also use the PE ratio to assess if the market is good value, fairly priced, or overpriced. The chart below shows the Robert Schiller calculation for the PE ratio of the S&P Composite for the last 100 years. You can see that a PE around 20 is a fair value, while crashes or readjustments typically follow excessive PE valuations.
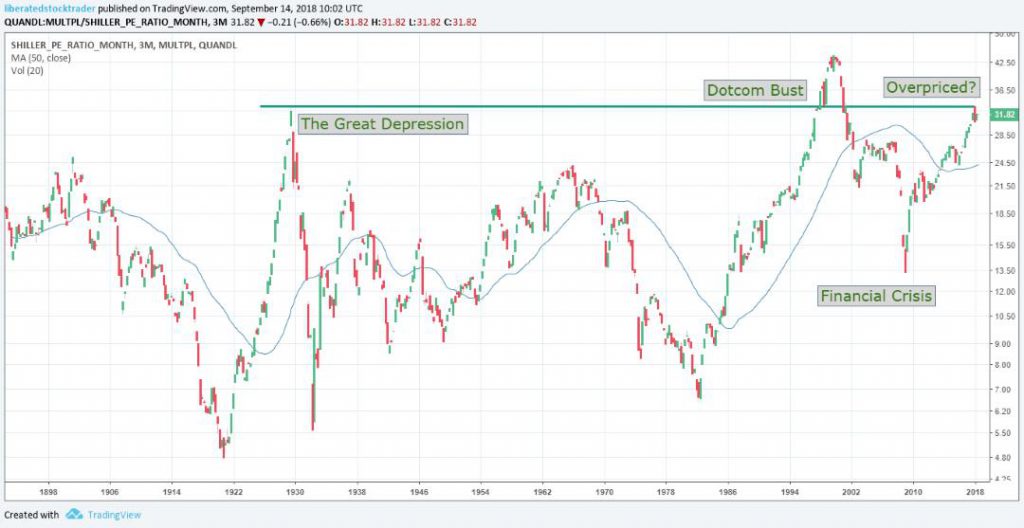
Shiller PE ratio for the S&P 500. The Price-earnings ratio is based on average inflation-adjusted earnings from the previous ten years, known as the Cyclically Adjusted PE Ratio (CAPE Ratio), Shiller PE Ratio, or PE 10 FAQ. Data courtesy of Robert Shiller from his book Irrational Exuberance.
The market is approaching a high valuation historically, up there with the 1929 great depression and the Dotcom bust. Interestingly, the Financial Crisis was not due to the stock market’s overvaluation but to the financial system’s integrity. It is a good thing this was a great earnings season, because there could be a severe pullback or readjustment if it were not.
You can have powerful charting like this by signing up with TradingView, our review-winning charting software. Read the TradingView Review or compare the best stock chart analysis packages today.
- Related Article: Learn More About Assessing if The Stock Market Is Overvalued Now.
Summary
The price-to-earnings (P/E) ratio is a commonly used metric for assessing a stock’s value. It compares the stock’s current price to its earnings per share over the past year. A higher P/E ratio can indicate that a stock is overvalued and that investors have high expectations for future performance. Conversely, a lower P/E ratio indicates an undervalued stock, as investors expect lower future performance.
It’s important to note that all stocks have different P/E ratios based on factors such as company size, industry, and the amount of time since they went public. It isn’t easy to compare two stocks with different P/E ratios and draw conclusions about their relative values. An investor should use metrics like revenue growth, debt-to-capital, and debt-to-assets ratio in addition to P/E to make an informed investing decision.
FAQ
What is the best software for charting financial ratios?
TradingView is an excellent tool for screening and charting financial metrics on all global exchanges. Stock Rover is a better choice for US investors if you seek the widest choice of fundamental ratios.
What is a P/E ratio?
A P/E ratio, or Price-to-Earnings ratio, is a financial metric used by investors to determine the market value of a stock compared to its earnings. It's calculated by dividing the current market price of a share by its earnings per share (EPS).
How is the P/E ratio calculated?
The P/E ratio is calculated by dividing the market value per share (the stock's current trading price) by the earnings per share (EPS). The EPS is the company's net income divided by the number of outstanding shares.
What does a high P/E ratio suggest?
A high P/E ratio suggests that investors are expecting high future growth from the company. It could also mean the stock is overvalued, indicating a potential risk of a price correction.
What does a low P/E ratio indicate?
A low P/E ratio may suggest the stock is undervalued, presenting a potential buying opportunity for investors. However, it could also indicate that the company is not expected to perform well in the future.
Is a lower P/E ratio always better?
Not necessarily. While a lower P/E ratio might indicate a potentially undervalued stock, it could also signify a company with poor future growth prospects. It's crucial to consider other factors like EPS growth and debt.
Can P/E ratios be negative?
Yes, a P/E ratio can be negative if a company has negative earnings (losses). However, a negative P/E ratio may not provide meaningful information about the company's valuation.
How can I use P/E ratios for investment decisions?
P/E ratios can be used to compare the relative value of different companies in the same industry. They can help identify potentially overvalued or undervalued stocks. However, they should be used in conjunction with other financial screening criteria.
What is considered a good P/E ratio?
There's no universal "good" P/E ratio as it varies by industry and market conditions. Generally, a company with a P/E ratio lower than its industry average could be considered undervalued, and vice versa.
What is the difference between trailing and forward P/E ratios?
Trailing P/E calculates the past year's earnings, while the forward P/E ratio uses projected future earnings.
Why do P/E ratios vary across different sectors?
P/E ratios can vary due to differences in business models, growth expectations, and risk profiles among various sectors. For example, tech companies often have higher P/E ratios due to expected high growth rates.
What is the PEG ratio, and how does it relate to the P/E ratio?
The PEG ratio is the Price/Earnings to Growth ratio. It adjusts the P/E ratio by the company's growth rate, providing a more nuanced view of its valuation.
Can I compare the P/E ratios of companies in different industries?
While you can technically compare any two P/E ratios, comparing companies within the same industry is generally more meaningful due to differing growth expectations and risk profiles.
Are P/E ratios useful for all types of companies?
P/E ratios are less useful for companies with negative earnings or those in highly cyclical industries. In these cases, other valuation measures might be more appropriate.
How often should I check the P/E ratio?
The frequency depends on your investment strategy. Long-term investors might check it quarterly or annually, while short-term traders might never look at it.
What is the industry average P/E ratio?
Industry average P/E ratios are calculated by averaging all the PE ratios in a particular industry or sector. This provides a useful benchmark for comparison.
What other metrics should I consider alongside the P/E ratio?
Other useful metrics include the Price-to-Sales (P/S) ratio, Price-to-Book (P/B) ratio, Dividend Yield, Return on Equity (ROE), and Debt-to-Equity (D/E) ratio.
Can P/E ratios predict market crashes?
No, while extremely high aggregate P/E ratios have been associated with market crashes in the past, they are not a reliable predictor. Many other factors can influence market downturns.
How does market volatility affect P/E ratios?
Market volatility can cause P/E ratios to fluctuate widely. It's especially important to consider a range of financial indicators during volatile periods.
What is the P/E ratio of an index like the S&P 500?
The Shiller P/E ratio (a measure of cyclically adjusted P/E) for the S&P 500 is currently around 30. This suggests that the market is overvalued, and investors should exercise caution. Check the latest Shiller PE ratio here.
Can P/E ratios help me time the market?
No, using P/E ratios to time the market is generally incredibly unreliable. The P/E ratio is not designed to be used this way and provides no value in market timing.
You want to be a successful stock investor but don't know where to start.
Learning stock market investing on your own can be overwhelming. There's so much information out there, and it's hard to know what's true and what's not.

Liberated Stock Trader Pro Investing Course
Our pro investing classes are the perfect way to learn stock investing. You will learn everything you need to know about financial analysis, charts, stock screening, and portfolio building so you can start building wealth today.
★ 16 Hours of Video Lessons + eBook ★
★ Complete Financial Analysis Lessons ★
★ 6 Proven Investing Strategies ★
★ Professional Grade Stock Chart Analysis Classes ★
Hi Punit
Higher PE does not mean a better option it just means the investors have placed a higher valuation on the company and have a higher expectation on future earning and growth.
Warren Buffets major holdings, COP, PSX, PKX, WFC etc all have a PE below 10.
hiii i actually have one doubt that why does higher pe ratio means better option becoz for higher pe ratio company u have to pay more money for earning compare to lower pe ratio.
eg. 1.i will earn 1 dollar behind every 10 dollar for company with pe 10
2.i will earn 1 dollar behind every 25 dollar for company with pe 25
whats better?
plz explain
It is truly a great and helpful piece of information. I am happy that you simply shared this helpful information with us. Please keep us up to date like this. Thank you for sharing.
you are a great help.
Cannot wait to read your book