
TradingView’s ETF Screener lets you sift through over 20,000 funds from 72 markets across 50 countries. Here are my top 10 ways to get the most from it, and what to look for in a good ETF.
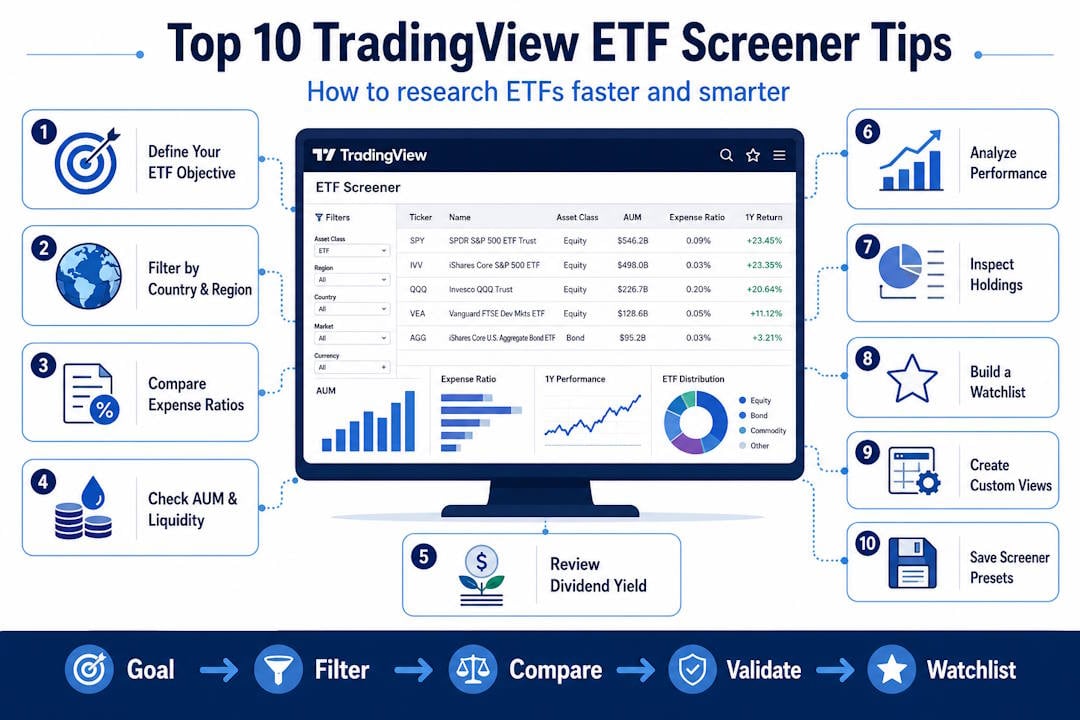
1. Start with a clearly defined ETF investment objective
Decide what you want the ETF to do in your portfolio. Maybe you’re after long-term growth, current income, lower volatility, inflation protection, or just exposure to a specific market.
My current investment goal is a 20-year time horizon with a globally diversified portfolio, but with limited exposure to Chinese stocks and US AI tech stocks, which I believe are overbought.
This choice shapes every filter you use in TradingView’s ETF Screener. A broad U.S. equity fund might fit a growth goal, while a bond or dividend ETF could be better for income.
Narrow things down by asset class, region, sector, or theme. TradingView’s ETF Screener covers stocks, bonds, commodities, crypto, and more, so a clear objective keeps your search on track.
2. Filter ETFs by country and geographic exposure
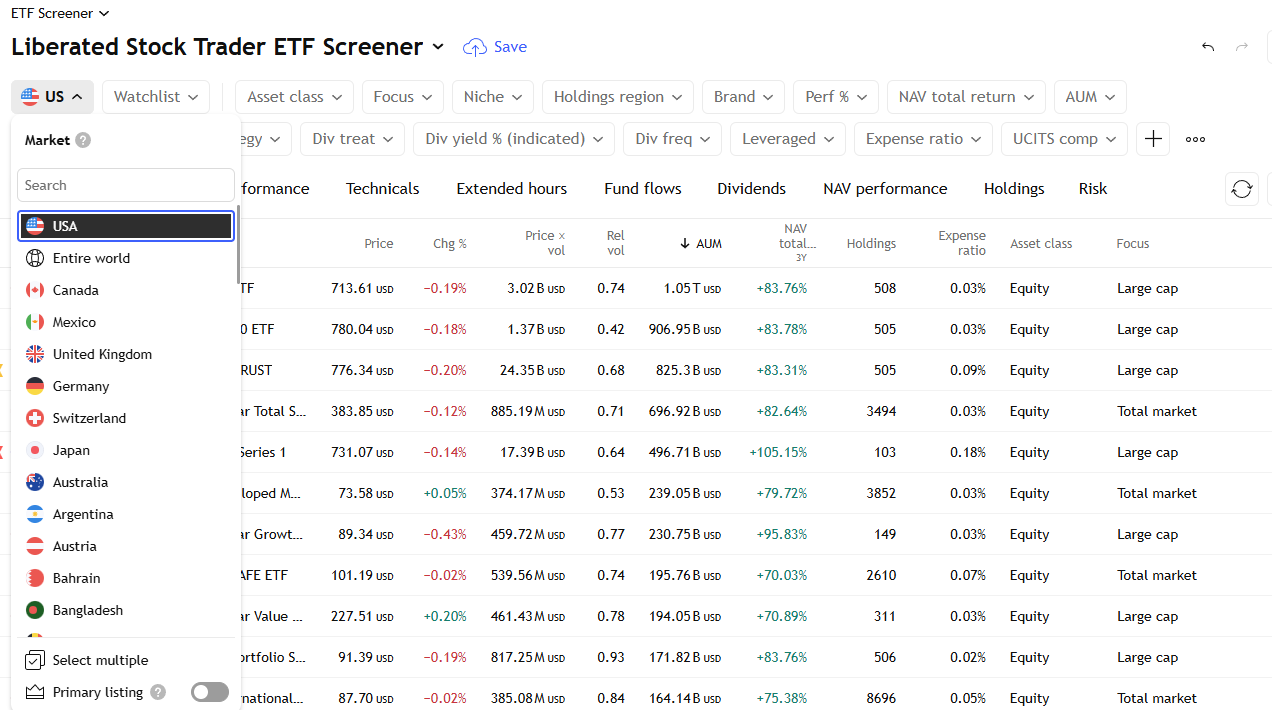
Use the country filter to target ETFs listed in a specific market or focused on a particular nation. These are separate things—a U.S.-listed ETF might still invest mostly in Japan, Brazil, or Europe.
Check geographic exposure before comparing returns. Sometimes, an ETF labeled “global” holds a lot of U.S. stocks, while a regional fund could be heavily concentrated in just a couple of countries.
TradingView’s ETF Screener lets you filter by country alongside performance, assets, volume, and more. This way, you can whittle down a long list to funds that match the market exposure you actually want.
If you want developed-market exposure outside the U.S., screen for international ETFs first. Then, review each fund’s holdings and country weights so you don’t end up with more U.S. exposure than you bargained for.
3. Compare expense ratios and total costs
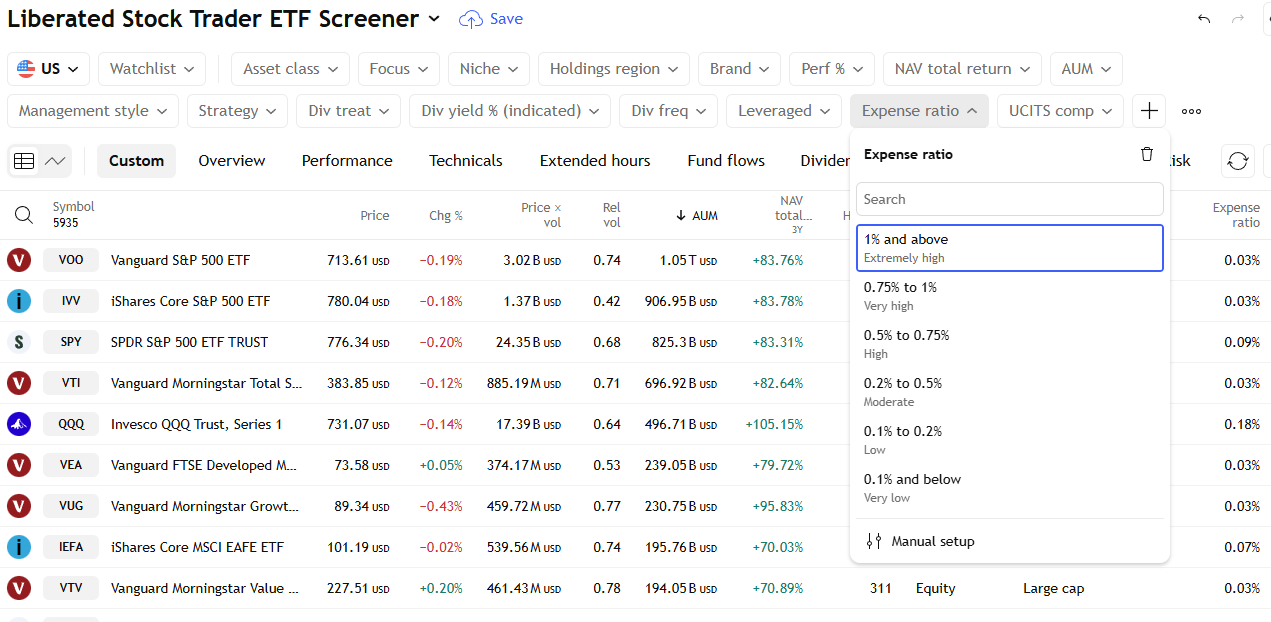
Sort funds by expense ratio in TradingView’s ETF Screener before you compare similar ETFs. The expense ratio is the annual percentage of a fund’s assets used for operating expenses. A lower figure generally leaves more return in your pocket.
Line up funds that track the same index, sector, or country. For instance, two broad U.S. stock ETFs might have nearly identical holdings but different annual fees.
Don’t let expense ratio be your only cost metric. Check bid-ask spreads, trading volume, and how closely the ETF has tracked its benchmark. Sometimes, a low-fee fund with a wide spread winds up costing more to trade than you expect.
TradingView’s charts and fund data help you review price movements, liquidity, and fees. This keeps you from choosing an ETF based on just one number.
4. Review assets under management and liquidity
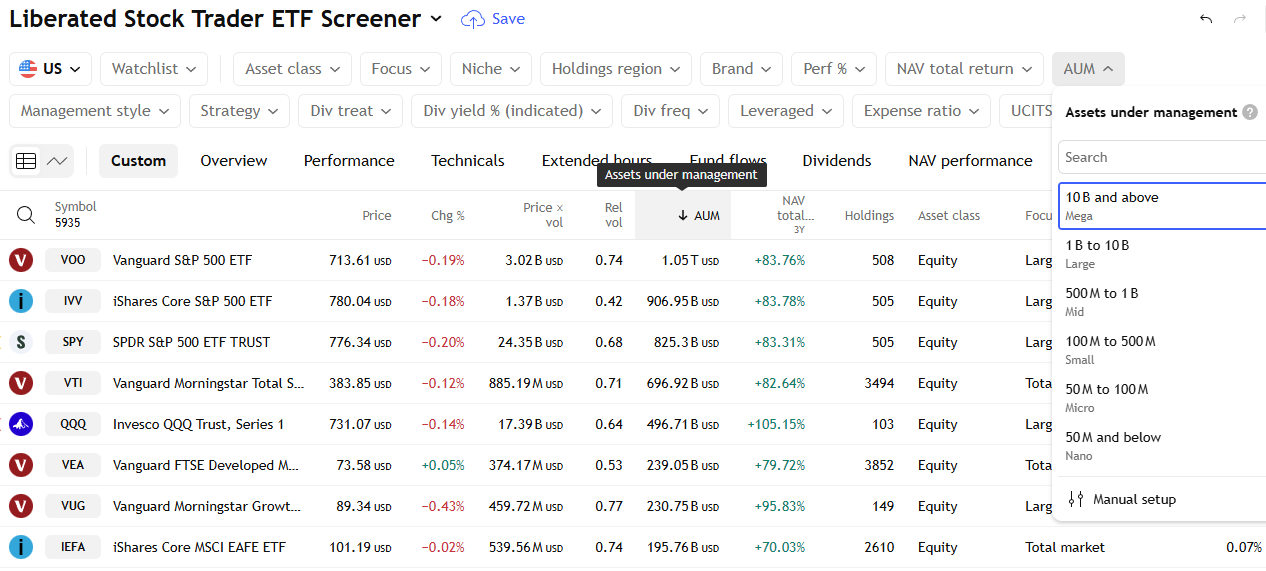
Check assets under management (AUM) before you add an ETF to your watchlist. Higher AUM usually means more investors use the fund, though it doesn’t guarantee it’s right for you.
Look at average daily trading volume and the bid-ask spread. A narrow spread and steady volume make buying and selling easier, and may cut your trading costs.
In TradingView’s ETF Screener, sort funds by AUM and compare volume data for similar ETFs. If two funds track the same market, you might prefer the one with higher trading activity and a tighter spread.
Don’t judge liquidity by volume alone. Also look at the underlying holdings—sometimes an ETF trades smoothly even if its own daily volume looks modest.
5. Check dividend yield and distribution history
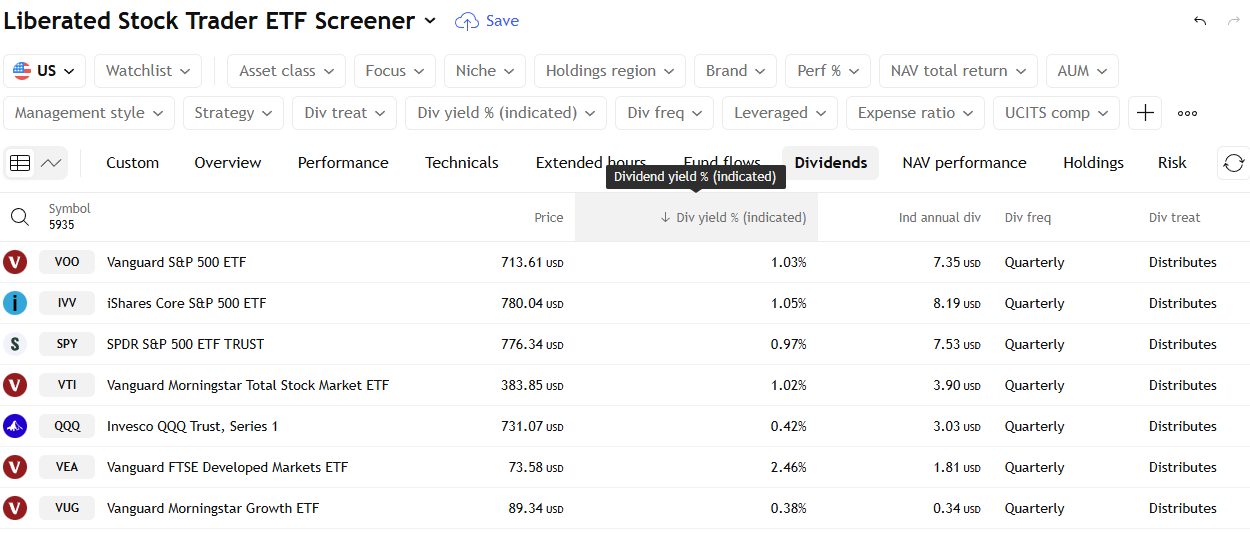
Use dividend yield as a filter, but not as your final decision maker. Yield measures annual distributions against the ETF’s current price, so a dropping price can make yield look higher than it actually is in normal times.
In TradingView’s ETF Screener, filter for dividend-paying funds and compare yield, distribution frequency, and category. Also, check whether the ETF pays monthly, quarterly, or on a different schedule that fits your income plan.
Review the distribution history. Look for payouts that have stayed steady or grown over time. Keep in mind, though, that many ETF payouts change because the fund’s holdings generate different income each period.
If you see a very high yield, dig deeper. It might come from a concentrated strategy, covered calls, real estate, debt securities, or a recent price drop. Compare the yield with the ETF’s fees, holdings, and total return before adding it to a watchlist.
6. Analyze historical performance across multiple funds
Compare an ETF’s returns over several periods. Don’t just look at the latest gain or loss. A one-week jump might just reflect short-term news, while one-, three-, and five-year results show how the fund handled different markets.
You can view multiple fund charts simultaneously by clicking the multi-chart view option highlighted in red below.
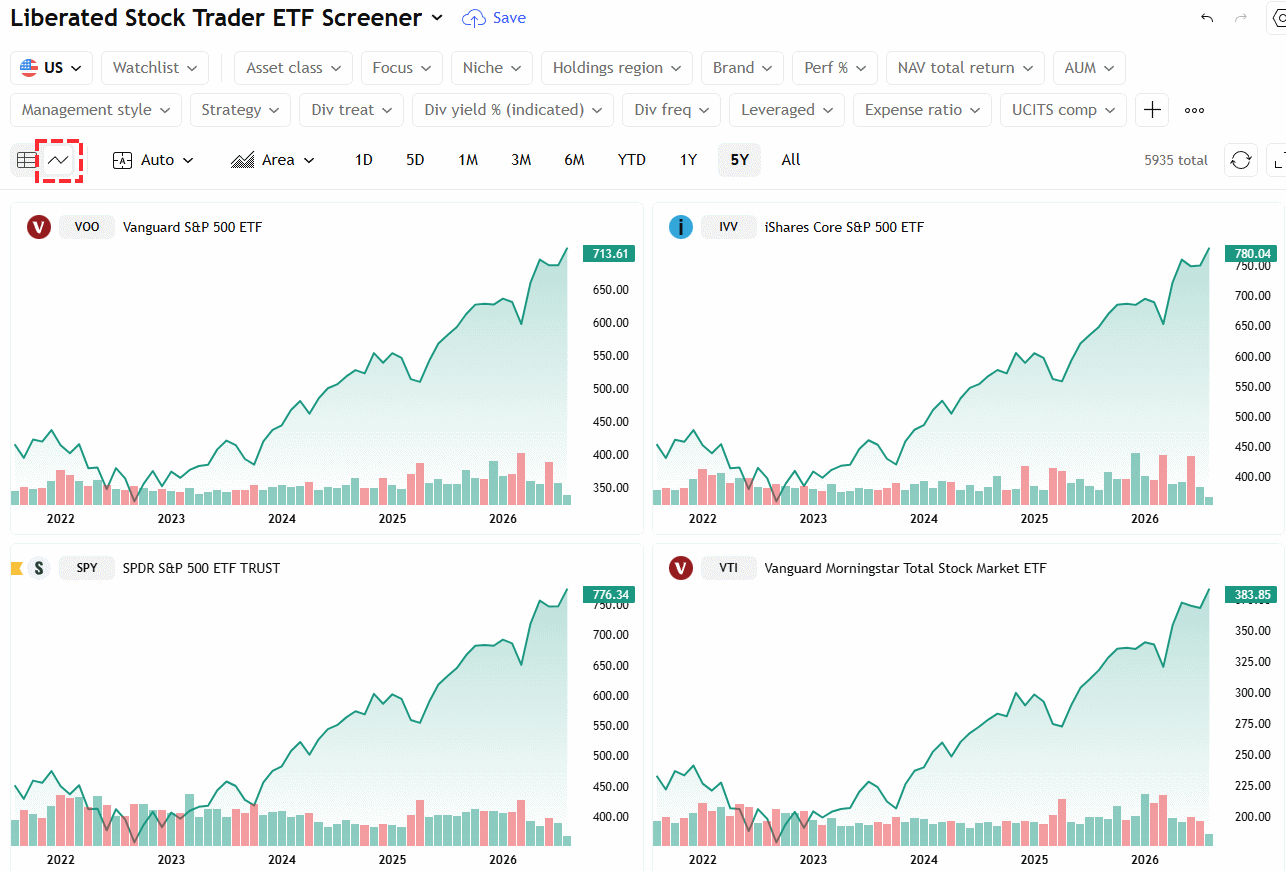
In TradingView’s ETF Screener, add performance columns for periods that fit your holding plan—one month, three months, six months, one year, and five years. Sort by one period at a time to spot funds with steady results, not just a single hot streak.
Check the chart after screening. An ETF might look great over one year but still have a sharp drop, a weak recovery, or a trend that fizzled out.
For example, screen international ETFs in TradingView by six-month and one-year performance, then compare their charts to a broad market benchmark. This helps you see if the ETF gained because of its sector, region, or the wider market.
7. Evaluate holdings and portfolio concentration
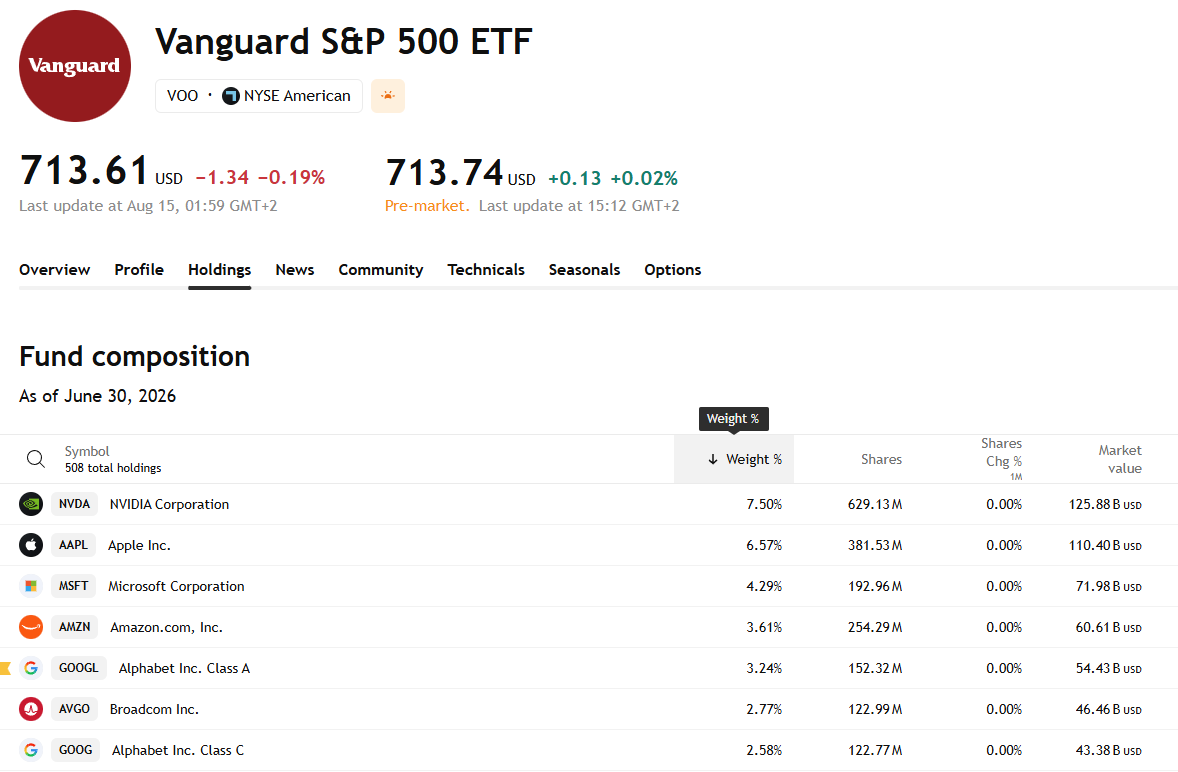
Use the ETF Screener to narrow down your list, but always check each fund’s holdings before investing. A strong recent return doesn’t reveal what the fund actually owns.
Review top holdings, sector weights, and country exposure. An ETF might own hundreds of stocks, but a few big companies can still drive most of its value.
Check for overlap between funds. Two technology ETFs may look different by name but hold many of the same major stocks, which can increase your exposure more than you realize.
For international ETFs, check the exchange, currency, and country mix on TradingView. This helps you avoid mistaking a country-specific or single-market fund for broad global diversification.
If you want deeper company-level research after screening, use Stock Rover to dig into the major holdings and their fundamentals.
8. Add ETFs to a Watchlist
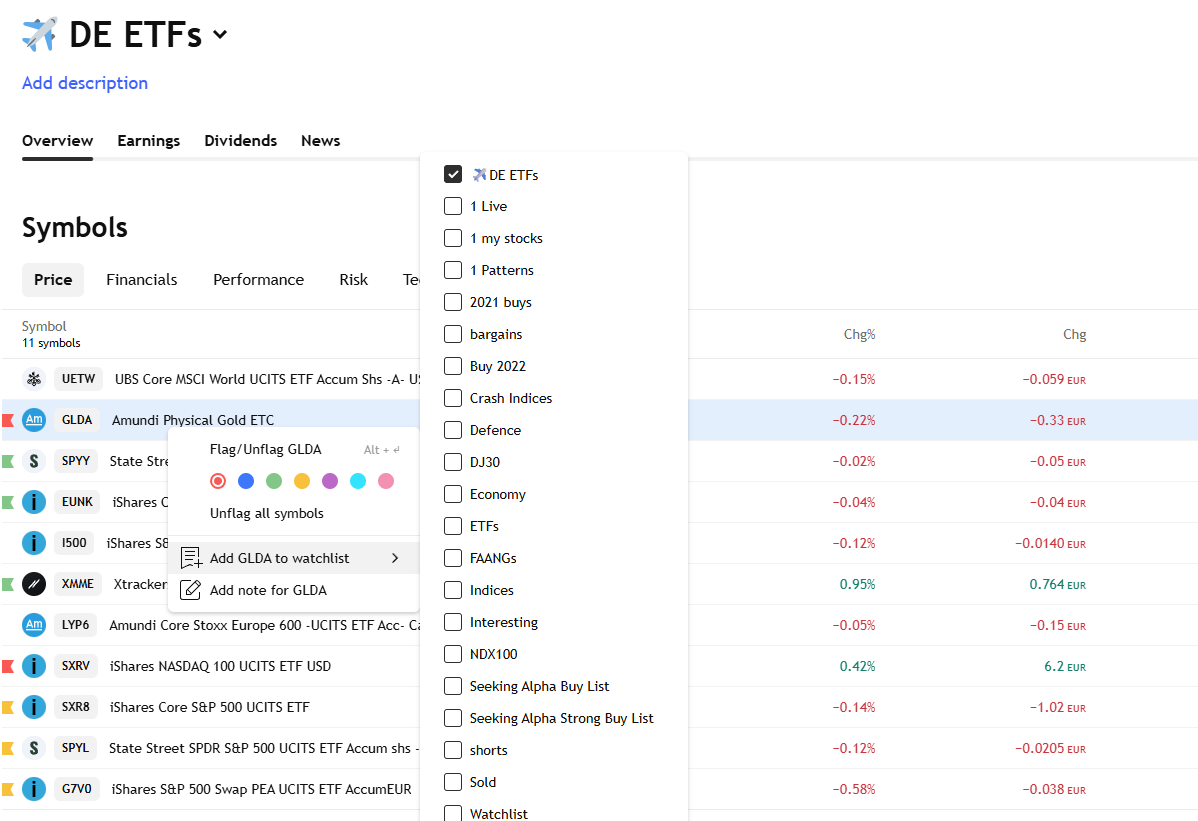
Add promising ETFs to a watchlist after you narrow the screener results. This keeps good candidates in one place, but don’t treat the screener ranking as a buy signal.
In TradingView, select one or more ETFs from the results and add them to an existing or new watchlist. Use Shift or Ctrl to select multiple funds at once before adding them.
Organize your lists by purpose—broad market ETFs, dividend funds, sector funds, or international exposure. Clear names make it easier to review later.
Open each ETF’s chart and check its price trend, volume, holdings, fees, and trading exchange. For international ETFs, TradingView helps you compare listings and track the right ticker.
Set price alerts for levels you want to revisit. An alert lets you know when the ETF hits that level, but always double-check the fund before making a move.
9. Create Custom Screener Views

Save separate ETF screener views for different goals—income, sector trends, international exposure, whatever you need. A saved view keeps your filters, columns, sorting, and table layout in one spot.
For an income view, you might show dividend yield, expense ratio, AUM, and recent performance. Sort by the factor that matters most, but still check trading volume before taking action.
Build a technical view in TradingView for ETFs trading above key moving averages or showing higher relative strength. This helps you go from a broad list to charts that deserve a closer look.
Keep each view focused. Too many filters can rule out good options, and too many columns make the table hard to scan.
10. Save customized screener presets for repeat research
After I build filters that fit a repeat research task, I save a screener preset. This way, I don’t have to rebuild the same ETF search every time I want to review funds.
In TradingView’s ETF Screener, a saved preset keeps your selected filters, visible columns, sorting, and the template name. I like to use names like “Global Dividend ETFs,” “Low-Cost Bond Funds,” or “Crypto-Linked ETFs” so I know exactly what each preset does.
I create separate presets for different goals. For example, my income screen ranks funds by dividend yield, while my cost screen sorts by expense ratio and assets under management.
I also save a broad starting preset with just a few essential filters. When market conditions or my research needs change, I duplicate or tweak it.
Every so often, I review saved presets. Fund data, listings, and my strategy can shift, so I remove filters that no longer make sense.
Understanding ETF Screener Data
I use ETF screener data to compare funds on cost, size, trading activity, and holdings. Before I rely on any field, I check when it last updated.
Key Fund Metrics and Definitions
The expense ratio shows the annual fund fee as a percentage of assets. For example, a 0.20% expense ratio means you’ll pay about $20 a year for every $10,000 invested, not counting market gains or losses.
Assets under management (AUM) measures the fund’s total assets. Bigger funds usually have more trading activity, but size alone doesn’t mean a fund fits your goals.
I also look at these:
- Net asset value (NAV): The value per share of the fund’s holdings.
- Market price: What investors pay for ETF shares on an exchange.
- Spread: The gap between the best available buy and sell prices. Tighter spreads can lower your trading costs.
- Average volume: The typical number of shares traded daily.
- Holdings and weight: The securities in the ETF and how much each makes up the portfolio.
- Yield: Income paid out relative to the current price. I check if it’s from dividends, interest, or both.
On TradingView’s ETF Screener, you can filter by expense ratio, AUM, performance, and asset class, then pull up a chart to see price action.
Building a Repeatable ETF Research Process
I stick with the same filters, checks, and comparison steps whenever I research an ETF. This way, short-term market moves don’t mess with my standards.
Matching Filters to Investment Objectives
I always start with a specific goal: broad market growth, income, sector exposure, inflation protection, or lower volatility. Each goal needs its own filters, so I don’t use a single saved screen for everything.
For a long-term U.S. equity ETF, I might filter for:
- Asset class: Equity
- Region: United States
- Fund size: At least $500 million
- Expense ratio: Below 0.25%
- Trading volume: High enough for easy entry and exit
For income funds, I add distribution yield and payment history. With sector ETFs, I compare sector weight, top holdings, and three- to five-year results to a broad index ETF.
I save these filter sets in TradingView’s ETF Screener with clear names, such as Low-Cost Global Equity or Dividend Income. Then I add interesting funds to a watchlist—I don’t just buy straight from the screener results.
Validating Results Before Investing
A screener helps you cut down the list, but it won’t expose every risk that matters. I always open each ETF’s page to check its holdings, index methodology, expense ratio, assets under management, and average daily trading volume.
It’s worth comparing similar ETFs side by side. Two funds might track the same market, but one could hold fewer stocks, use different weighting rules, or charge more each year. Even a 0.10% fee gap adds up over a decade.
I lean on TradingView charts to stack an ETF against its benchmark and top rivals across different market cycles. I look for price gaps, thin trading, or wide bid-ask spreads that might quietly eat into returns.
Before pulling the trigger, I double-check the fund’s domicile, tax treatment, currency exposure, and distribution policy. I’ll skim the issuer’s fact sheet and prospectus to make sure the ETF really fits the role I want it to play in my portfolio.
