You glance at a price on your trading platform, but that’s just the surface. Every quote hides two numbers—the bid and the ask. The gap between them, called the spread, actually shapes your trading costs and potential profits.
If you understand bid, ask, and spread, you’ll see what a trade really costs before you hit buy or sell.

When you sell, you face the bid. When you buy, you face the ask. The spread between them reflects market liquidity, volatility, and order flow.
A tight spread usually means an active market. If you see a wide spread, it could signal low liquidity or some uncertainty. Platforms like TradingView let you watch spreads change in real time for stocks, forex, and crypto.
If you track spreads, you’ll spot better entry points and keep trading costs in check. It doesn’t matter if you’re day trading or investing for years—getting this concept down gives you more confidence every time you place an order.
Key Takeaways
- Bid, ask, and spread set the true cost of entering or exiting a trade
- Market liquidity and volatility directly impact how wide or tight the spread gets
- Watching spreads across assets helps you time trades and minimize costs
Defining Bid, Ask, and Spread
Every trade in a financial market happens when a buyer and a seller agree on a price. The bid, ask, and spread shape that negotiation and reveal how liquid and competitive a market feels.
What Is the Bid Price?
The bid price is the highest price a buyer’s willing to pay for a security right now. It shows demand—how much traders value the asset at this moment.
If buyers start competing, the bid price can jump fast.
Order books display bids by size and price. If you see big bids stacked higher, that’s stronger buying interest. In liquid markets—think major currency pairs or large-cap stocks—the bid price updates constantly, sometimes many times a second.
Tools like TradingView let you watch live bid data for stocks, forex, and crypto. Keeping an eye on the bid side helps you spot if buyers are getting aggressive or if momentum might turn upward.
When you sell, your order fills at the current bid, so knowing this number helps you estimate your execution price and possible slippage.
Understanding the Ask Price
The ask price (sometimes called the offer price) is the lowest price a seller will take for an asset. It’s all about supply—how eager sellers are to move their positions.
If the gap between ask and bid shrinks, the market’s more efficient.
Ask prices climb when sellers expect buyers to pay up, especially during heavy demand or tight supply. If demand drops off, sellers may lower their ask.
If you put in a market buy order, you pay the current ask. Seeing both sides of the quote helps you decide when to jump in. For short-term traders, tools like TrendSpider automate chart updates and ping you when ask prices cross technical levels.
Watching ask depth and recent trade sizes shows you whether sellers are in control or if buying pressure’s building.
Calculating the Spread
The spread is just the difference between the ask and bid.
[
\text{Spread} = \text{Ask Price} – \text{Bid Price}
]
It’s a direct measure of transaction cost and market liquidity. Small spreads mean active trading and lower cost; wide spreads mean less liquidity or more volatility.
| Market Type | Typical Spread | Liquidity Level |
|---|---|---|
| Major Forex Pair | 0.1–1 pip | High |
| Large-Cap Stock | $0.01–$0.05 | High |
| Small-Cap Stock | $0.10+ | Low |
You always pay the spread, just not directly—buyers pay a bit more, sellers get a bit less.
If you watch spreads over time, you’ll spot when it’s cheaper to trade. For instance, spreads usually widen at the open or during news. Using Benzinga Pro for real-time updates lets you catch when spreads tighten, so you can time trades and avoid extra costs.
How Bid, Ask, and Spread Work in Financial Markets

Bid and ask prices set the range where buyers and sellers actually meet. The spread between them tells you about market liquidity, trading costs, and how quickly prices adapt to new info.
Order Book and Price Discovery
An order book lists all the current buy and sell orders for a stock or asset. The bid shows what buyers want to pay; the ask shows what sellers want. The spread is the difference.
A tight spread almost always means high liquidity and frequent trades. A wide spread pops up in thinly traded or volatile markets, where fewer people are quoting prices. You can pull up real-time order books and spreads on TradingView to see how orders stack at each price.
Price discovery happens as new orders push the best bid or ask. If buyers bump up their bids, the stock price can rise. Sellers who lower their asks may drive prices down until a trade hits at the new midpoint. This dance between quotes reflects supply, demand, and market sentiment.
Role of Market Makers
Market makers post both bid and ask prices to keep trading moving. They earn the spread for providing liquidity and shouldering short-term inventory risk. On the NYSE or NASDAQ, you’ll find several market makers competing for the best prices.
You rely on their quotes to get trades done fast. Without them, spreads would get wider and trades would take longer. These days, automated systems handle most quoting, tweaking prices in milliseconds as order flow and volatility shift.
If market makers pull back during stress, liquidity can vanish. Prices might gap between trades. Watching spreads helps you spot when things get shaky. Tools like Benzinga Pro alert you to unusual spread changes or fast-moving quotes in real time.
Impact on Stock Prices
The bid-ask spread hits your transaction cost directly. If you buy at the ask and sell at the bid, the spread is your instant loss before the price even moves. For active traders, even tiny differences in spread can add up fast.
Liquid stocks sometimes have spreads of just a penny or two. Small-cap or low-volume shares can have spreads over 1% of the price. Wider spreads make trading less efficient and can throw off short-term price signals.
Spreads react to market events, too. Earnings, economic data, or surprise news can quickly widen spreads. If you watch spreads around these events, you’ll plan entries and exits better. Try TrendSpider to visualize spread changes alongside price and volume for sharper timing.
Factors That Influence the Spread
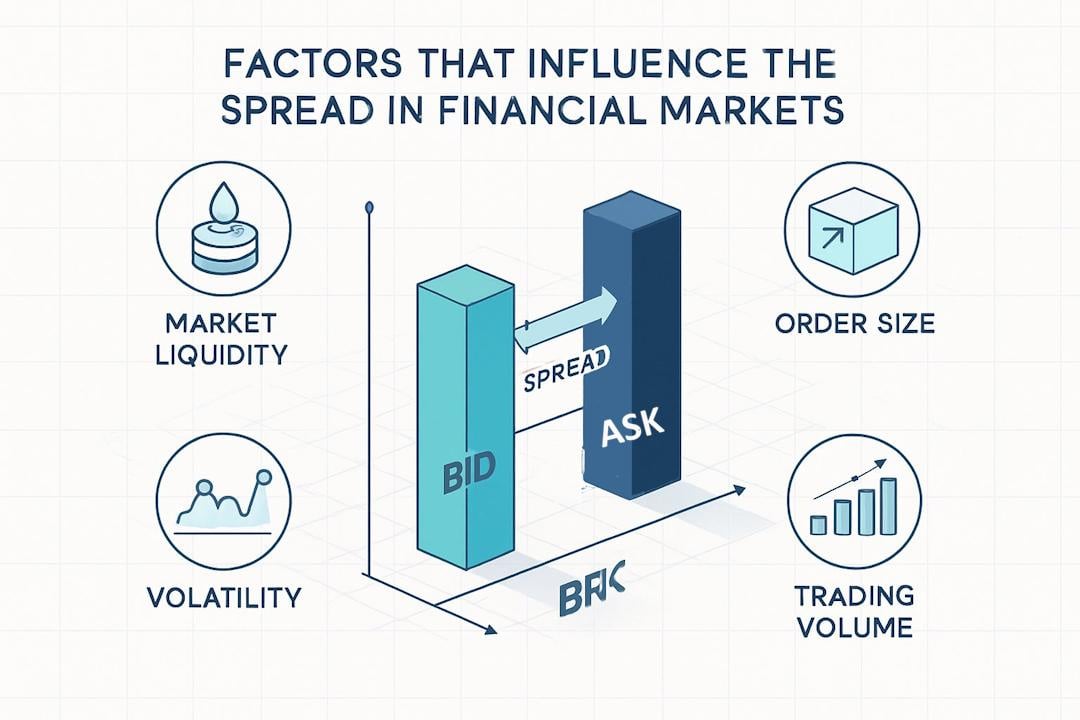
Spread size shifts with how easily assets trade, how wild the market feels, and how buyers and sellers compete. Each factor changes your trading costs and execution quality in ways you can actually track.
Liquidity and Trading Volume
High liquidity and solid trading volume usually squeeze the spread tighter. When you see lots of buyers and sellers, prices get closer together, leaving less room between bid and ask. Large-cap stocks and major forex pairs show this all the time—they trade nonstop across the globe.
Low liquidity opens the spread up. Thinly traded assets, small-caps, or niche bonds draw fewer players, so market makers want more compensation for holding inventory. You end up paying more to get in or out quickly.
You can check average daily volume and old spread data with Stock Rover or TradingView. These tools let you compare liquidity across sectors or timeframes. Watching these stats before you trade helps you dodge unnecessary slippage.
Market Volatility
When market volatility jumps, spreads get wider because uncertainty ramps up. Market makers widen quotes to protect against wild swings and possible losses. You’ll spot this during earnings, big macro news, or geopolitical surprises.
Stable markets do the opposite. Tight spreads mean confidence and predictable prices. For example, blue-chip stocks in calm times might have spreads of just a couple cents, but the same stocks can double or triple that during chaos.
You can use real-time volatility indicators or implied volatility to time your orders. MetaStock can ping you when volatility spikes, so you can decide whether to trade now or wait for things to settle.
Supply and Demand Dynamics
Supply and demand drive how hard buyers bid and how stubborn sellers get. If demand beats supply, buyers push bids up and the spread tightens. If sellers have the upper hand, spreads widen as buyers hesitate.
Activity patterns matter, too. A sudden surge in demand—maybe after a hot earnings report—can tighten spreads briefly. If nobody cares about an asset, competition drops and spreads widen.
You can track these shifts with TrendSpider by visualizing order flow and price clusters. Seeing where orders pile up helps you predict spread changes and tweak your order type or timing to cut costs.
Order Types and Trading Costs
You decide how your trades fill and what they cost by picking the right order type and managing execution risk. Each choice affects how much you pay in spreads, fees, and possible slippage if prices move before your order fills.
Market Orders vs. Limit Orders
A market order buys or sells right away at the best available price. You get execution, but not price certainty. Usually, you pay the ask when buying or get the bid when selling, so you eat the spread as a cost.
A limit order lets you set your price. It only fills if the market hits your number. You control price, but the trade might never go through. In fast markets, your limit could just sit there.
| Order Type | Execution Speed | Price Control | Execution Guarantee | Cost Impact |
|---|---|---|---|---|
| Market Order | Immediate | Low | High | Higher (spread + slippage) |
| Limit Order | Conditional | High | Low | Lower (if filled) |
TradingView lets you test how different order types play out in live markets. You can see bid-ask spreads and how speed affects your fills.
Transaction Costs and Slippage
Transaction costs include commissions, exchange fees, and the spread. Even tiny spreads can snowball into big expenses if you trade a lot.
Slippage hits when your trade fills at a worse price than you expected. Say you try to buy at $50 but fill at $50.10—that’s $0.10 of slippage per share. High volatility and low liquidity make this more likely.
Here’s a quick cost checklist:
- Commissions: Broker or platform fees
- Spread: Difference between bid and ask
- Slippage: Price move during execution
With Stock Rover, you can analyze how often you trade and how spread size eats into your total costs.
Spread and Price Movements
The bid-ask spread reveals market liquidity and risk. Tight spreads mean active trading and lower costs. Wide spreads hint at thin liquidity or uncertainty.
When market orders hit the book, they can move prices. A big buy order might lift the ask and push prices up. Heavy selling can widen the spread and drag prices down.
You can track these moves live with TrendSpider, which automates chart analysis and shows how spreads change before key price moves. If you get how this works, you’ll time your entries and exits a whole lot better.
Bid-Ask Spread Across Asset Classes
Bid-ask spreads really aren’t one-size-fits-all—they shift a lot depending on how much an asset trades, how many people are in the market, and even the rules of the exchange. You’ll notice spreads get much tighter when trading’s heavy and automated, but they widen out fast when there’s less action or more risk. It pays to know these differences if you want to keep transaction costs down and pick the best market for your approach.
Stocks: Large-Cap vs. Small-Cap
Large-cap stocks like Apple or Microsoft? You’ll usually see spreads as low as $0.01–$0.03 per share. High liquidity and non-stop market-making keep those costs minimal. You can get in or out quickly, and your trade probably won’t move the price much.
Small-cap stocks are a different story. They trade less, often have fewer analysts watching them, and spreads can jump to 1% or more of the price. Market makers will demand more for the risk since there aren’t always buyers or sellers lined up.
If you want to compare liquidity metrics, daily volume, or average spreads before you trade, Stock Rover makes that pretty easy. That way, you can steer clear of illiquid stocks that quietly eat into returns. Always check both the quoted spread and the effective spread after your order fills.
Forex and Currency Pairs
In forex, spreads mostly depend on how popular and volatile the currency pair is. The big names—EUR/USD, USD/JPY—often trade with spreads below 1 pip. That’s deep liquidity and round-the-clock trading in action. Exotic pairs like USD/TRY? Spreads there might be 10–20 times higher.
Since forex trades over-the-counter, brokers and time of day can shift spreads a lot. Liquidity dries up outside peak hours, so costs jump. Algorithmic traders track these moves to time their trades for the best spreads.
TradingView lets you see real-time spreads and compare broker quotes side-by-side. You can also watch how central bank news or economic data shake up short-term spreads. Always factor in both spread and slippage when you’re figuring out your total cost.
Futures, Options, and Cryptocurrencies
Futures on major indexes like the S&P 500 E-mini usually stick to tight spreads—often just a single tick—because big institutions are always in the mix. If you look at commodity futures or contracts that don’t trade much, you’ll see spreads widen as volume drops.
Options? Those spreads are typically wider, especially if you’re trading contracts far from expiration or deep out-of-the-money. Market makers want more for the risk and hedging. Retail traders often end up paying a higher premium compared to the underlying stock.
Cryptocurrencies are all over the map. Bitcoin and Ethereum trade with tight spreads on big exchanges, but smaller tokens can have spreads above 2–3%. Liquidity really depends on the exchange and even the time of day. If you use TrendSpider, you can dig into intraday spread swings and spot the best trading windows.
Practical Strategies for Traders and Investors
Trading well isn’t just about picking the right direction—it’s about timing, keeping costs down, and making sure your orders actually fill where you expect. If you pay attention to liquidity, manage your spreads, and get precise with your orders, you’ll avoid a lot of unnecessary losses.
Choosing When to Trade
You’ll get the tightest spreads and quickest fills when liquidity peaks. For most stocks, that’s right after the open and just before the close. If you don’t trade volatility, it’s usually best to skip low-volume hours or major news drops.
Check out average spreads for your market. Here’s a quick breakdown:
| Market Type | Typical Tight Spread Time | Typical Wide Spread Time |
|---|---|---|
| U.S. Stocks | 9:30–10:30 a.m. ET | Midday (12–2 p.m. ET) |
| Forex | London–New York overlap | Asian session |
You can use TradingView to watch spreads in real time and see when liquidity picks up.
Day traders usually wait for spreads to drop below 0.05% of price. If you’re investing for the long term, you might accept a slightly wider spread if the fundamentals look solid. Always weigh spread cost against how urgent your trade is.
Managing Spread-Related Risks
Wide spreads mean higher costs and more slippage. You can cut this by sticking to limit orders instead of market orders. With a limit order, you set your max buy or min sell price, so you don’t get burned by a sudden move.
If you’re trading small caps or thin names, expect spreads to widen after hours or during news. You might want to shrink your position or just wait if spreads blow past your comfort zone.
Track how spreads change over time. If you see a stock with consistently wide spreads, it’s probably illiquid or extra risky. Stock Rover can help you screen for stocks with steady volume and tighter spreads.
Here’s a simple checklist:
- Look for spreads under 0.1% on large caps
- Skip trades right after earnings
- Use stop-limit orders for jumpy assets
Optimizing Trade Execution
Execution matters—a lot. If you want to nail your price, combine smart order types with good timing.
TrendSpider can automate charting and ping you when spreads hit your target. That way, you avoid emotional trades.
Break big orders into smaller chunks to avoid moving the market. Institutions often use iceberg orders to hide their full size and keep slippage down.
Check your broker’s routing. Direct routing to the most liquid venues can get you better fills, especially when things get volatile.
Don’t forget to review your trade logs every month. Compare what you expected to what actually happened. If you spot patterns—like regular slippage or spread creep—tweak your strategy before you size up.
Lesson Review Questions
1. What is the bid-ask spread in stock trading?
The bid-ask spread is the difference between the highest price a buyer is willing to pay for a stock (the bid) and the lowest price a seller is willing to accept (the ask). It represents a real transaction cost that affects how much you effectively pay or receive when trading.
2. Why are bid-ask spreads typically narrow for large, well-traded stocks?
Narrow spreads occur when a stock has high liquidity—meaning many buyers and sellers actively trade it. This strong participation results in smaller price gaps between bids and asks, allowing trades to occur more efficiently and at fairer prices.
3. What causes wide bid-ask spreads in certain stocks?
Wide spreads are usually due to low trading volume, limited liquidity, or high uncertainty around a stock’s value. This is common in penny stocks, microcaps, and lightly traded securities where few participants are willing to trade, increasing the gap between buying and selling prices.
4. How does the bid-ask spread impact your trading cost?
The spread acts as an invisible fee. When you buy at the ask and sell at the bid, you immediately lose the difference between those two prices. The wider the spread, the more it costs you to enter and exit positions, especially for frequent traders.
5. Why might using a limit order be beneficial when trading stocks with wide spreads?
A limit order allows you to specify the maximum price you are willing to pay or the minimum price you are willing to accept. This helps prevent overpaying in wide-spread stocks and gives you more control over execution, especially when the market is thinly traded.
6. How do market conditions affect bid-ask spreads?
During high volatility, uncertainty, or major news events, spreads often widen because market makers and traders adjust prices to manage risk. In calm markets with stable conditions, spreads tend to narrow due to increased confidence and higher trading activity.