The Piotroski F-Score provides a straightforward measure for understanding a company’s financial health.
It focuses on value stocks and combines profitability, leverage, liquidity, and efficiency metrics to determine a company’s strength.
The Piotroski F-Score helps long-term value investors identify robust investment opportunities by analyzing factors such as profitability, leverage, and operational efficiency.
Financial analysis is crucial when choosing where to invest, and the Piotroski F-Score is a powerful tool that assists in this process. By examining criteria such as return on assets, current ratio, and change in gross margin, investors can gain valuable insights that help them avoid financially unstable companies.
Piotroski F-Score Calculator
Score a stock from 0 to 9 using profitability, balance sheet strength, and operating efficiency signals.
How This Calculator Works
In Simple mode, select Yes if the company passes each Piotroski test and No if it fails. Each passing test scores 1 point.
Profitability Tests
Leverage, Liquidity & Financing Tests
Operating Efficiency Tests
Results
| Test | Result |
|---|---|
| Positive ROA | Yes |
| Positive Operating Cash Flow | Yes |
| ROA Improved | Yes |
| CFO > Net Income | Yes |
| Lower Leverage | Yes |
| Higher Current Ratio | Yes |
| No New Shares Issued | Yes |
| Higher Gross Margin | Yes |
| Higher Asset Turnover | Yes |
Full Calculator Walkthrough Piotroski F-Score Online Calculator: Simple & Advanced Mode
Key Takeaways
- Piotroski F-Score evaluates a company’s financial health.
- It focuses on value stocks and critical financial metrics.
- When effectively implemented, it has been proven to reduce risk in investment portfolios.
- Joseph Piotroski, an accounting professor at the University of Chicago, developed the Piotroski F-Score. His research found that companies with a high F-score tend to outperform the market while those with a low score underperform.
How to Use the Calculator
The easiest way to start is with Simple mode. In Simple mode, each of the nine Piotroski tests is presented as a Yes-or-No question. For each test, select Yes if the company passes and No if it fails. Every passing test earns 1 point, and the calculator adds them together to produce the final F-Score from 0 to 9.
If you want more precision, use Advanced mode. In that mode, enter the current-year and prior-year financial values needed to automatically evaluate the nine tests. These include:
- net income
- total assets
- operating cash flow
- long-term debt
- current assets
- current liabilities
- shares outstanding
- revenue
- gross profit
Once the values are entered, the calculator shows the total Piotroski F-Score, the section breakdown, and a simple interpretation of the company’s overall quality.
The score works best as a screening tool. It helps you decide whether a stock deserves deeper research, not whether it is automatically a buy.
Incorporating the Piotroski F-Score into investment strategies can greatly enhance portfolio performance. Investors who understand and utilize this score can better navigate the complexities of the market. While the score has limitations, its effectiveness in identifying strong candidates for investment remains a significant advantage.
Development of the Piotroski F-Score
Joseph Piotroski, a professor at the University of Chicago, introduced the Piotroski F-Score in 2000. His research was published to aid value investors in identifying undervalued stocks. Using data from financial statements, this score helps investors make informed decisions by offering a clear picture of a company’s fundamentals. He focused on companies with low price-to-book ratios, as these are often overlooked and can potentially offer high returns.
His initial research examined firms’ financial statements over 20 years. Piotroski’s work demonstrated that a simple scoring system could effectively predict future stock performance. This approach later gained popularity among value investors and was further supported by firms like Alpha Architect.
Criteria and Scoring
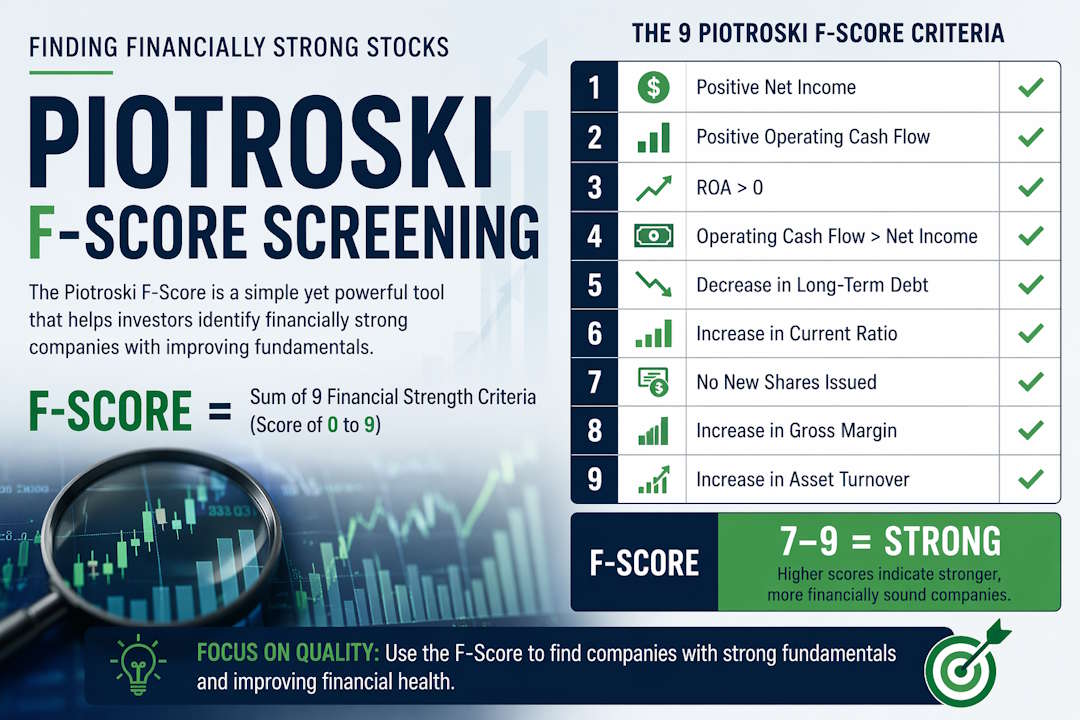
The Piotroski F-Score evaluates a company based on nine criteria derived from its financial statements. These criteria are grouped into three categories: profitability, leverage and liquidity, and operating efficiency.
- Profitability: Net income, return on assets, operating cash flow, and change in return on assets.
- Leverage and Liquidity: Change in leverage, change in current ratio, and issuance of new equity.
- Operating Efficiency: Change in gross margin and change in asset turnover.
Each criterion is given a score of 1 if it meets Piotroski’s standards and 0 if it does not. Thus, a company can achieve a maximum F-Score of 9, indicating robust financial health.
Score Interpretation
The interpretation of the Piotroski F-Score is straightforward. Companies scoring between 8 and 9 are considered strong and financially healthy, suggesting they are good investment opportunities. These firms exhibit solid profitability metrics, stable or improving leverage ratios, and efficient operations.
Scores in the mid-range (4-6) indicate moderate financial health, where investors may need to exercise caution. Firms with scores below 4 are considered financially weak and potentially risky investments. Using this scoring system, investors can better assess which stocks to include in their portfolios based on empirical data and financial performance indicators.
Charting & Screening the Piotroski F-Score
You do not need to calculate the Piotroski F-Score manually; Stock Rover does it for you. Only Stock Rover provides advanced hybrid financial metrics, such as the Piotroski F-Score, Altman Z-Score, Beneish M-Score, Graham Number, Greenblatt Earnings Yield, Greenblatt ROC, Chowder Rule, Yacktman Forward Rate of Return, and the Sharpe ratio.
The chart screenshot below shows the Piotroski F-Score plotted over time.
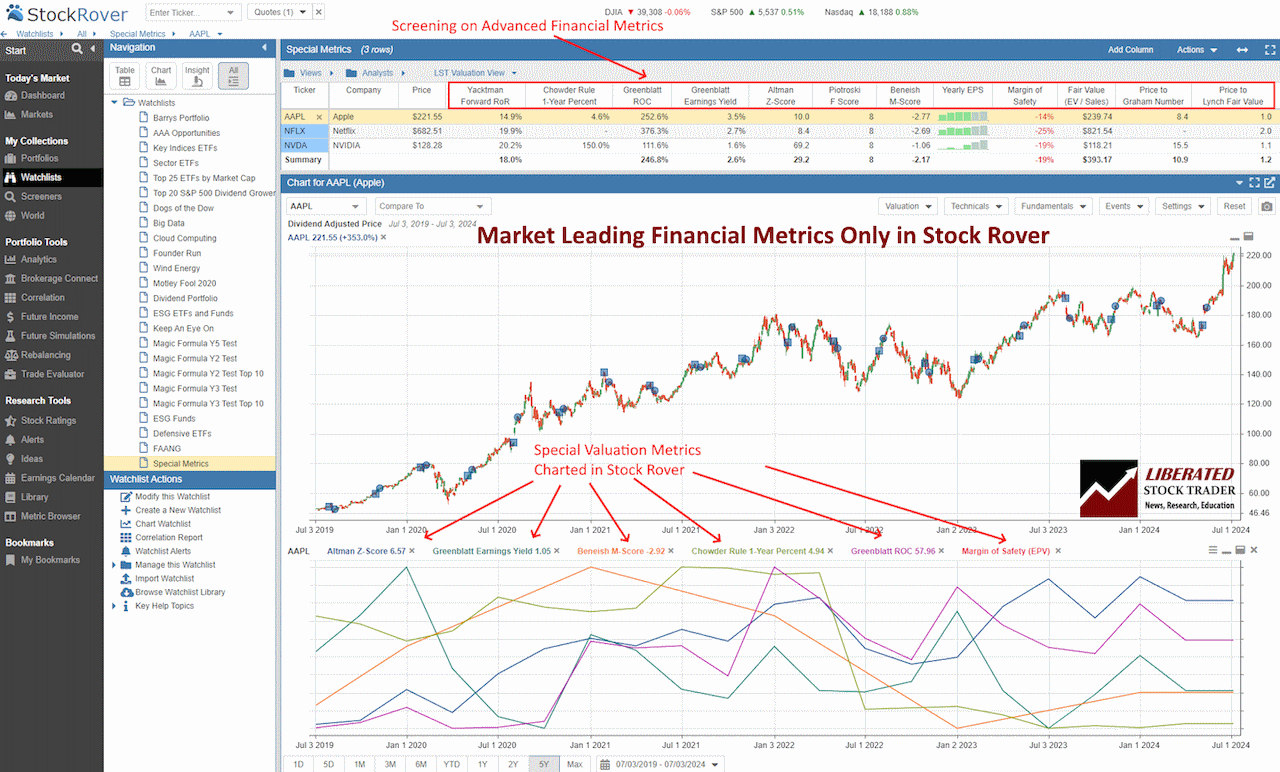
Chart & Screen the Piotroski F-Score with Stock Rover
Understanding the Piotroski F-Score
The Piotroski F-Score evaluates nine financial metrics to assess a firm’s profitability, financial health, and operational efficiency.
For each metric a company passes, it receives one point. A score of zero indicates a financially weak company, while a score of nine indicates a company with a strong balance sheet.
Piotroski F-Score Calculation
Profitability Indicators
Profitability is a key aspect that reflects a firm’s ability to generate income relative to its revenue, assets, or shareholders’ equity. Important profitability metrics include net income, return on assets (ROA), and gross margin.
- Net Income: This represents the total profit after deducting all expenses, taxes, and costs from revenues. A higher net income signifies better profitability. (1 point)
- Return on Assets (ROA): This measures how efficiently a company uses its assets to generate profit. Positive ROA indicates good financial health. (1 point)
- Gross Margin: This ratio shows the percentage of revenue that exceeds the cost of goods sold. A higher gross margin suggests effective production and cost management. (1 point)
- Cash flow from operations being greater than net Income (1 point)
Leverage, Liquidity, and Source of Funds
An analysis of leverage, liquidity, and sources of funds provides insights into a firm’s financial stability and risk levels. Key metrics include the current ratio, long-term debt, and equity.
- Current Ratio: This ratio, calculated as current assets divided by current liabilities, examines a firm’s ability to pay short-term obligations. A ratio above 1 indicates good liquidity. (1 point)
- Long-Term Debt: Loans and other financial obligations due more than one year from the date of issuance. Lower long-term debt relative to assets and equity indicates a strong financial position. (1 point)
- Equity: This represents an ownership interest in the company. A higher equity level compared to debt suggests a more stable financial structure and lower risk. (1 point)
Operating Efficiency Measures
Operational efficiency measures how well a company utilizes its resources to generate sales and manage expenses. Important metrics include asset turnover and cash flow from operations.
- Asset Turnover: This ratio indicates how effectively the company uses its assets to generate sales. Higher asset turnover is a sign of efficient resource use. (1 point)
- Cash Flow from Operations: This metric measures the cash generated from core business activities. Positive cash flow indicates the firm can sustain operations and is not overly reliant on external financing. (1 point)
By focusing on these financial metrics, the Piotroski F-Score helps assess a company’s profitability, financial position, and operational efficiency. More details can be found in research on the efficacy of the Piotroski F-Score and its use in evaluating firms.
Understanding Piotroski F-Scores
An F-score of zero indicates weak financials, and a score of nine indicates strong financials. The higher the score, the better the company’s overall financial health. So how does it work?
The Piotroski F-Score evaluates nine fundamental accounting factors to determine a company’s financial strength. These factors include profitability (return on assets and operating margin), leverage (debt-to-equity ratio), liquidity (current ratio and cash flow from operations), efficiency (asset turnover), and changes in these metrics over time.
One indicator that can be particularly helpful is the debt-to-equity ratio. A high ratio could indicate that a company relies heavily on borrowed funds to finance its operations, increasing risk for investors.
Implementing the Piotroski F-Score in Investment Strategies
Implementing the Piotroski F-Score helps investors improve their value investing strategy, diversify their portfolios, and reduce risk.
Value Investing and Stock Selection
The Piotroski F-Score is a financial scoring system that helps in value investing. It uses nine financial ratios to judge a company’s financial health. These ratios cover profitability, leverage, liquidity, and operating efficiency. By analyzing these factors, investors can identify undervalued stocks with strong fundamentals.
Investors can use the F-Score to screen potential investments, focusing on companies with high scores. A high score indicates financial strength, making these stocks attractive for long-term investments. The strategy has been shown to be effective in various markets, including the US stock market and Australia.
Portfolio Diversification and Risk Management
Using the Pietroski F-Score also aids in portfolio diversification and risk management. By selecting stocks based on a structured financial analysis, investors can build a diversified portfolio that balances risk and reward.
A diversified portfolio reduces exposure to individual stock volatility. High F-Score stocks are generally financially strong, which may lower investment risks. This approach aligns with portfolio theories such as Markowitz Portfolio Theory, which emphasize diversification to minimize risk. An example of this can be found in the Indonesian Stock Market.
Tools and Resources for Investors
Investors can leverage various tools and resources to use the Piotroski F-Score effectively. Excel templates are commonly used to calculate the F-Score, but they are laborious to use. Online platforms like Stock Rover offer screeners that rank stocks based on their F-Scores.
Stock Rover 4.7/5⭐ : My Top Pick for Smart Investors
Investing In Stocks Can Be Complicated. Stock Rover Makes It Easy.
★
Growth Investing - with industry-leading
Research Reports ★
★ Value Investing - using Warren Buffett's Fair Value and Margin-of-Safety ★
★ Income Investing - rank by yield, growth, quality, and safety using 650 metrics ★

"I have been researching and investing in stocks for 20 years! I now manage all my long-term investments using Stock Rover." — Barry D. Moore, Founder: LiberatedStockTrader.com
Limitations and Considerations of the Piotroski F-Score
The Piotroski F-Score is a useful tool for identifying undervalued stocks, but there are several key limitations that investors should consider. These include sector-specific concerns and the influence of market fluctuations.
One major limitation is its focus on historical data, which may not reflect current market conditions influenced by factors such as the COVID-19 pandemic. This means the score might miss recent corporate developments such as new equity issuance or unexpected financial downturns.
Another issue is that the tool does not account for cyclical sectors, where performance can vary widely based on economic cycles. For example, industries such as airlines or oil might not be accurately assessed by the F-Score due to their inherent volatility.
Sector-Specific Concerns and Market Fluctuations
The F-Score does not differentiate between sectors, which can lead to skewed results. In cyclical sectors like automotive or retail, short-term financial health may not give a true picture of long-term viability.
Market fluctuations can also impact the reliability of the Piotroski F-Score. For instance, during a market downturn, even fundamentally strong companies might get unfairly penalized. During an economic rally, weaker companies might appear more stable than they truly are due to temporary revenue boosts.
Therefore, while the F-Score provides an objective analysis of financial health and undervalued opportunities, investors should complement it with subjective judgment and sector-specific research to fully understand potential risks and advantages.
Stock Rover 4.7/5⭐ : My Top Pick for Smart Investors
Investing In Stocks Can Be Complicated. Stock Rover Makes It Easy.
★
Growth Investing - with industry-leading
Research Reports ★
★ Value Investing - using Warren Buffett's Fair Value and Margin-of-Safety ★
★ Income Investing - rank by yield, growth, quality, and safety using 650 metrics ★
"I have been researching and investing in stocks for 20 years! I now manage all my long-term investments using Stock Rover." — Barry D. Moore, Founder: LiberatedStockTrader.com
FAQ
What is the best software for screening and charting the Piotroski F-Score?
Stock Rover is the best software for screening and charting advanced financial metrics like the Piotroski F-Score. Our testing shows it offers the widest array of metrics and ratios available on the market today.
How do you calculate the Piotroski F-Score?
The Piotroski F-Score is calculated using nine criteria, each scored as 1 or 0. These criteria assess profitability, leverage, liquidity, and operating efficiency. A company can score between 0 and 9, with higher scores indicating stronger financials.
What constitutes a good score on the Piotroski F-Score scale?
A good Piotroski F-Score is typically 8 or 9. Scores in this range suggest the company has solid financial health and operational efficiency. A score of 0-2 is considered poor and may indicate financial trouble.
Can the Piotroski F-Score predict stock performance accurately?
The Piotroski F-Score has shown effectiveness in identifying outperforming stocks, especially in value investing. Studies suggest that portfolios with high F-Score companies tend to perform better than the market average, although it is not a guaranteed predictor.
How does the Piotroski F-Score differ from the Altman Z-score in assessing a company's financial health?
The Piotroski F-Score focuses on profitability, leverage, and operating efficiency, while the Altman Z-score predicts bankruptcy risk. The F-score uses nine accounting-based metrics, whereas the Z-score combines multiple financial ratios into one formula.
Is there a reliable screener available to identify stocks with high Piotroski F-Scores?
Yes, Stock Rover provides a screener that can filter stocks based on their Piotroski F-Score. It helps investors quickly identify companies with high scores and strong financial health.
How can one implement the Piotroski F-Score strategy within an investment portfolio?
To use the Piotroski F-Score strategy, an investor can create a portfolio consisting of stocks with high F-Scores. Regularly updating the portfolio based on the F-Score can help maintain exposure to financially strong companies, enhancing potential returns.
TradingView 4.8/5⭐ : The Best Trading Platform I’ve Tested in 20+ Years
With lightning-fast charts, powerful pattern recognition, smart screening, backtesting, and a global community of 20+ million traders — it’s a powerful edge in today’s markets.

If you want one platform that gives you an edge, this is it.