There are two fundamentally differing views about how the stock market operates. The efficient market hypothesis (EMH) says markets are always efficient, and random walk denies the effect of past performance and trends.
The efficient market hypothesis suggests all available information is already incorporated into a stock’s price, but the random walk says current prices are completely independent of past performance.
Both theories agree that market prices reflect all available information at any given time, whether or not it’s taken.
While both theories have their supporters and critics, they both highlight the importance of doing thorough research before making investment decisions.
But which one is correct, or do they both contain an element of truth?
Video From The Liberated Stock Trader Pro Masterclass Course
As you begin talking to friends, family, work colleagues, or even people in the financial industry, you may hear certain terms thrown around, such as random walk theory and efficient market hypotheses. You need to understand what they mean and where they fit in.
What is the Random Walk Theory?
Economists generally argue that stock price movement is essentially random and that when you trade stocks, you are simply gambling. They state that the history of price has no bearing on the future stock price. However, randomness exists only in the short term (minutes to days).
The technical analyst sees that stock prices move in trends; we will discuss this in detail in market cycles and Fibonacci waves later. Price trends are as clear as day and night. The job of a business is to add value and create profit; this means the default direction of the market is up. However, this is interspersed with times of sideways and negative price growth. A random walk, it is not.
If we look at the random walk theory, the core principle is that stock price movement is serially independent, so they assert that the stock price is random; it essentially moves around with no basis and no relation to its historical price.
As we will see in future lessons when we study charts in detail, history does affect the stock price, and you will see support and resistance trend lines. The interaction of stock prices in market cycles is a factor in how the market works.

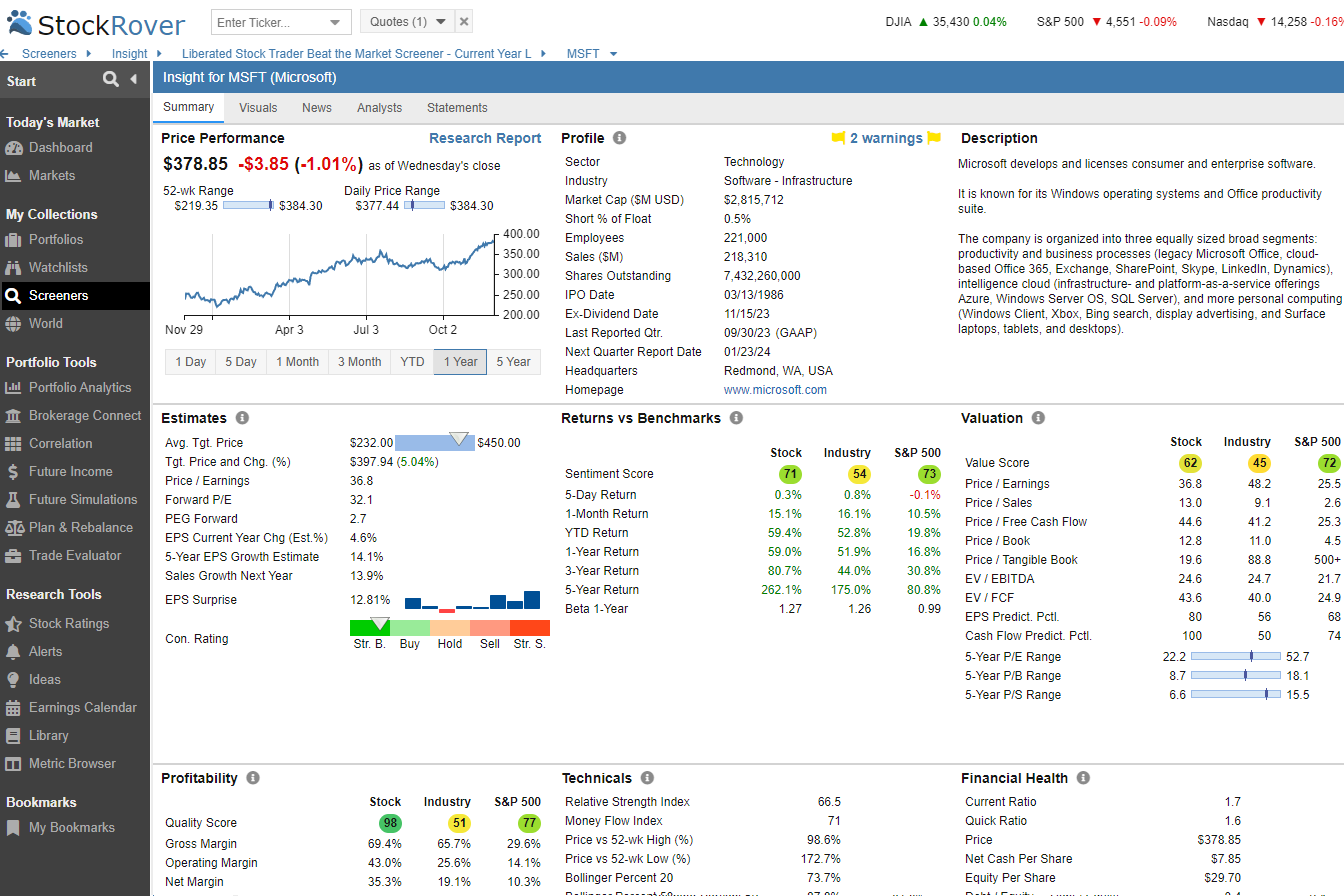
Try Powerful Financial Analysis & Research with Stock Rover
What is the Efficient Market Hypothesis (EMH)?
Efficient market protagonists suggest that stock prices are not random and fluctuate around a stock’s intrinsic value, meaning that the market is efficient and always correct. However, if your timing is wrong, buying and holding the wrong stock can make you poor.
The more you get drawn into an academic debate about economics, the less time you can devote to investing in the stock market.
Technical analysis can be applied to all markets, foreign exchange, futures, commodities, and stocks.
Regarding the efficient market hypotheses, it asserts that prices fluctuate randomly around an intrinsic value. However, when we see the boom and bust scenarios in 2008/2009, in 2000, 1987, and the early 1970s, we see in these boom and bust situations that they don’t fluctuate randomly around an intrinsic value.
Essentially, modern economic theory cannot account for many factors in the stock market. So, although economic theory is all good, it has minimal bearing on the actual market itself.
We will study what happens in the stock market and how to profit from the various actions and forces that exert themselves in it.
The efficient market hypothesis also recommends a buy-and-hold strategy instead of trying to beat the market.
If you want a very hands-off approach to investing, it may well be worth purchasing index-tracking ETFs.
The ideal price and time to get in and buy and hold would be at the bottom of a bear market. However, as we know, the S&P 500 has produced about a six—to seven percent return on investment year on year since the early 1970s. Six or seven percent isn’t going to make you a millionaire until you retire, depending on your age, but we’re talking 30 to 50 years before that happens.
That’s not ideal, so this investing training course will be about beating the market.
Beat The Market, Avoid Crashes & Lower Your Risks
Nobody wants to see their hard-earned money disappear in a stock market crash.
Over the past century, the US stock market has had 6 major crashes that have caused investors to lose trillions of dollars.

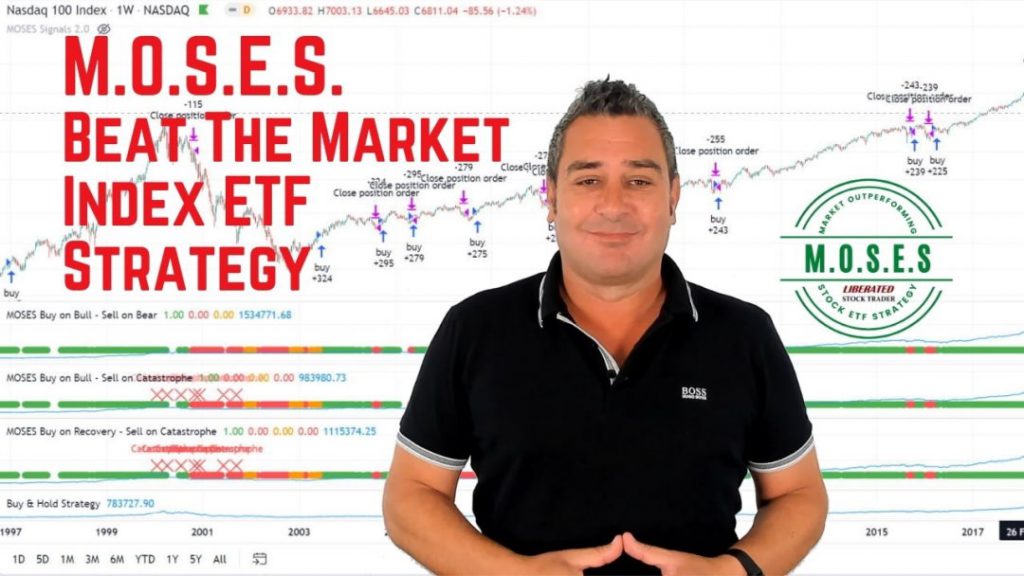
The MOSES Index ETF Investing Strategy will help you minimize the impact of major stock market crashes. MOSES will alert you before the next crash happens so you can protect your portfolio. You will also know when the bear market is over and the new rally begins so you can start investing again.
MOSES Helps You Secure & Grow Your Biggest Investments
★ 3 Index ETF Strategies ★
★ Outperforms the NASDAQ 100, S&P500 & Russell 3000 ★
★ Beats the DAX, CAC40 & EURO STOXX Indices ★
★ Buy & Sell Signals Generated ★
MOSES Helps You Sleep Better At Night Knowing You Are Prepared For Future Disasters
Efficient Markets vs. Random Walk Theory
The efficient markets theory states that all available information about a company is already reflected in its stock price. Any attempt to outperform the market by analyzing stocks or predicting trends is futile, as the market has already factored in this information.
On the other hand, the random walk theory suggests that stock prices cannot be predicted or beaten because they follow a random pattern. This means that past performance or trends do not impact future performance, making it impossible to consistently outperform the market.
However, some investors have used technical analysis to outperform the market and even beat professional portfolio managers over time.
| Random Walk Theory | Efficient Market Hypothesis |
| Stock Price Movement is “serially independent.” | Prices fluctuate randomly around intrinsic value. |
| Price history is not a reliable indicator of future price direction. | It recommends buying and holding as opposed to beating the market. |
The Reality of Stock Market Investing
The more you get drawn into an academic debate about economics, the less time you can devote to making money in the marketplace.
Technical chart analysis can be applied to all markets, including foreign exchange futures, commodities, and stocks. This training course will focus on fundamentals and technicals in stock prices and the stock market, using potent tools such as options shorting, buying long, and simply buying stocks.
It would be best not to polarize yourself in the fundamental or technical camps; it’s a combination of both.
Regarding fundamental analysis, great companies have great fundamentals; great fundamentals generally mean higher company valuations, and the higher the company value, the higher the stock price; that’s basic business.
However, on the technical side, great fundamentals do not always mean large moves in stock price; too many external factors can influence the stock price.
We want to use supply and demand integrated with fundamental analysis. We’ll use technical analysis, which helps analyze the supply and demand through price and stock price volume and the psychological sentiment side of the market.
I hope this has given you a good overview of the different approaches to the stock market and sets the tone for what we will learn in future classes.
You want to be a successful stock investor but don’t know where to start.
Learning stock market investing on your own can be overwhelming. There’s so much information out there, and it’s hard to know what’s true and what’s not.
Liberated Stock Trader Pro Investing Course
Our pro investing classes are the perfect way to learn stock investing. You will learn everything you need to know about financial analysis, charts, stock screening, and portfolio building so you can start building wealth today.
★ 16 Hours of Video Lessons + eBook ★
★ Complete Financial Analysis Lessons ★
★ 6 Proven Investing Strategies ★
★ Professional Grade Stock Chart Analysis Classes ★
The Liberated Stock Trader Pro Training has sections on:
- Fundamental analysis looks at the overall context and friendliness of the economic environment to business.
- How to value a company
- How to find great companies
If you choose two stocks to buy, one company is losing money, but the stock chart looks great, and another company is making a lot of money and expanding rapidly, and the stock chart looks great, which one will you choose?
That’s why you need to understand fundamental analysis.
However, we’ll also focus on technical analysis. We need to understand supply and demand, how that affects stocks, and how that will affect the market.
Also, what is a great-looking stock, what indicators make a difference, and how can you use them to make money in stocks?
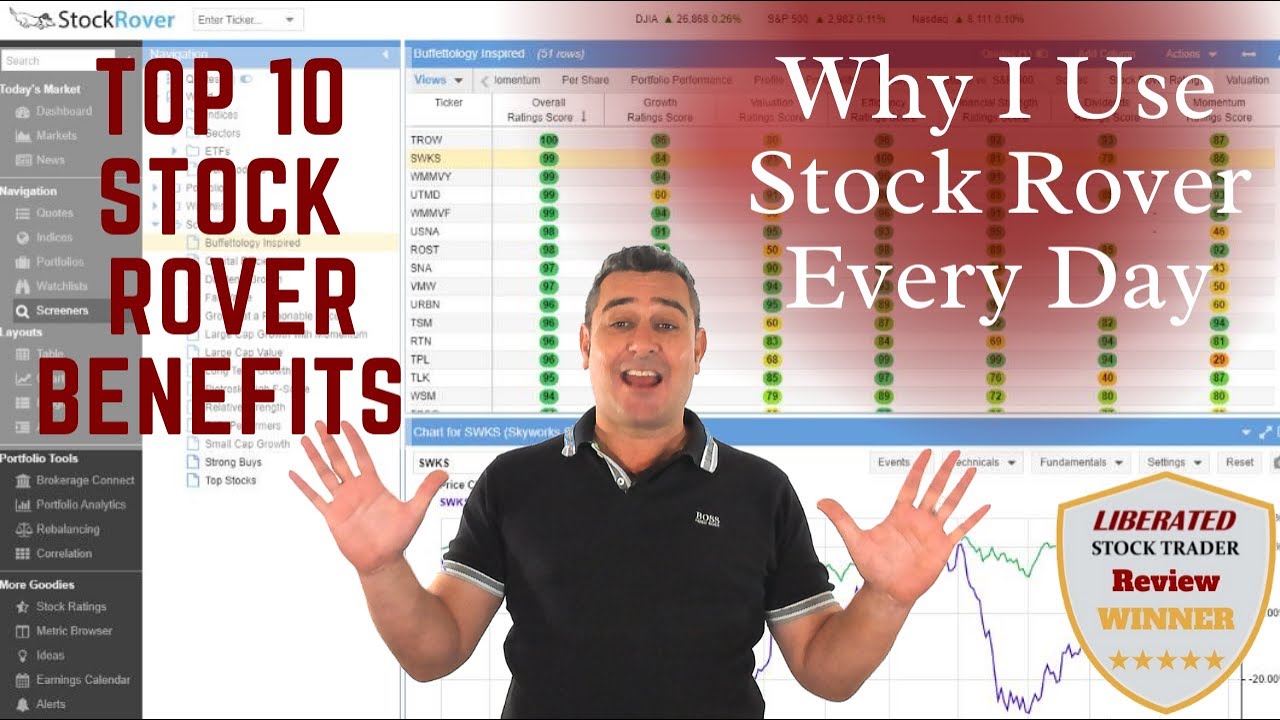
Investing In Stocks Can Be Complicated, Stock Rover Makes It Easy.
Stock Rover is our #1 rated stock investing tool for:
★ Growth Investing - With industry Leading Research Reports ★
★ Value Investing - Find Value Stocks Using Warren Buffett's Strategies ★
★ Income Investing - Harvest Safe Regular Dividends from Stocks ★

"I have been researching and investing in stocks for 20 years! I now manage all my stock investments using Stock Rover." Barry D. Moore - Founder: LiberatedStockTrader.com
Summary
The best approach to the market is to combine the very best of the Fundamental approach with the very best of the Technical approach to have a complete strategy. This means finding the best companies with great fundamentals, like low debt, great revenue growth, and great profit growth in growing markets.
Technical analysis will then be used to time the investment when the market is at the right point. This means when the market moves in the right direction and the stock’s price moves in the right direction.
“The trend is your friend,” as the old proverb goes.

