The Fixed Charge Coverage Ratio (FCCR) is an important financial metric analysts and investors use to evaluate a company’s ability to meet its fixed-charge obligations.
These fixed charges generally include debt payments, lease payments, and insurance premiums. By comparing a company’s earnings before interest and taxes (EBIT) with its total fixed charges, the FCCR provides insight into its financial stability and the cushion available to cover these charges.
This ratio is particularly useful for assessing companies with significant levels of debt or those considering new financing, as it highlights the firm’s operational efficiency and ability to service its ongoing financial obligations.
Key Takeaways
- Fixed Charge Coverage Ratio assesses a company’s ability to cover fixed financial obligations with earnings.
- Creditors utilize the FCCR to determine the risk of lending to a business.
- A comprehensive analysis includes FCCR, among other financial metrics, for an accurate financial health assessment.
Lenders and creditors frequently use the FCCR to gauge a company’s creditworthiness. A higher ratio suggests that a company is better positioned to handle its fixed expenses with its current earnings, thus implying lower credit risk.
Additionally, it aids companies in managing their debt levels and making informed decisions about capital structure and future financing needs. Although insightful, the FCCR should not be evaluated in isolation; it is imperative to consider it alongside other financial metrics and the context of the broader industry trends to get an accurate analysis of company performance and risk.

Conceptual Overview of Fixed Charge Coverage Ratio
The Fixed Charge Coverage Ratio (FCCR) is a crucial indicator of a company’s financial health, measuring its ability to meet fixed financial obligations with earnings.
Defining Fixed Charge Coverage Ratio
FCCR is a financial metric that determines how well a business can cover its fixed charges with its operating income. It is calculated by dividing Earnings Before Interest and Taxes (EBIT) by fixed charges, which typically include expenses such as interest and lease payments.
Importance for Businesses
Understanding FCCR is essential for businesses. It reflects a company’s cushion to cover its fixed obligations, which is a vital aspect of financial stability. A higher FCCR suggests greater financial flexibility, indicating a lower risk of default on its obligations.
Comparison with Other Financial Ratios
While FCCR focuses on fixed charges, other financial ratios like the Debt Service Coverage Ratio and Interest Coverage Ratio concentrate on debt and interest expense specifically. Unlike these ratios, FCCR provides a more comprehensive view of a company’s ability to satisfy all fixed financial commitments, not just debt-related expenses.

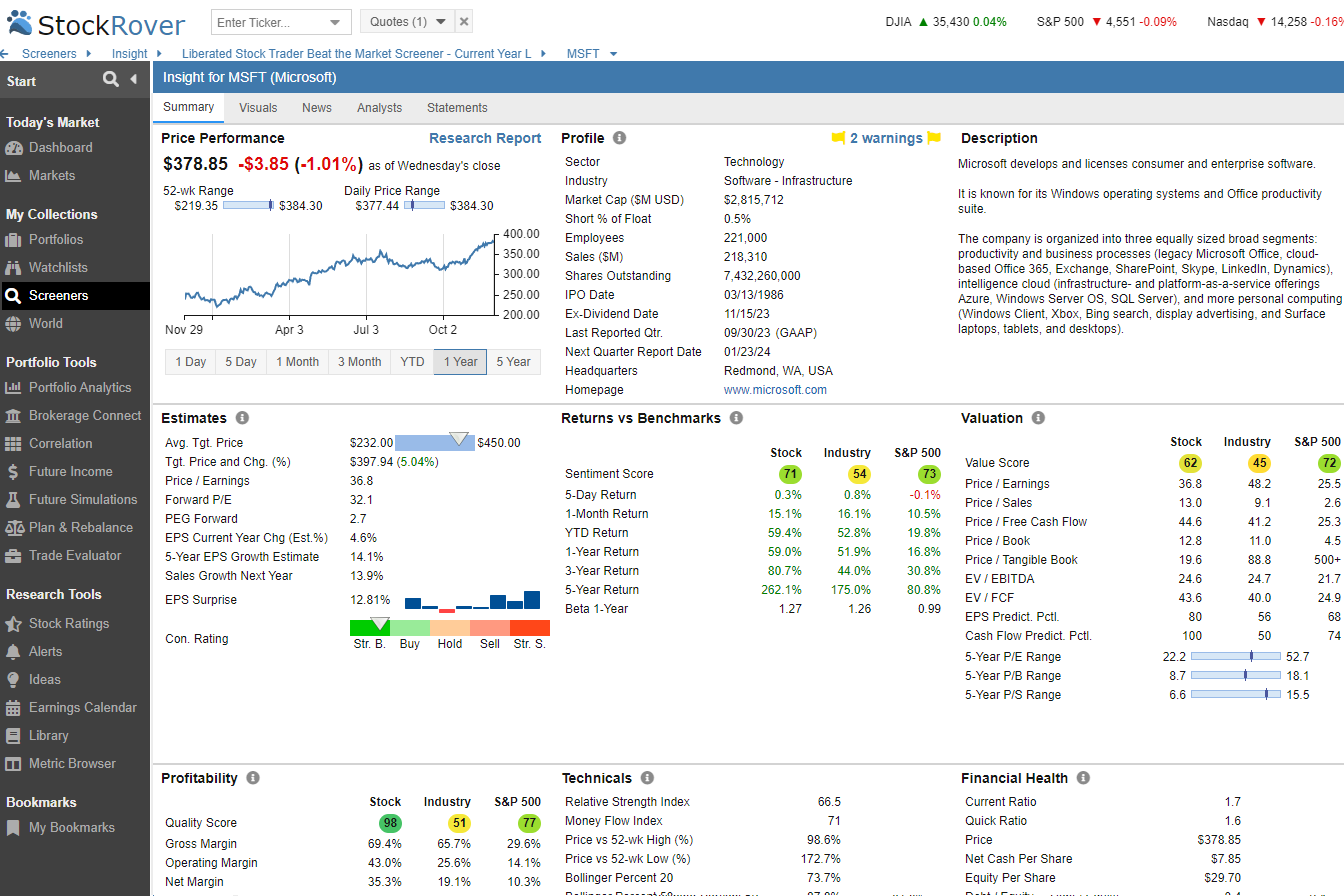
Try Powerful Financial Analysis & Research with Stock Rover
Calculation of FCCR
Understanding the Fixed Charge Coverage Ratio (FCCR) is crucial for analyzing a company’s ability to pay its fixed charges with its operating income. It is a key indicator of financial health, particularly in meeting regular fixed obligations.
Components of the Formula
The FCCR calculation primarily includes earnings before interest and taxes (EBIT) and various fixed charges. Fixed charges typically encompass regular, inevitable expenses such as rent, leasing expenses, insurance, and lease payments. Identifying all relevant fixed charges before tax is essential to accurately assess an enterprise’s operational and financial resilience.
Step-by-Step Calculation Guide
- Begin by identifying the company’s EBIT from the financial statements, representing the earnings with interest and taxes excluded.
- Sum all fixed charges before tax, including rent, leasing expenses, and insurance premiums.
- The formula for FCCR can be expressed as follows:
FCCR = EBIT/ (EBIT + Fixed Charges)
As an example, if a company has an EBIT of $300,000, fixed charges of $50,000, and interest payments of $25,000, the calculation would be:
FCCR = $300,000 / ($300,000 + $50,000)
The result of this calculation would be an FCCR of 85.7%. This indicates that the company is relatively financially resilient since its ratio is quite high. The higher the FCCR, the more resilient a company will be to fixed charges before tax.
Interpreting the Results
An FCCR greater than 1 indicates that the company generates sufficient earnings to cover its fixed charges. An FCCR of less than 1, however, may suggest potential challenges in meeting these obligations.
For instance, a ratio of 4.67 implies that the company’s earnings are more than four times its fixed costs, signaling strong financial stability regarding its fixed obligations. This ratio is an important metric for creditors and investors assessing the risk associated with a company’s financial structure.
Factors Impacting FCCR
A company’s financial health and operational choices heavily influence the Fixed Charge Coverage Ratio (FCCR). Specific financial obligations and operational activities are critical in determining this key financial metric.
Influence of Operating Expenses
Operating expenses, including utilities, rent, and salaries, directly affect an organization’s ability to meet its fixed-charge obligations. A company’s efficient management of these operating expenses can lead to a healthier FCCR, which signifies more available cash flow to cover fixed charges like lease expenses.
Conversely, high operating costs can strain the cash flow, making it challenging to maintain an adequate FCCR.
Capital Structure and Debt Management
Companies with high leverage, indicated by more loans and debt obligations, can have a lower FCCR as a larger portion of their cash flow is devoted to debt payments. A well-structured mix of equity and debt (capital structure) that optimizes payment schedules and interest rates can thus enhance a firm’s FCCR.
Effective debt management is crucial for maintaining a buffer against earnings and cash flow fluctuations.
Revenue Stability and Growth
Revenue streams that are stable and predictable facilitate a consistent FCCR, as they ensure regular cash flow to meet fixed charges. Growth in sales also plays a vital role; it not only increases the numerator in the FCCR calculation but often reflects a company’s capacity for scaling operations while managing additional fixed charges.
However, if growth is too rapid and not supported by corresponding cash inflows, it can temporarily depress FCCR.
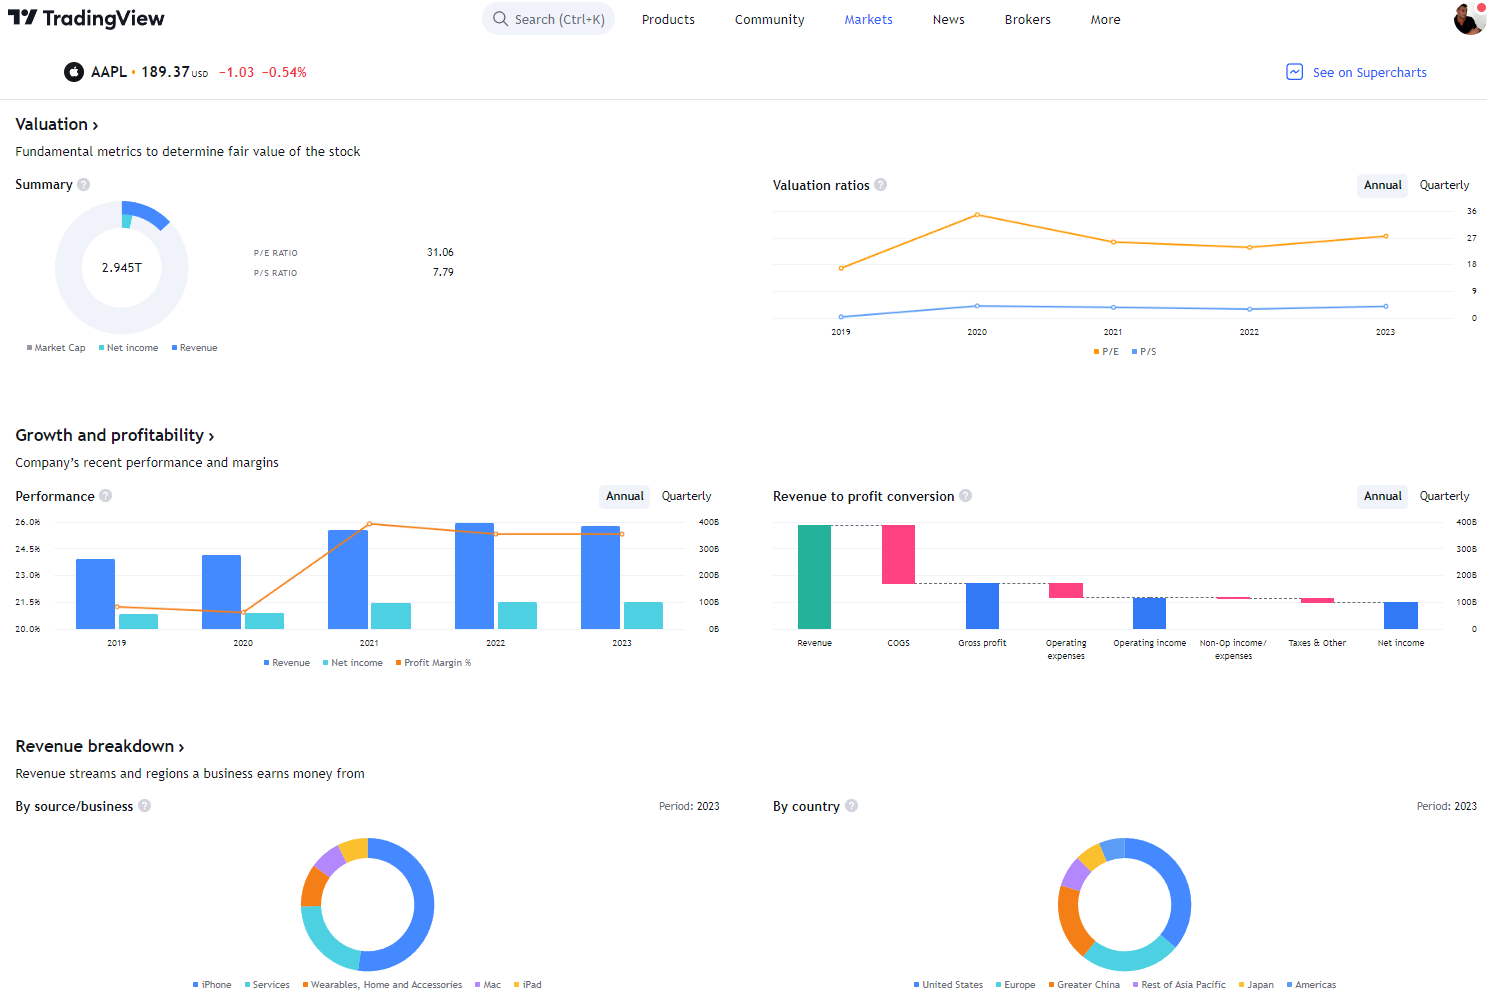
Try TradingView, Our Recommended Tool for International Traders
Global Community, Charts, Screening, Analysis & Broker Integration

Global Financial Analysis for Free on TradingView
Applications in Financial Analysis
The Fixed Charge Coverage Ratio (FCCR) is a critical tool in financial analysis. It provides stakeholders with insights into a company’s ability to handle financial obligations. Its applications range from lending decisions to investment strategies and business valuations.
Lender Perspectives on FCCR
Lenders use the FCCR to assess a borrower’s financial health, specifically, its ability to cover fixed charges such as interest expenses and lease payments. A higher ratio signifies that a company can comfortably manage its fixed charges and is less likely to default on its debts.
Importantly, FCCR is often compared with other metrics like the debt service coverage ratio (DSCR) to ensure a comprehensive analysis of debt sustainability.
Investment Decisions and FCCR
When investors scrutinize a company, the FCCR measures the firm’s financial stability and growth potential. A consistent capacity to meet fixed obligations suggests a solid foundation for dividend distribution, which can influence investment choices. Investors typically prefer companies with a strong FCCR, as it exhibits a buffer against fluctuations in earnings.
FCCR in Business Valuation
During business valuation, analysts consider FCCR an essential indicator of a company’s ability to generate enough earnings before interest and tax (EBIT) to cover fixed charges. A robust FCCR indicates that the company can sustain growth and weather economic downturns, thereby enhancing its valuation. The FCCR is pivotal in the comprehensive financial analysis, affecting the valuation outcomes.
Limitations and Considerations
When assessing the Fixed Charge Coverage Ratio (FCCR), it’s crucial to understand its limitations and the need for contextual adjustments. These nuances affect the accuracy and usefulness of this solvency ratio for evaluating a company’s financial health.
My thorough testing awarded TradingView a stellar 4.8 stars!
With powerful stock chart analysis, pattern recognition, screening, backtesting, and a 20+ million user community, it’s a game-changer for traders.

Whether you're trading in the US or internationally, TradingView is my top pick for its unmatched features and ease of use.
Explore TradingView – Your Gateway to Smarter Trading!
Limitations of FCCR in Evaluating Financial Health
FCCR is a critical measure for analyzing a company’s ability to meet fixed financial obligations using its earnings. However, this solvency ratio has limitations. It may not account for variations in accounting practices, as earnings and expenses can be subject to different GAAP treatment. This disparity can lead to misinterpretation of a firm’s financial leverage and true creditworthiness. Moreover, the FCCR can fluctuate significantly due to one-off, non-operational events, making it potentially misleading when considered in isolation.
Adjustments for Industry-Specific Context
The FCCR formula might require adjustments for industry-specific context. For instance, companies in capital-intensive industries might inherently have lower ratios due to higher fixed charges for equipment leases. In contrast, service-oriented firms may naturally have lower fixed charges and, therefore, higher FCCR figures. Insurance companies might include insurance premiums as a fixed charge, which isn’t standard for other industries, demanding a nuanced approach to the ratio’s interpretation.
Alternative Measures and Supplementary Analysis
To understand financial health comprehensively, it’s advisable to look beyond FCCR and employ alternative measures. Supplementary analysis, like examining debt-service coverage ratios or interest-coverage ratios, provides additional insights. When used together with the FCCR, these metrics help paint a fuller picture of a company’s financial solvency and creditworthiness, offering a more robust financial health assessment.
FAQ
What is the best software for financial analysis?
Stock Rover has the broadest selection of financial metrics and tools for in-depth dividend research and analysis. With over 650 financial screening metrics, we recommend Stock Rover.
What distinguishes the Fixed Charge Coverage Ratio from the Interest Coverage Ratio?
The Fixed Charge Coverage Ratio includes all fixed charges a company is obligated to pay, such as leases and insurance premiums. In contrast, the Interest Coverage Ratio focuses solely on the company's ability to pay interest expenses.
What indicates a strong Fixed Charge Coverage Ratio?
A higher number typically represents a strong Fixed Charge Coverage Ratio, suggesting that a company generates sufficient cash flow to cover its fixed charges multiple times over comfortably.
How does Capital Expenditure affect the Fixed Charge Coverage Ratio?
Capital Expenditure, if significant, can reduce a company's cash flow available for fixed charges, potentially lowering the Fixed Charge Coverage Ratio and indicating a tighter financial position.
What is the impact of distributions on the Fixed Charge Coverage Ratio?
Distributions, such as dividends or other payouts to shareholders, reduce the cash available to cover fixed charges, negatively affecting the Fixed Charge Coverage Ratio.
How does the Fixed Charge Coverage Ratio differ in pre-tax and after-tax calculations?
The Fixed Charge Coverage Ratio can be calculated on both a pre-tax and after-tax basis. Pre-tax calculations show a company's gross income against fixed charges. In contrast, after-tax calculations provide a net perspective, showing the cash flow available after taxes to cover charges.
