Stock market crashes are inevitable.The history of stock market crashes begins with the South Sea Bubble in the early 1700s. But could 2026 be the next big one with a combined Middle East oil crisis and AI bubble?
Stock market crashes occur on average every 15 years.
Our research shows that asset bubbles, easy access to cheap credit, weak regulation, and poor institutional risk management cause crashes.
Learn the complete history and causes of stock market crashes; it might make you a wiser investor.
6 Stock Market Crashes in Numbers
The 1929 crash was the worst, declining by 89% over 3 years and taking 23 years to recover fully. The most severe crash was in 2000, dropping 38% over 30 days, followed by 1987, with a -35% drop in a single month. The 2000 dotcom bubble was also huge; the NASDAQ dropped 83% over 2 years and took 16 years to recover.
| Stock Market Crash | Size of Crash % | Crash Duration (Months) | # Years to Recover |
| 1929 | -89% | 36 | 23 |
| 1973 | -46% | 24 | 10 |
| 1987 | -35% | 1 | 2 |
| 2000 | -83% | 24 | 16 |
| 2008 | -54% | 16 | 5 |
| 2020 | -38% | 1 | 1 |
| Average | -57% | 17 | 9.8 |
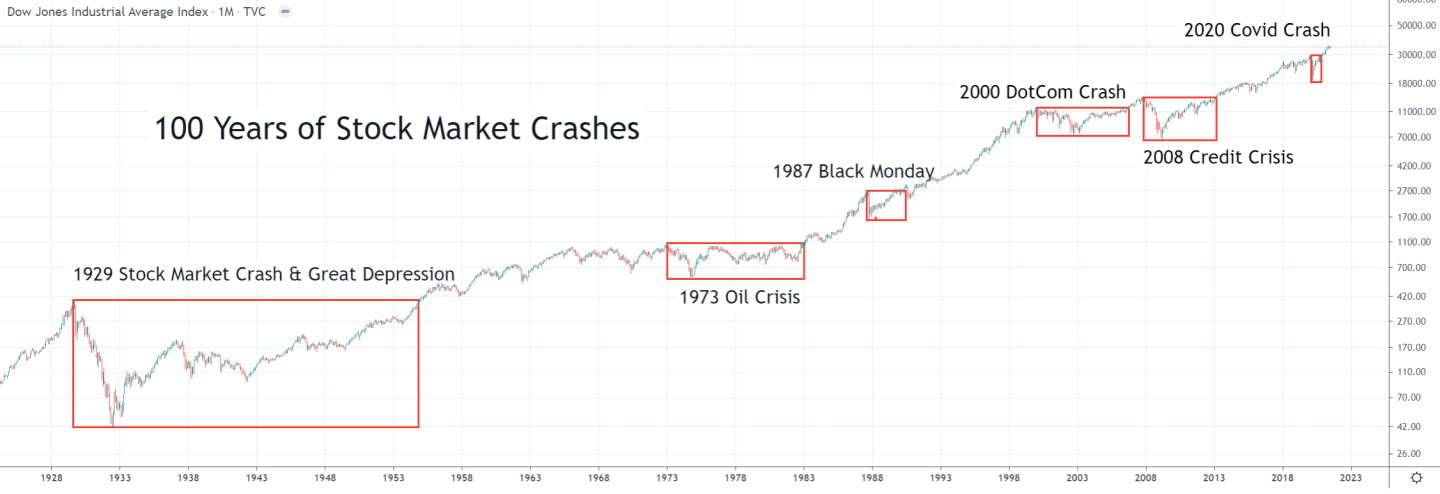
A Timeline of Historical Stock Market Crashes
The last 100 years have seen the 1929 crash and the Great Depression, the 1973 Oil Crisis, 1987’s Black Monday, the 2000 Dotcom crash, the 2008 financial crisis, the 2000 Covid Crash, and finally, the 2022 crash.
Get this chart free in TradingView
1720 The South Sea Bubble
The South Sea Bubble was a major financial crisis in 1720 after the South Sea Company, an English joint-stock company, was granted exclusive trading rights with Spanish colonies in the Americas. The company issued large amounts of stock and bonds and enticed investors to buy them by offering generous dividends.
The South Sea Company promised investors incredible trade and profits; however, these did not materialize. Instead of carrying out trade, the company served almost exclusively as a bank. It loaned money to potential buyers who kept up the demand for their stock and consequently drove up the price of shares – creating an ‘equities bubble.’ It is estimated that more than twice the amount of available stock was sold to a desperate public. The money from these new investments was then used to pay large sums to existing shareholders, many of whom have described it as the first-ever Ponzi scheme.
As investors hoped for quick profits from the stock, the bubble quickly burst, and prices crashed as investors sought to sell their overvalued stocks.
The effects of the South Sea Bubble
The effects on people were severe—the economic repercussions spread throughout Europe, leading to a major economic recession. Many investors lost their fortunes as the stock prices plummeted, and many saw their debt levels skyrocket due to over-leveraging to make more money from the bubble. People who had trusted and invested in the South Sea Company were left with almost nothing.
TradingView 4.8/5⭐ : The Best Trading Platform I’ve Tested in 20+ Years
With lightning-fast charts, powerful pattern recognition, smart screening, backtesting, and a global community of 20+ million traders — it’s a powerful edge in today’s markets.

If you want one platform that gives you an edge, this is it.
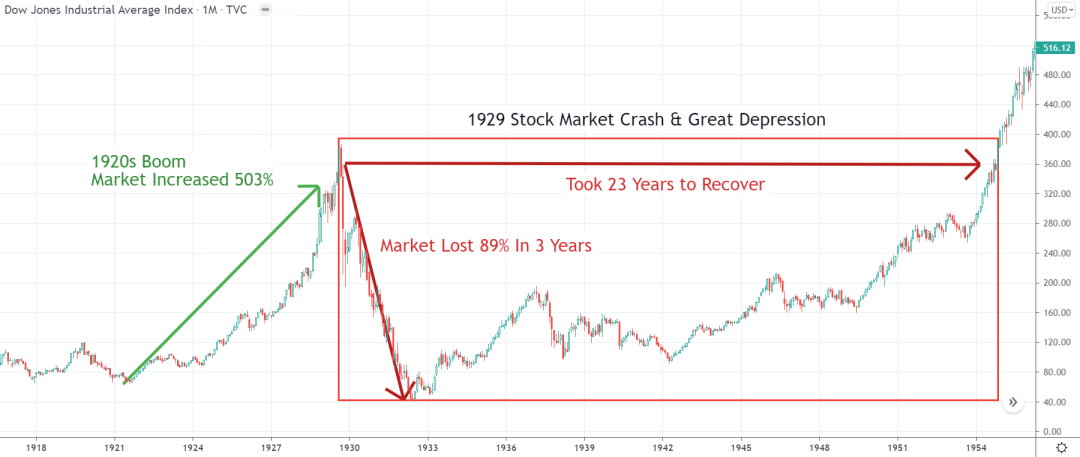
1929 & The Great Depression
A breakdown in investor confidence caused the 1929 stock market crash. The Dow had risen by over 503% in the previous nine years, led by the general public’s unrestricted access to credit, which they used to buy stocks on margin. High unemployment and an unregulated, unsustainably high stock market led to a collapse in confidence, which caused the stock market crash.
The 1929 stock market crash was largely caused by people borrowing too much to buy stocks (leverage), leading to heavy selling when prices dropped. This created a snowball effect, causing the stock market to crash and leading to high unemployment and poverty.
The 1929 Stock Market Crash in Numbers
The 1929 stock market crash and subsequent depression were the longest recession in history, lasting 23 years. The Dow Jones Industrial Average lost 89% of its value in 3 years and took 23 years to recover, causing widespread poverty, debt, and homelessness.
Get this chart free in TradingView
The increase in production output due to World War II gave economists valuable lessons in stimulating economies out of recessions.
What Caused the 1929 Crash?
The cause of the 1929 stock market crash was an asset and equity bubble driven by the general public’s unrestricted access to credit. Easy access to credit fueled a wave of highly speculative and risky investments in the stock market. Eventually, prices were unsustainably high, and the overheated stock market crashed.
The 1929 stock market crash was largely caused by people borrowing too much to buy stocks (leverage), leading to heavy selling when prices dropped. This created a snowball effect, causing the stock market to crash, leading to high unemployment and poverty.
What Has Been Done To Avoid The 1929 Crash in the Future?
Since the 1929 stock market crash, several measures have been taken to help prevent a similar disaster. The most notable action has been the introduction of the Securities and Exchange Commission (SEC), created in 1934 to ensure fair practices and accurate disclosure in the securities markets. The SEC has since introduced regulations that require companies to provide investors with the necessary financial information and to protect them from fraudulent activity.
The Federal Reserve has also taken steps to help prevent a similar crash by regulating the money supply and influencing interest rates. The Fed also has increasingly stringent requirements for banks regarding their lending practices, which have helped to reduce risk-taking in the financial markets.
In short, the introduction of market regulators and legislation to ensure accounting transparency and limit credit risk were the major steps taken to avoid another great depression.
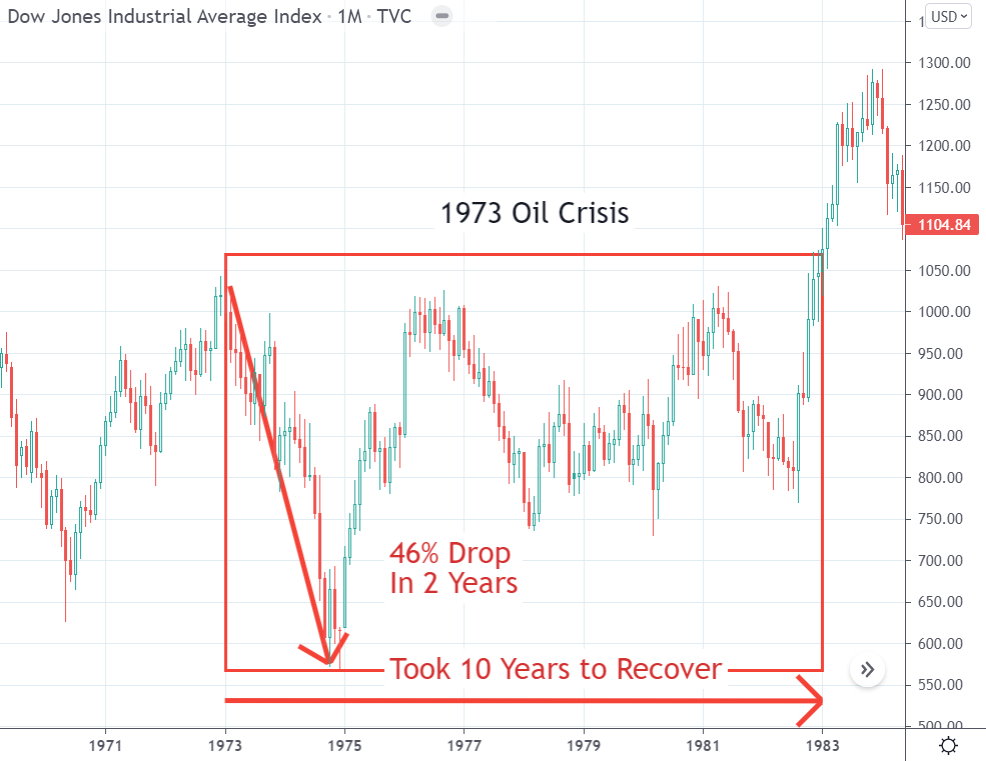
1973, the Oil Shock
In October 1973, OPEC (Organization of Arab Petroleum Exporting Countries) declared an oil embargo on countries supporting Israel during the Arab-Israeli Yom Kippur War. This was an attempt to exert political influence on Western nations, which were highly dependent on Middle Eastern oil. This led to a global economic shock wave.
The 1973 Oil Crisis In Numbers
The 1973 Oil Crisis caused a crash that wiped out 46% of the Dow Jones Industrial Average in 2 years, and it took 10 years for the index to recover from the loss.
Get this chart free in TradingView
What Caused the 1973 Oil Shock?
A combination of factors caused the 1973 Oil Shock. The most significant contributing factor was the Organization of Petroleum Exporting Countries (OPEC) decision to reduce oil production and raise prices. This decision was taken as a response to the United States supporting Israel during the Yom Kippur War between the Arab states and Israel in October 1973. OPEC’s position was that reducing production would lead to higher energy costs for Western countries, making them less likely to support Israel.
Other factors contributed to the oil shock, in addition to the OPEC decision. These included increased global demand for oil due to economic growth in the 1970s, production disruptions caused by unrest in Middle Eastern countries, and an embargo imposed by Arab nations on oil exports.
You want to be a successful stock investor but don't know where to start.
Learning stock market investing on your own can be overwhelming. There's so much information out there, and it's hard to know what's true and what's not.

Liberated Stock Trader Pro Investing Course
Our pro investing classes are the perfect way to learn stock investing. You will learn everything you need to know about financial analysis, charts, stock screening, and portfolio building so you can start building wealth today.
★ 16 Hours of Video Lessons + eBook ★
★ Complete Financial Analysis Lessons ★
★ 6 Proven Investing Strategies ★
★ Professional Grade Stock Chart Analysis Classes ★
Ultimately, geopolitical tensions and market disruption led to the 1972 stock market crash. The Oil embargo severely disrupted Western economic output and caused a massive correction in the valuation of companies dependent on oil, which was essentially most of the economy.
1973 Oil Shock Documentary
What Has Been Done To Avoid The 1973 Crash in the Future?
To avoid a repeat of the 1973 Oil Shock, several measures have been taken at both global and regional levels. On a global level, the International Energy Agency (IEA) was created in 1974 to coordinate energy policies among its members. The IEA’s mission is to help ensure global energy security by monitoring and responding to developments in energy markets.
Countries have taken various regional measures, such as forming alliances to protect their interests during an oil-related crisis. The Arab League, for example, was formed in 1945 to represent the interests of its member states and protect them from external aggression.
Western governments invested heavily in reducing dependence on imported oil; for example, Henry Kissinger unveiled the “Project Independence” program, which, by 1981, had reduced reliance on OPEC.
Stock Rover 4.7/5⭐ : My Top Pick for Smart Investors
Investing In Stocks Can Be Complicated. Stock Rover Makes It Easy.
★
Growth Investing - with industry-leading
Research Reports ★
★ Value Investing - using Warren Buffett's Fair Value and Margin-of-Safety ★
★ Income Investing - rank by yield, growth, quality, and safety using 650 metrics ★

"I have been researching and investing in stocks for 20 years! I now manage all my long-term investments using Stock Rover." — Barry D. Moore, Founder: LiberatedStockTrader.com
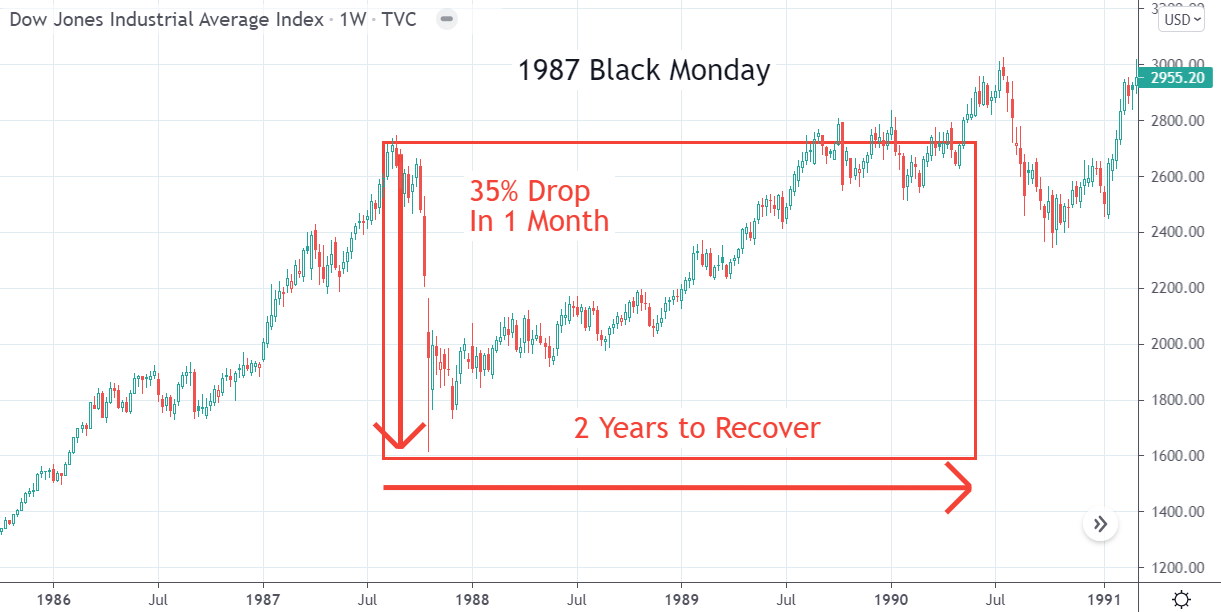
1987 Black Monday
The 1987 Black Monday crash was a major financial market crash on October 19th, 1987. It is widely considered the largest one-day stock market crash in history, with the Dow Jones Industrial Average (DJIA) plummeting 22.6%. The crash began shortly after the opening bell and continued throughout the day.
1987 Black Monday In Numbers
The 1987 Black Monday Crash was extremely aggressive, dropping 35% in 4 weeks, but it recovered relatively quickly compared to other crashes, taking only two years.
Get this chart free in TradingView
What Caused the Stock Market Crash of 1987?
The crash was caused by a combination of factors, including excessive speculation in stock markets, high levels of debt and leverage, the overvaluation of stocks following a decade-long bull market, and a sudden sell-off of stocks driven by computerized trading programs. The crash also highlighted the need for regulation in financial markets, leading to new rules that limited traders’ ability to make large bets with borrowed money and placed restrictions on short selling.
Most experts agree that investors saw the market as overvalued, trading at a P/E ratio of 23. After a strong bull market in the 1980s, there was already considerable fear. Understanding market sentiment, fear, greed, and psychology is important when investing in the stock market. When confidence is lost, it can produce a cascading effect of extreme panic selling.
What Has Been Done To Avoid The 1987 Crash in the Future?
The lessons learned from the 1987 crash led to the introduction of trading curbs. These are essentially circuit breakers that halt trading when markets experience exceptional volatility and losses. They have been used many times in future crashes and help mitigate extensive losses by introducing a cooling-off period to dissipate the fear emotions in the market.
Beat The Market, Avoid Crashes & Lower Your Risks
Nobody wants to see their hard-earned money disappear in a stock market crash.
Over the past century, the US stock market has had 6 major crashes that have caused investors to lose trillions of dollars.

The MOSES Index ETF Investing Strategy will help you minimize the impact of major stock market crashes. MOSES will alert you before the next crash happens so you can protect your portfolio. You will also know when the bear market is over and the new rally begins so you can start investing again.
MOSES Helps You Secure & Grow Your Biggest Investments
★ 3 Index ETF Strategies ★
★ Outperforms the NASDAQ 100, S&P500 & Russell 3000 ★
★ Beats the DAX, CAC40 & EURO STOXX Indices ★
★ Buy & Sell Signals Generated ★
MOSES Helps You Sleep Better At Night Knowing You Are Prepared For Future Disasters
2000 DotCom Crash
The 2000 dotcom bubble was a major financial market crash in the early 2000s. It was marked by a sharp decline in stock prices and market values of technology-related stocks, leading to significant investor losses. The crash was caused by various factors, including the overvaluation of tech stocks driven by speculation and overly optimistic forecasts, inflated salaries for tech executives, and a shift in investor sentiment away from technology stocks. The crash resulted in significant losses for investors, with the Nasdaq Composite Index losing 83% of its value between March 2000 and October 2002. It also raised questions about the role of regulation in financial markets.
The DotCom Nasdaq 100 Crash in 2000: In Numbers
The internet bubble caused a major crash for the NASDAQ, with an 83% loss over three years. It took the NASDAQ over 16 years to recover from the crash.
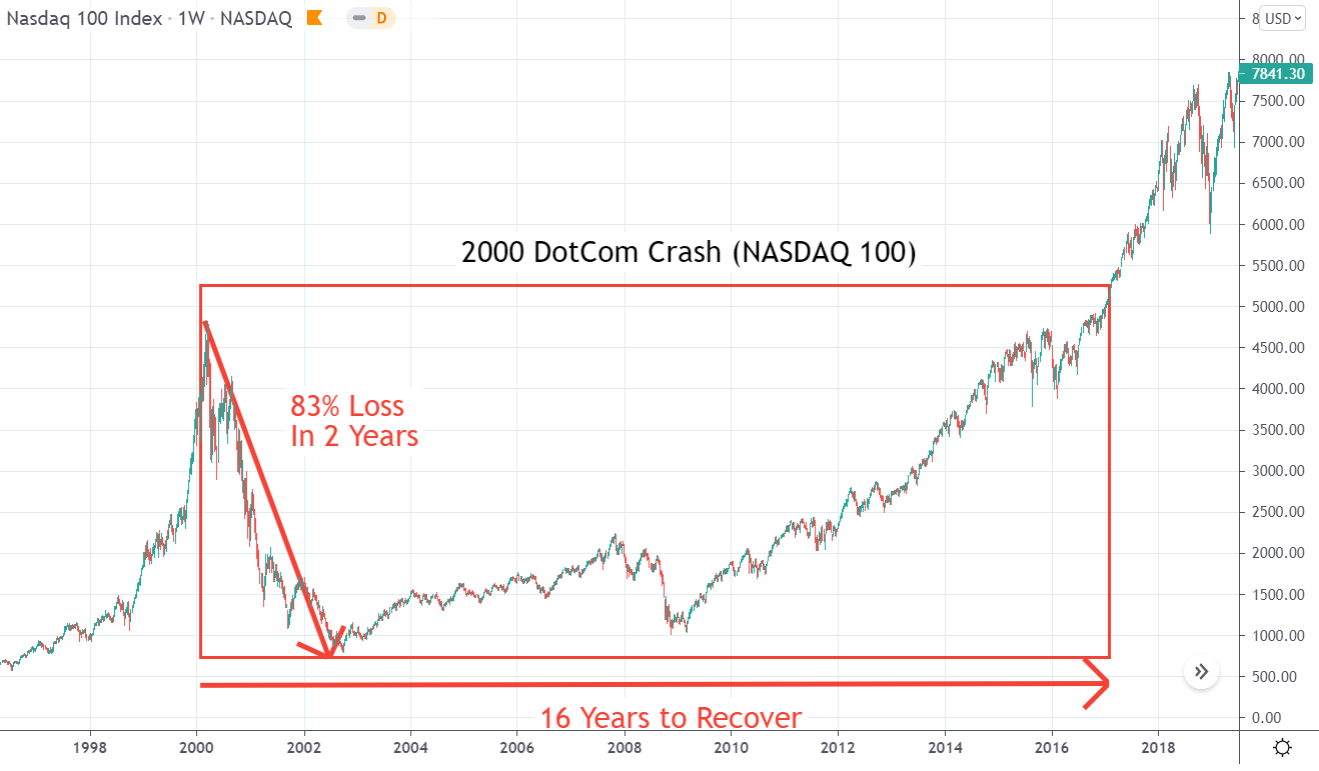
Get this chart free in TradingView
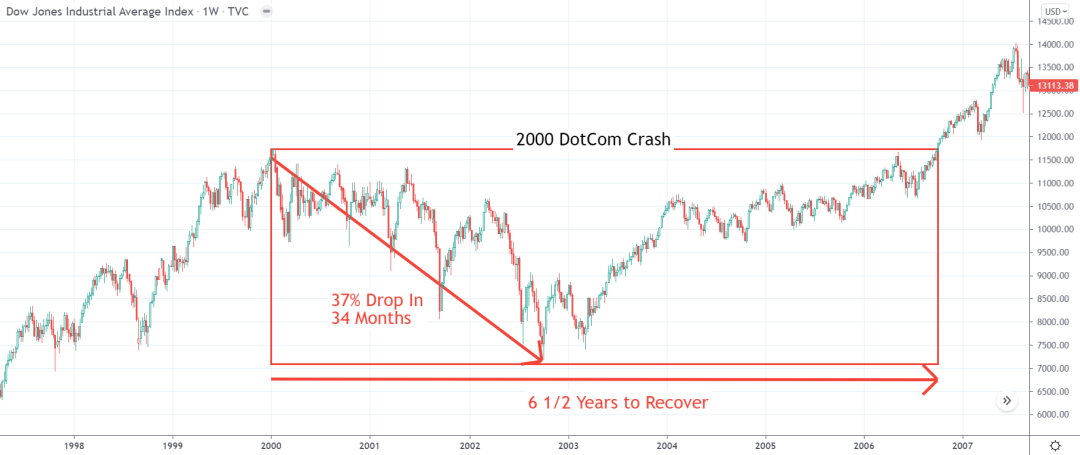
In comparison, the Dow Jones Industrial Average only dropped 37% over 34 months and took 6.6 years to recover. This was very much an “Internet Stocks” crisis, but it still impacted the broader market.
What Caused the Stock Market Crash of 2000?
From 1993 to 2000, modern web browsers and the World Wide Web enabled new ways of doing business, primarily bypassing traditional retail business models and cutting costs. This disrupted the established business models of “Bricks and Mortar” businesses. The aggressive push by new internet businesses to claim market share led companies to run at huge losses to dominate the web.
Investors rushed to buy stocks in internet-related companies, regardless of valuation. With a huge wave of investment, stock prices soared to unsustainable levels. The NASDAQ 100 rose 400% and reached a Price-Earnings Multiple of 200, which has never been seen before. With investment banks such as Citigroup and Merrill Lynch pumping the market and analysts proclaiming, “Bricks & Mortar companies are dead,” the bubble was complete.
“The collapse of the Internet bubble, perhaps one of the largest financial fiascoes in US history, came after three years, starting in January 1997, when investors would buy almost anything even vaguely associated with the Internet, regardless of valuation. Investors ignored huge current losses and were willing to pay 100 times the expected earnings in fiscal 2002. They were goaded by bullish reports from sell-side securities analysts and market forecasts from IT research firms, such as IDC, Gartner, and Forrester Research.” Source CNN Money, November 2001
In 2000, it became clear that many internet companies were burning cash fast, and bankruptcies began. This coincided with the Federal Reserve hawkishly increasing interest rates to help cool an overheating economy. With interest rate hikes and high bankruptcy rates, confidence collapsed, and so did the NASDAQ 100, which lost 83% over 2 years and took 10 years to recover.
Interestingly, the brick-and-mortar companies listed on the NYSE also suffered from the crash, with the DJ-30 losing 34% in 34 months and taking 6.5 years to recover.
2000 Dot Com Crash Documentary
What Has Been Done To Avoid The 2000 Crash in the Future?
Laws and regulations requiring full disclosure of risk and tightened rules on conflict-of-interest declarations have impacted the market. There was also a string of litigation against executives of companies involved in high-profile scandals, including Enron, WorldCom, and Andersen Consulting.
2008 Global Financial Crisis
The 2008 global financial crisis began with the bursting of the United States housing bubble in 2007. This caused home prices to drop rapidly and increased mortgage defaults, foreclosures, and lender losses. These losses quickly spread throughout the banking industry due to complex financial instruments like collateralized debt obligations (CDOs) and mortgage-backed securities (MBSs). These investments were based on high levels of borrowing and on risky derivatives, which further amplified the losses.
The 2008 Financial Crisis Crash In Numbers
The financial crisis was an aggressive crash lasting just 16 months, but it wiped out 54% of the stock value. Due to decisive central bank and government action, the recovery took five years and was not prolonged beyond necessary.
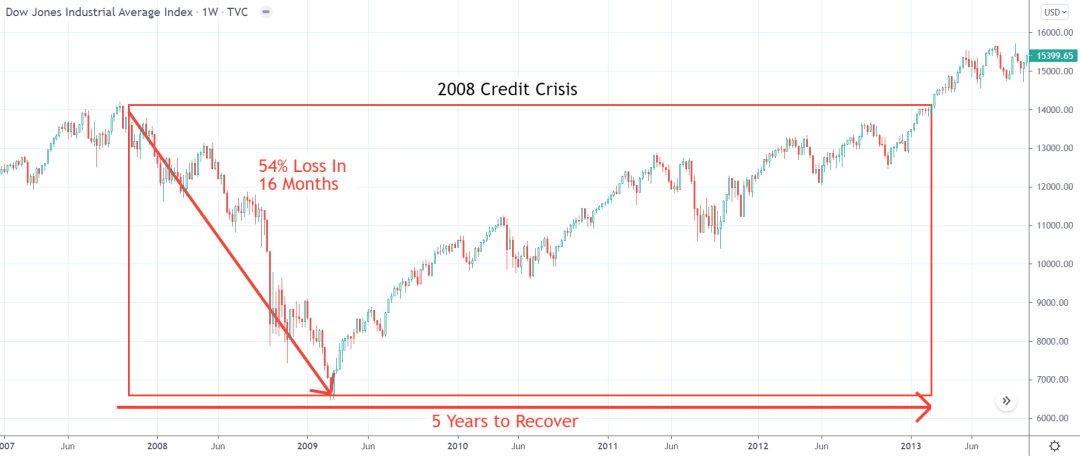
Get this chart free in TradingView
What Caused the Stock Market Crash of 2008?
Due to the weakening of the Securities and Exchange Commission (SEC) and lax financial regulation, banks took excessive risks in mortgage lending practices. The introduction of predatory lending practices, such as subprime mortgages, allowed people to buy houses with low initial repayments, but large, delayed repayments led to a huge property bubble.
These high-risk loans were hidden in Collateralized Debt Obligations (CDOs) by Citigroup and Merrill Lynch and sold to banks and funds globally. When mortgages began to default, there was a string of financial-sector bankruptcies, including the collapse of Lehman Brothers, which triggered worldwide panic and a breakdown in confidence.
2008 Financial Crisis Documentary
- For a great movie that covers the Financial Crisis, watch Inside Job
What has been done to prevent another global financial crisis?
The main response to avoid repeating the 2008 financial crisis was the introduction of the Dodd-Frank Act in 2010. It led to large-scale reform and regulatory improvements, including the establishment of the Financial Stability Oversight Council (FSOC) and enhanced regulation of derivatives and shadow banking.
Other measures designed to prevent another financial crisis include enhanced regulation of banks and other financial institutions, improved capital requirements to ensure banks are better able to withstand losses, and the creation of new global standards for banking supervision.
Ever Dreamed of Beating the Stock Market
Most people think that they can't beat the market, and stock picking is a game only Wall Street insiders can win. This simply isn't true. With the right strategy, anyone can beat the market.

The LST Beat the Market Growth Stock Strategy is a proven system that has outperformed the S&P500 in 8 of the last 9 years. We provide all of the research and data needed to make informed decisions, so you no longer have to spend hours trying to find good stocks yourself.
The LST Beat the Market System Selects 35 Growth Stocks and Averages a 25.6% Annual Return
★ 35 Stocks That Already Beat The Market ★
★ Buy The Stocks & Hold For 12 Months - Then Rotate ★
★ Fully Documented Performance Track Record ★
★ Full Strategy Videos & eBook ★
Take The Pain Out Of Stock Selection With a Proven Strategy
2020 The Covid Crash
The 2020 Covid crash was triggered by a pandemic that led to lockdowns and widespread panic worldwide. Trade ground to a halt, putting pressure on the supply chain. The outcome was widespread unemployment as people could not leave home, and the entire retail and hospitality industries were closed down overnight.
The 2020 Covid Crash in Numbers
The Corona Crash was the most aggressive and shocking, with a 38% loss in just five weeks. Luckily, the market recovered in record time due to government stimulus and support, taking just ten months to recoup the losses.
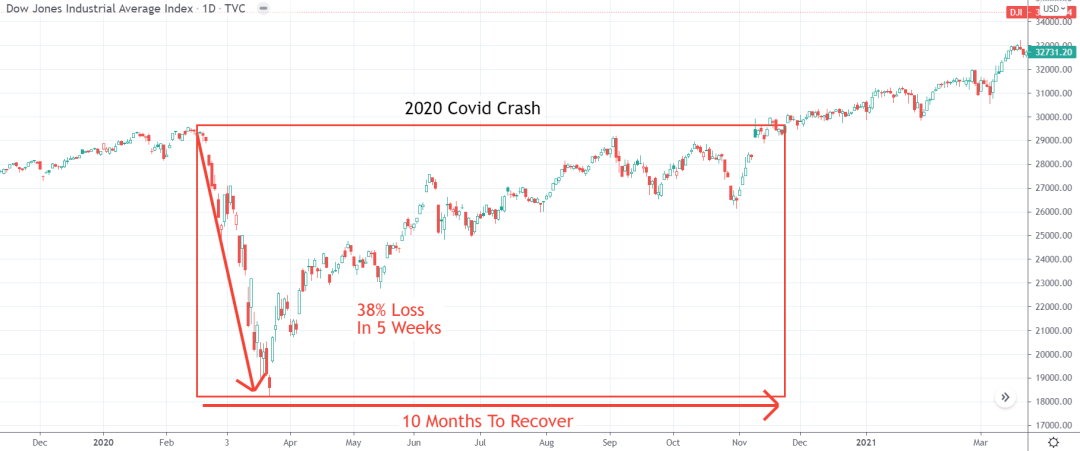
Get this chart free in TradingView
What Caused the 2020 Covid Crash?
The COVID-19 crash of 2020 differed from previous crashes because a worldwide virus pandemic, SARS-COV-2/COVID-19, caused it. The measures introduced to fight the virus, especially lockdowns and social distancing, created a surge in unemployment and retail bankruptcies.
The stock market reacted quickly, with a 38% loss occurring in only five weeks, devastating the travel, leisure, and retail industries. Interestingly, the market recovered within ten months due to the rapid reactions of governments and central banks, which supported the unemployed and industries with massive cash stimulus policies. The US issued $1.9 trillion, or 26% of its GDP, in stimulus, and the EU issued 11%, or €750 billion.
What Has Been Done To Avoid The 2020 Crash in the Future?
Avoiding this type of crash will be difficult, as the cause is not financial corruption, lack of legislation, or systemic issues. This pandemic highlighted the problems with the globalization of supply chains and the world’s reliance on China. Governments and businesses are actively diversifying out of China and increasing self-sufficiency, especially in semiconductor and vaccine production.
The 2026 Crash
Crashes often emerge when an asset bubble, easy money, weak risk controls, and a sudden external shock collide. That pattern is what makes 2026 feel so uneasy. 66% of major crashes were linked to equity or asset bubbles, while geopolitics and market disruption have also played a decisive role, especially when confidence breaks quickly.
It is fair to ask whether today’s mix of war risk, expensive equities, and concentrated optimism around artificial intelligence could become the same kind of dangerous combination.
The immediate trigger would be the U.S.-Israeli war on Iran, which supporters frame as an attempted liberation but which, from a market perspective, is first and foremost a destabilizing geopolitical shock. The conflict has disrupted trade routes, rattled businesses worldwide, and helped push oil sharply higher, with Brent briefly moving above $100 and some scenarios pointing much higher if Strait of Hormuz disruption persists.
History shows that oil spikes act like a tax on the global economy, squeezing consumers, corporate margins, transport, and sentiment all at once.
At the same time, investors are already debating whether AI enthusiasm has gone too far. I have growing concerns about an AI bubble, the scrutiny of massive hyperscaler spending, and signs that the once-simple “AI trade” is fragmenting as markets reassess winners and losers.
That is the real warning sign for 2026: not that a crash is guaranteed, but that a richly valued market, heavy dependence on a narrow AI leadership group, and a severe oil shock could form the classic setup that turns complacency into panic. The question now is whether this becomes just another scare or the precursor to the next major stock market crash.
Causes of Stock Market Crashes
The evidence suggests that the main cause of stock market crashes is a loose monetary policy that leads to easy credit access. Combine cheap money with poor institutional risk management and lack of regulatory oversight, and you get asset bubbles ready to burst.
| Crash | Cause | Cause | Cause |
| 1929 | Equity Bubble | Easy Access to Credit | Poor Institutional Risk Management |
| 1973 | Geopolitics | Oil Market Disruption | |
| 1987 | Equity Bubble | ||
| 2000 | Equity Bubble | Easy Access to Capital | Poor Institutional Risk Management |
| 2008 | Asset Bubble | Easy Access to Credit | Poor Institutional Risk Management |
| 2020 | Global Pandemic | Lockdowns | Decreased demand for services |
| 2022 | Inflation | High Employment | Easy Access to Credit/Stimulus |
5 Biggest Causes of Stock Market Crashes
The analysis shows that 66% of stock market crashes are caused by asset and equity bubbles. In fact, in three of the six crashes, ease of access to investment capital or credit fueled the asset and equity bubbles. Unrestricted access to capital resulted from poor institutional risk management. It is a cycle: low interest rates, financial deregulation, and access to cheap capital lead to equity and asset bubbles.
Only two stock market crashes were unrelated to bubbles: the 1973 oil market disruption by OPEC led to a deep correction, and the SARS-CoV-2 pandemic caused a massive drop in global demand and employment.
So, if you want to be prepared for the next crash, look for these five factors.
1. Equity & Asset Bubbles
The stock market crashes of 1929, 1987, 2000, and 2008 were caused by equity and asset bubbles. One could assert that the real cause of the bubbles was poor institutional risk management and easy access to credit, leading to risky speculation. Economist Robert J. Shiller highlights this in his Nobel Prize-winning book Irrational Exuberance.
2. Easy Access to Credit
Low interest rates and easy access to credit allow economies to expand rapidly, increasing demand and wealth generation. But there is a point at which, if not properly managed, all the capital sloshing around an economy needs to be invested somewhere. From market sentiment, fear, and greed, we know that money usually finds a home in the latest hot technologies or industries. In 2008, subprime lending caused a housing bubble; in 2000, greed and expectations in internet stocks; and in 1929, high-risk speculation in stocks using margin led to the collapse.
3. Poor Institutional Risk Management
In half of the stock market crashes, institutions’ poor risk management was a major cause. In 1929, the provision of loans for margin trading in stocks fueled the bubble. In 2000, investment banks were responsible for pumping internet stocks and IPOs, which, combined with a lack of government regulatory oversight, caused the bubble. Finally, in 2007/8, irresponsible risk management by investment banks led to asset-backed securities defaulting due to subprime mortgage lending, triggering a global financial crisis and a loss of confidence.
4. Geopolitics & Market Disruption
Wars, tariffs, and trade embargoes contributed to the destruction of wealth, but only to one major stock market crash in the Western world. However, these remain major issues that hold back wealth creation, unemployment, and much-needed improvements in the quality of life in developing nations.
5. Pandemic
The latest crash in 2020 introduced us to a new threat to our way of life: the pandemic and disease. While we have paid the price in both lives and economically for our abuse of animals, this problem is only just beginning.
3 Biggest Effects of Stock Market Crashes
We have looked at the causes of stock market crashes, but what about the effects?
1. Financial Loss
Financial losses are usually painful and swift when the market undergoes a major correction. Trillions of dollars get wiped off the value of stocks, companies, pension funds, and property. It is as if the value disappears, and at this point, we realize that our economies and wealth are built on a foundation of confidence. When that confidence erodes, so does our society and standard of living.
2. Inflation/Deflation
Since 2007, interest rates have been reduced to almost zero; this has helped fuel the recovery needed to restore wealth and boost confidence in the global economy. Low interest rates and vibrant global competition have helped to keep inflation low. We were at a point of price deflation in 2019, and in 2023, we are now facing high inflation.
Economists declared inflation dead, but it rose amid the pandemic and the sharp decline in global production. High inflation over 4% is bad for wealth creation and stock markets. Central banks’ main tool for fighting inflation is to increase interest rates, but if they increase interest rates too much, asset and equity bubbles burst.
3. High Unemployment
An unfortunate effect of stock market crashes is high unemployment and large increases in homelessness. This can take years to recover fully and causes huge amounts of mental and physical anguish to large swathes of the population.
Are Governments Managing Stock Market Crashes Better?
The positive side of this history lesson on stock market crashes is that governments and central banks are improving at managing economic crises. The Obama response to the 2008 financial crisis was effective and helped save the financial system as we know it, using stimulus, bailouts, and lower interest rates. While most governments failed to lock down and react quickly enough to the COVID-19 virus, they did enact sufficient stimulus to prevent widespread and massive poverty caused by unemployment, resulting in a quick end to the Corona crash in 2020.
How To Avoid A Stock Market Crash
The total protection of your money from a market crash is impossible. However, you can minimize risks and protect most of your investments with a few precautions. Thus, keeping most of your 401(k) assets safe in a bear market is possible. However, you must be careful not to sacrifice your portfolio’s ability to grow to avoid risks.
Move to Cash in a Crash
Generally, stocks fall in value twice as quickly as they gain value. The best price gains are longer-term uptrends over multiple years. Crashes happen quickly and violently due to the panic and fear in the market. However, a real crash can be devastating to your wealth, luckily they are fairly infrequent.

The three worst crashes of all time were the Great Depression of 1929, with 1931 at 47%, and 1937 at 39%. The next-worst year was 2008, with a 38% drop in one year.
The simple truth is that when there is a real stock market crash, most, if not all, stocks fall. So, diversification in safe stocks will not help you. Moving your portfolio to cash or government bonds is the best course of action. This means total protection from falling stocks.
However, there is one problem with moving to cash: the timing. If you move to cash too early and the market recovers quickly, you may miss out on stock market gains. Move too late, and you will have lost too much money; in this case, you should employ a dollar-cost averaging strategy.
The problem of timing your cash move is covered with our Market Outperforming Stock ETF Strategy.
FAQ
What is the definition of a stock market crash?
A stock market crash is an abrupt and dramatic decline in the value of stocks traded on the stock market. Typically, a crash occurs when there is an imbalance between the level of supply and demand for stocks, resulting in a rapid price decline that can trigger a domino effect.
What percentage drop is considered a crash?
Data suggests the threshold for a major stock market crash is typically a drop of over 30%. The 1929, 1973, 1987, 2000, 2008, and 2020 crashes averaged a 57% drop over an average of 17 months.
What is the difference between a stock correction and a crash?
A stock correction refers to a temporary decline in the value of stocks between 5-20%, unlike a crash which is an abrupt and dramatic decline of 30%+ over an average of 17 months.
When did the stock market crash?
The major stock market crashes on record were in 1929, 1973, 1987, 2000, 2008, and 2020. The biggest crashes were in 1929 when the Dow lost -89%, and in 2000 when the Nasdaq 100 lost -83%.
How does the stock market crash?
A stock market crash is usually the result of several factors beyond investors' control. It can be driven by macroeconomic events such as recessions, high inflation, rising interest rates, and lack of financial regulation.
What causes a stock market crash?
The evidence suggests the main cause of stock market crashes is a relaxed monetary policy leading to easy credit access. Combine cheap money with poor institutional risk management and lack of regulatory oversight, and you get asset bubbles ready to burst.
When was the last stock market crash?
The last major stock market crash was in 2020. The crash was triggered by the COVID-19 pandemic and the resulting economic uncertainty. However, in 2023, the market declined 27.5%, and if a recession hits, it might decline further to register a full crash in 2024.
Why did the stock market crash in 2008?
The 2008 stock market crash was caused by the housing bubble bursting and increasing consumer debt levels. The subprime mortgage crisis was caused by a lack of regulation, coupled with easy credit access, which led to a massive surge in home prices and an unsustainable level of consumer debt triggering the financial crisis.
Where does money flow during a crash?
During a stock market crash, investors tend to move their money from stocks to safer investments such as bonds, cash, and gold. As stock prices decline, investors see the risk of holding stocks as too high and look for safer alternatives. This can cause a further decline in stock prices, creating a vicious cycle.
Does money disappear during a stock market crash?
During a stock market crash, the value of stocks decreases, and yes, money evaporates. Similarly, during high inflation, the value of money also declines, meaning the destruction of wealth.
How do people first react to a stock market crash?
People often initially react to a stock market crash with shock and disbelief. Many investors may panic, rushing to sell their stocks to avoid further losses or hold onto them out of fear of missing an eventual rebound.
Did the 1929 stock market crash cause the great depression?
The 1929 stock market crash is widely regarded as having contributed to the Great Depression of the 1930s. This crash was caused by a combination of overstretched stock prices, margin trading, and a lack of regulation in the banking system. The result was an economic catastrophe that lasted 23 years.
How many times has the stock market crashed?
There have been six major stock market crashes in the last 100 years, 1929, 1973, 1987, 2000, 2008, and 2020.
Who were the presidents when the stock markets crashed?
The first major stock market crash happened in 1929 during the presidency of Herbert Hoover (R), from 1929 to 1933. The second occurred in 1973 when Richard Nixon (R) was president (1969-1974). The third crash happened in 1987 under Ronald Reagan (R) (1981-1989). The fourth was in 2000 under Bill Clinton (D) (1993-2001). The fifth crash was in 2008 under George W. Bush (R)(2001-2009). The most recent was in 2020 under Donald Trump (R) (2017-2021).
How long do stock market crashes last?
Our research shows the average stock market crash lasts 17 months, and the average time for a full stock market recovery to pre-crash prices is 9.8 years. Excluding the 1929 crash, the average time to recover is 6.8 years.
A Graphical History of Crashes
