The McClellan Oscillator is a market breadth indicator frequently used to analyze the difference between the number of advancing and declining issues on a stock exchange.
It is valued for its ability to reveal overbought or oversold conditions within the market, potentially signaling upcoming trend reversals.
Key Takeaways
- The McClellan Oscillator assesses stock market momentum through advancing and declining issues.
- It signals overbought or oversold conditions, aiding in the prediction of trend reversals.
- Daily plotting of the oscillator helps interpret the market move’s intensity and direction.
Understanding the McClellan Oscillator involves recognizing its basis in advance-decline data. The calculation takes the difference between a fast and a slow exponential moving average (EMA) of market advances minus declines. The resulting figure, plotted daily, offers insights into the market’s velocity and amplitude of movement. Analysts interpret these movements to uncover divergences, indicating bullish or bearish outcomes for market direction.
What is the McClellan Oscillator?
The McClellan Oscillator is a technical analysis indicator designed to assess the market breadth of the New York Stock Exchange (NYSE). It is renowned for its effectiveness in revealing the underlying strength or weakness of the market by comparing the number of advancing to declining stocks.
This indicator employs exponential moving averages (EMAs) of the difference between the advancing and declining issues on the NYSE. Two specific EMAs are utilized:
- A short-term EMA (typically over 19 days)
- A long-term EMA (typically over 39 days)
The oscillator’s value is calculated by subtracting the longer-term EMA from the shorter-term EMA. The resulting figure indicates the market’s momentum by identifying trend shifts. Positive values suggest a rising market trend with more advances than declines, while negative values signal a downward trend, implying more declines.
Employing the McClellan Oscillator involves watching for key levels and patterns:
- Centerline crossovers: When the Oscillator crosses above or below zero, it may indicate a shift in the market trend.
- Overbought/Oversold conditions: High or low oscillator values can suggest an overextension in the respective direction.
Traders and analysts find the McClellan Oscillator instrumental for short-term trading signals and longer-term market analyses, especially when combined with other market indicators, to confirm trends and forecast potential reversals.
Since its inception, the McClellan Oscillator has evolved and found a place in the everyday tools of market analysts. It has matured into an indicator that assesses the stock exchange climate and enhances market timing strategies. This tool signals the ebb and flow of the markets, reflecting the shifts in money entering or leaving the NYSE, adding depth to the analysts’ toolkit.
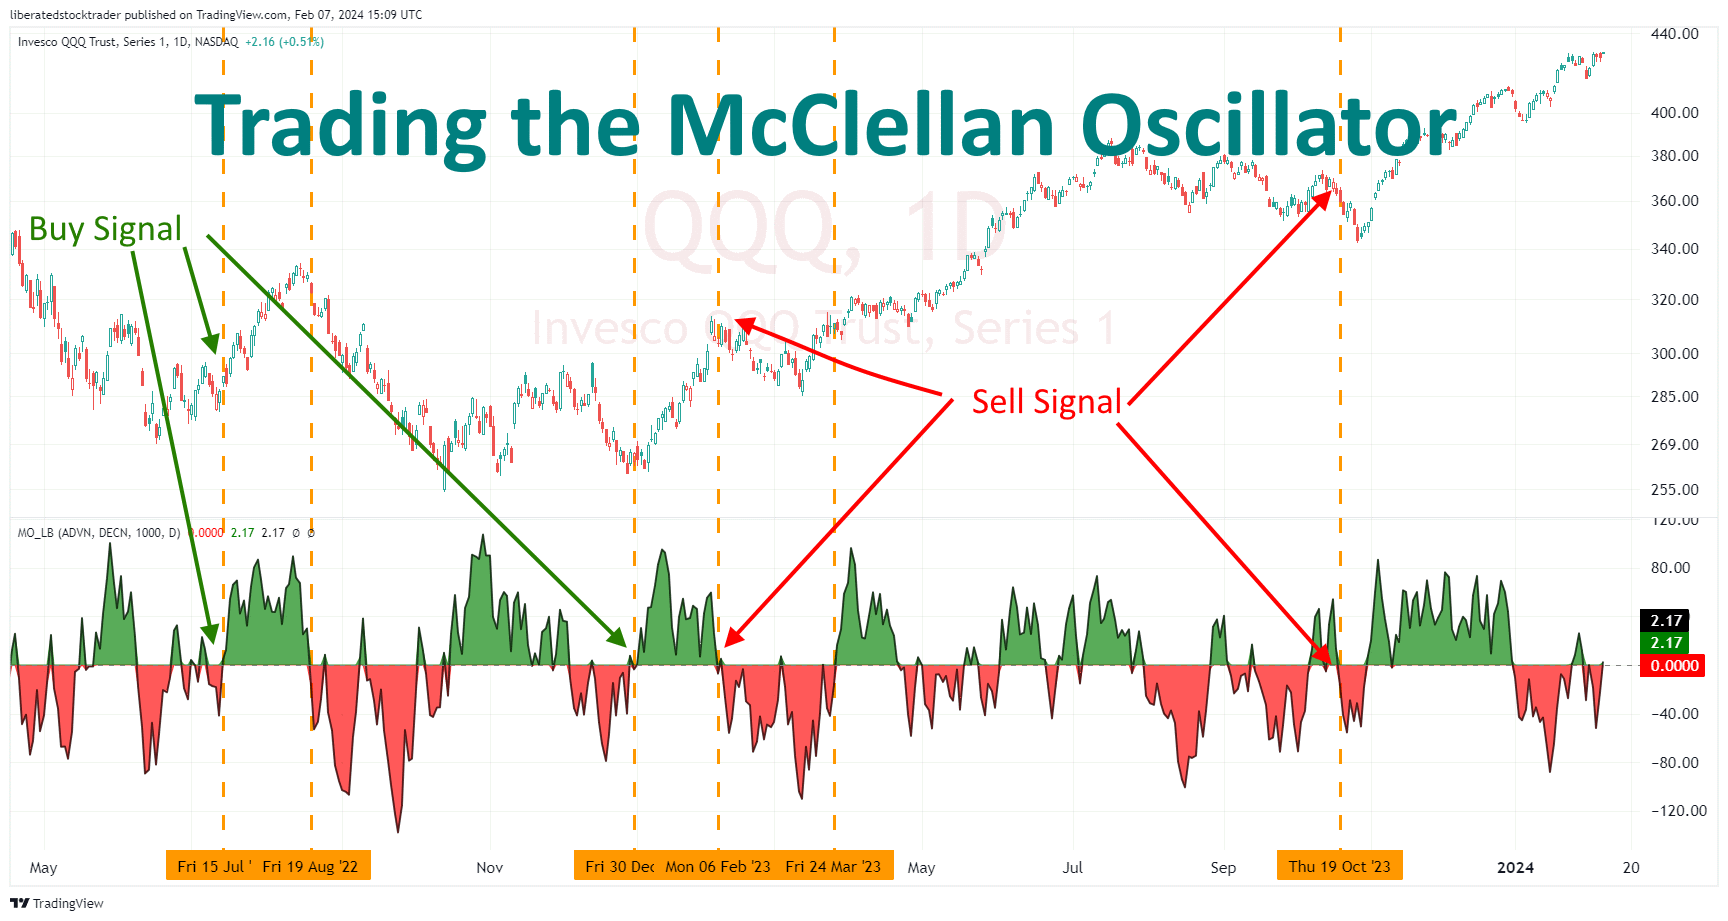
Trading the McClellan Oscillator
The McClellan Oscillator is a momentum indicator that measures market breadth, using the difference between advancing and declining issues on the NYSE. This oscillator is valuable for traders looking to gauge the underlying trend and spot potential reversals in the market.
Identifying Trends
When using the McClellan Oscillator, a consistent reading above zero suggests an uptrend in the market since more stocks on the NYSE are advancing than declining. Conversely, sustained readings below the zero point indicate a downtrend. The degree and duration of these readings can offer insights into the strength and longevity of a trend.
Trade the McClellan Oscillator with TradingView
Signal Generation
Crossovers are central to the McClellan Oscillator’s ability to generate buy and sell signals. A crossover above the zero line can signal a buying opportunity, as it may indicate the beginning of an uptrend. On the flip side, a crossover below this line could suggest a selling point, potentially marking the start of a downtrend.
Overbought and Oversold Conditions
The oscillator also identifies when the market is overbought or oversold. Extreme positive values may imply an overbought market, warning of a potential downturn. Equally, extreme negative values often reflect an oversold market, which could precede a market upswing. However, traders are cautious since these conditions can persist longer than anticipated.
Breadth Thrust Indicator
As a breadth thrust indicator, the McClellan Oscillator can reveal strong movements, known as “breadth thrusts,” that signal robust market participation. A sharp and large-scale move from negative to positive territory indicates a breadth thrust, which can be seen as a strong bullish condition and could suggest the start of a significant uptrend.
TradingView 4.8/5⭐ : The Best Trading Platform I’ve Tested in 20+ Years
With lightning-fast charts, powerful pattern recognition, smart screening, backtesting, and a global community of 20+ million traders — it’s a powerful edge in today’s markets.

If you want one platform that gives you an edge, this is it.
Calculating the McClellan Oscillator
The McClellan Oscillator is a market breadth indicator that quantifies the difference between the number of advancing and declining issues on the NYSE or NASDAQ. It uses exponential moving averages (EMAs) to filter daily stock movements.
Understanding EMA
Exponential Moving Average (EMA) prioritizes recent prices over older ones through a formula that applies greater weight to the most recent price data. Two key EMAs used in the McClellan Oscillator are the 19-day (approximated as a 10% Trend) and the 39-day (approximated as a 5% Trend) EMAs. These reflect short-term and intermediate market trends, respectively.
McClellan Oscillator Formula
The formula for the McClellan Oscillator takes the difference between the short-term EMA (19-day) and the long-term EMA (39-day) of the market’s advancing issues minus declining issues:
The McClellan Oscillator Formula can be expressed as follows:
McClellan Oscillator = EMA(19-day) of advancing issues – EMA(19-day) of declining issues
Where:
- EMA(19-day) represents the Exponential Moving Average calculated over 19 days
- Advancing issues represent the number of stocks that closed higher than their previous day’s closing price.
- Declining issues indicate that the number of closed stocks was lower than the previous day.
This resulting figure is then plotted as a line oscillating around a zero point, indicating overbought or oversold conditions. By analyzing these movements, investors and traders can detect bullish or bearish momentum within the market.
Using the McClellan Oscillator with Other Technical Indicators
The McClellan Oscillator is a momentum indicator pivotal in comparative technical analysis, offering unique insights beyond other indicators. It shows the market breadth, evaluated by the balance of advancing and declining issues.
Comparison with MACD
When assessed against the Moving Average Convergence Divergence (MACD), the McClellan Oscillator displays differences primarily in scope and function. While both are considered oscillators, McClellan focuses on the aggregate movements of the stock market, calculating the net difference between advancing and declining issues. The MACD, on the other hand, highlights the relationship between two moving averages of an asset’s price. It is a more direct momentum indicator used to detect changes in price action and trend strength through its convergence and divergence with the asset’s price.
Correlation with Price Action
The McClellan Oscillator’s movements may not always mirror direct price action; rather, they reflect the broader momentum of the market by understanding market breadth. Highs or lows on the oscillator can signal overbought or oversold conditions when there is a divergence from the actual price. On a granular level, traders utilize the McClellan Summation Index, a running total of daily values of the McClellan Oscillator, to determine the market’s longer-range oscillation and preemptively gauge shifts in market sentiment.
Applications in Different Markets
The McClellan Oscillator has demonstrated versatility by providing valuable insights across various investment mediums. Its adaptability to different market dynamics makes it a reliable tool for assessing market breadth.
Equity Markets
In Equity Markets, the McClellan Oscillator is a proven instrument for measuring the momentum underlying the New York Stock Exchange (NYSE) and NASDAQ. It operates by assessing the number of advancing versus declining stocks, offering traders a glimpse into the overall health and direction of the stock market. Importantly, its efficacy lies in signaling potential reversals or continuations of market trends, making it a staple in the technical analyst’s toolkit.
Cryptocurrency Markets
Transitioning to the nascent Cryptocurrency Markets, this indicator has found a place in the volatile realm of digital assets. Despite being relatively new, it captures the pulse of cryptocurrency movements, lending itself to analysis of currencies like Bitcoin. Crypto traders apply the McClellan Oscillator to gauge market sentiment, aiding in decisions when navigating the unpredictable swings characteristic of cryptocurrency exchanges.
You want to be a successful stock investor but don't know where to start.
Learning stock market investing on your own can be overwhelming. There's so much information out there, and it's hard to know what's true and what's not.

Liberated Stock Trader Pro Investing Course
Our pro investing classes are the perfect way to learn stock investing. You will learn everything you need to know about financial analysis, charts, stock screening, and portfolio building so you can start building wealth today.
★ 16 Hours of Video Lessons + eBook ★
★ Complete Financial Analysis Lessons ★
★ 6 Proven Investing Strategies ★
★ Professional Grade Stock Chart Analysis Classes ★
Analyst Views and Market Sentiment
Market analysts often turn to the McClellan Oscillator to gauge the undercurrents of market sentiment. They analyze this tool since it reflects the comprehensive balance between advancing and declining issues within stock indexes. Positive values of the oscillator suggest that bullish sentiment prevails as more stocks advance, indicating a potential uptrend in the market. Conversely, negative values signal that bearish sentiment dominates with more declining stocks, potentially foreshadowing a downturn.
Through its Exponential Moving Averages (EMAs), the oscillator provides a smoothed representation of market momentum. Analysts look for certain thresholds to be crossed, which specify breadth thrusts—sharp changes in market sentiment. For instance, a strong positive value may be read as an overbought condition, while an extreme negative value might indicate oversold conditions.
Standard Thresholds:
- Overbought: +100
- Oversold: -100
When the values fluctuate near the zero line, market sentiment is considered neutral, and analysts might predict a lateral or uncertain market movement. However, sustained positive or negative trends in the oscillator values can underscore deeper market shifts that may be in play.
Analysts also recognize the importance of divergences between the McClellan Oscillator and market indexes. If an index reaches new highs but the oscillator fails to do so, it might signal that fewer stocks are participating in the rally, suggesting weakened market breadth.
In summary, knowledgeable market professionals employ the McClellan Oscillator for its nuanced view of market sentiment across indexes, as it can reveal underlying trends that are not immediately apparent from price movements alone.
Future Trends and Adaptations
The McClellan Oscillator has established itself as a robust tool for interpreting market breadth. It offers insights into overall market trends by calculating advancing versus declining stock issues. Its basis is the stocks’ exponential moving averages (EMA), which provide a dynamic gauge for traders. As financial markets evolve, adaptations to the McClellan Oscillator are anticipated to harness advancements in computational techniques and data analytics.
- Machine Learning Integration: With the increasing role of machine learning and AI trading software in financial analysis, the McClellan Oscillator can be combined with predictive algorithms to enhance the accuracy of trend predictions.
- EMA Modifications: As markets exhibit higher volatility, optimizing the EMA parameters (commonly 19-day and 39-day) to suit different market conditions could be a potential adaptation, thereby making the indicator more responsive or stable as needed.
- Real-time Analytics: The demand for real-time data points to modifications enabling the McClellan Oscillator to offer more immediate signals, reducing the lag accompanying EMA-based indicators.
- Integration with Other Indicators: Combining the McClellan Oscillator with other technical indicators, such as RSI or MACD, could lead to better outcomes.
These potential adaptations reflect a market that constantly balances the need for time-tested indicators with new technologies and methodologies. As such, the McClellan Oscillator will likely remain a mainstay among trading strategies while evolving with the financial landscape.
FAQ
What is the best charting software for the McClellan Oscillator?
Very few stock market tools support the McClellan Oscillator, but through community-generated scripts in TradingView, you will find a robust free implementation of this indicator.
How is the McClellan Oscillator used to measure market breadth?
The McClellan Oscillator is an indicator that assesses the market's overall health by measuring the momentum of the advancing and declining stocks. A positive value suggests market strength, while a negative value indicates market weakness.
What is the formula for calculating the McClellan Oscillator?
The McClellan Oscillator formula involves subtracting a 39-day exponential moving average of the NYSE's advancing minus declining issues from a 19-day exponential moving average of the same value.
How can the McClellan Oscillator be interpreted for S&P 500 market analysis?
When applied to the S&P 500, the McClellan Oscillator helps identify overbought or oversold conditions. High positive values can signify potential downward reversals, while deep negative values may indicate possible upward reversals.
What are the differences between MACD and the McClellan Oscillator as technical analysis tools?
While MACD and the McClellan Oscillator are momentum indicators, MACD applies to individual stock price movements. In contrast, the McClellan Oscillator tracks the breadth of the market by analyzing advancing and declining issues.
How can one implement the McClellan Oscillator in Python for algorithmic trading?
Implementing the McClellan Oscillator for algorithmic trading in Python involves calculating the difference between two exponential moving averages of advancing minus declining issues, which can be programmed using numerical libraries such as NumPy or pandas.
What constitutes a sell signal when using the McClellan Oscillator in trading?
A sell signal using the McClellan Oscillator may indicate a crossover from positive to negative values, suggesting that declining issues are starting to outpace advancing ones, potentially signifying a market downturn.
Who invented the McClellan Oscillator?
Developed by Sherman and Marian McClellan, the McClellan Oscillator was introduced as a method to gauge the stock market's breadth. It emerged from the New York Stock Exchange (NYSE) observation and aimed to reveal underlying market trends by examining the number of advancing versus declining issues.